Cloudflare, Inc.: revenue accelerated to 39.2%, but the GAAP loss widened and net debt rose by $1.1bn in the quarter

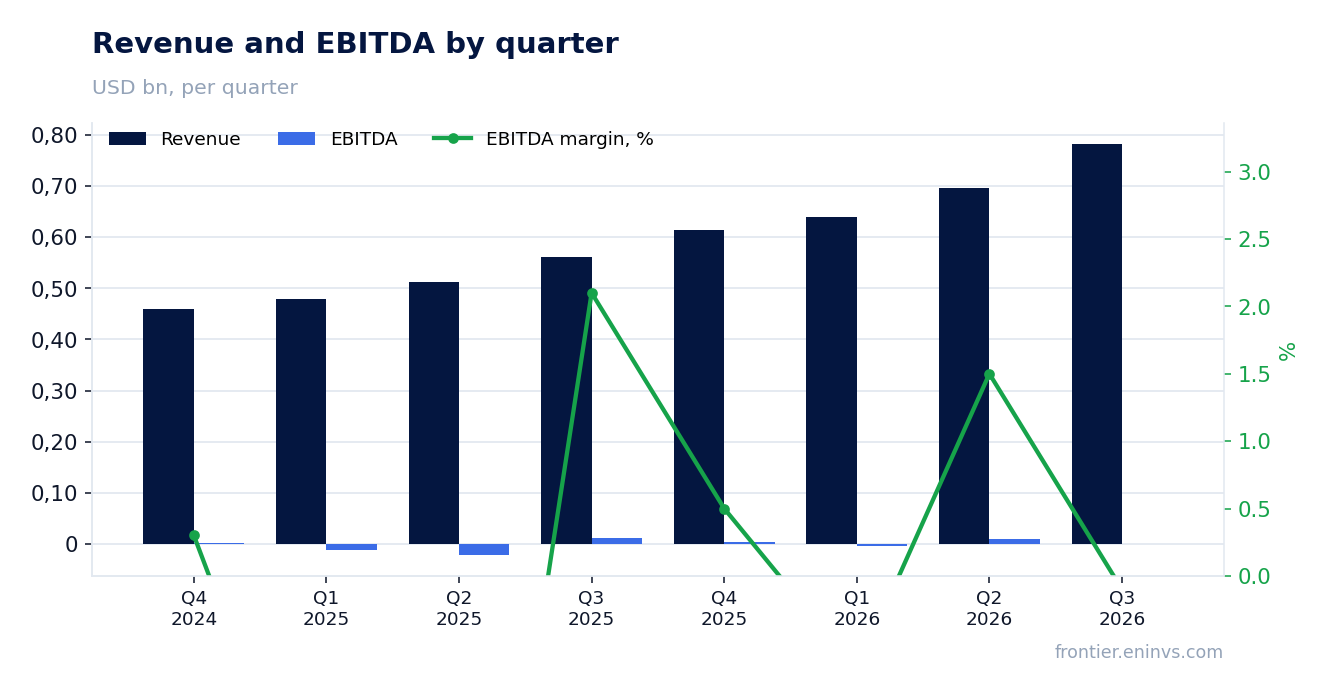
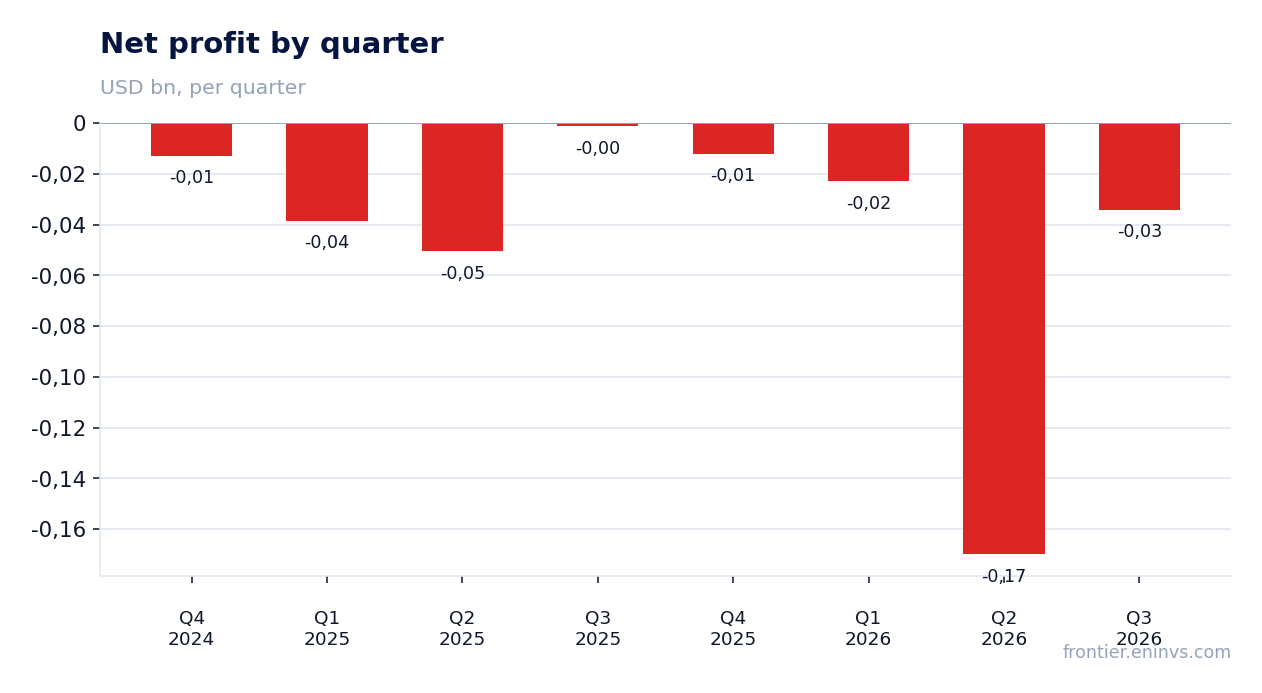
On 5 November Cloudflare, Inc. reported results for the third quarter of 2026. Revenue reached $782.5 million, up 39.2% year over year and accelerating from 35.9% in the second quarter, while the GAAP operating loss was $67.9 million, the net loss $34.1 million and EBITDA came in at zero. The business is growing faster than at any point in recent years, but that growth is not yet converting into profit, and leverage rose noticeably during the quarter; at a market capitalisation above $87 billion the share looks neutral – the growth is real, but the price leaves little margin of safety.
Key takeaways
— Revenue accelerated to 39.2% – the fastest growth in nearly four years, driven by the platform rather than a one-off deal
— The GAAP operating loss widened to $67.9 million because sales and R&D costs are growing faster than revenue
— Adjusted operating income of $137.1 million rests on excluding $174.1 million of stock-based compensation and one-off items
— Free cash flow of $82.1 million came in below last year as capital expenditure rose to $121.8 million
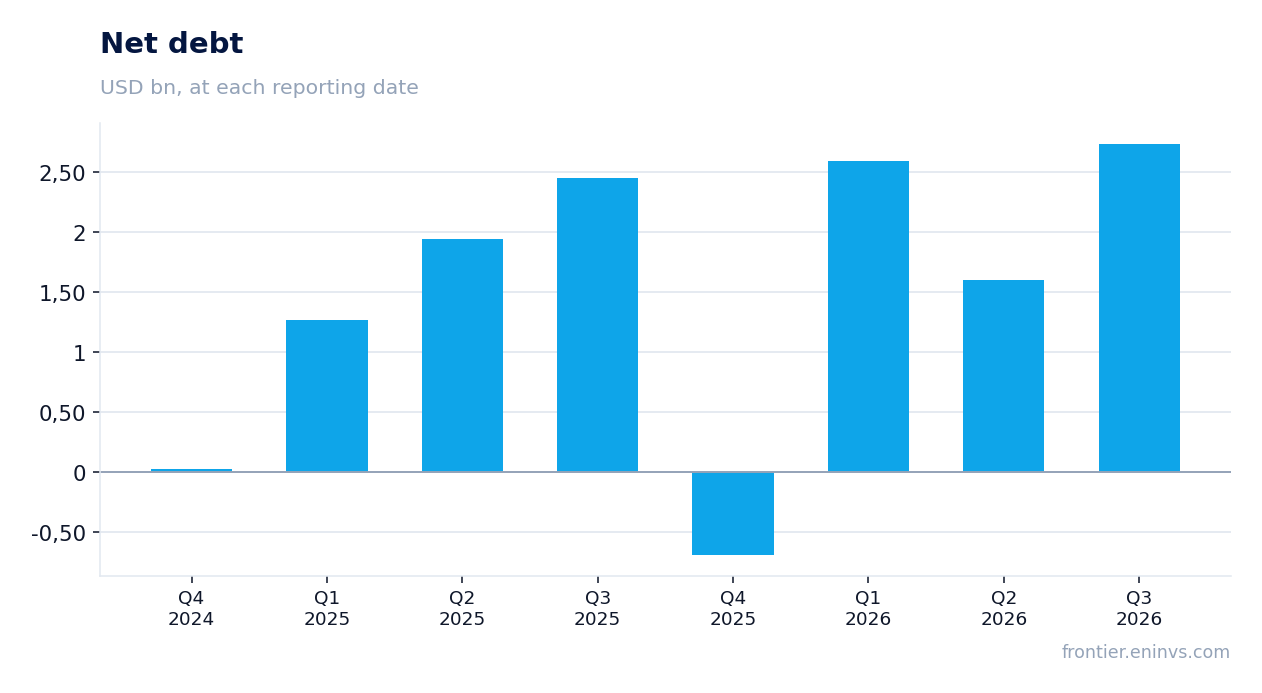
— Net debt rose from $1.6 billion on 30 June to $2.7 billion on 30 September as the company raised $2.5 billion in new convertible notes
— Q4 guidance of $845–846 million implies further acceleration, but GAAP profitability remains negative
— At an $87.4 billion market cap and a negative return on equity of -8.8%, the share is priced for growth rather than current profit
Attractiveness
Key figures, USD bn
| Metric | Q3 2025 | Q3 2026 | Change |
|---|---|---|---|
| Revenue | 0.56 | 0.78 | +39.2% |
| EBITDA | 0.01 | -0.00 | -104.6% |
| Operating profit | -0.04 | -0.07 | — |
| Net profit | -0.00 | -0.03 | — |
| Operating cash flow | 0.17 | 0.22 | +28.9% |
| Capex | 0.08 | 0.12 | +43.9% |
| EBITDA margin | 2.1% | -0.1% | -2.2 pp |
| Net margin | -0.2% | -4.4% | -4.2 pp |
Revenue accelerated to 39.2% – the fastest growth in nearly four years, driven by the platform rather than a one-off deal
Third-quarter revenue was $782.5 million, up 39.2% year over year. That is an acceleration from 35.9% in the second quarter and the fastest growth in nearly four years, as the issuer itself notes. Annualised revenue crossed $3 billion.
Growth was supported by Current RPO, which rose 37% year over year. That means next-period revenue is already largely contracted, and the acceleration does not look like a random spike.
Management attributes the result to its platform for the AI-powered Internet and escalating security threats. The release gives no segment breakdown, so the contribution of individual products cannot be assessed, but the overall tone is that this was the best quarter in the company's history.
The GAAP operating loss widened to $67.9 million because sales and R&D costs are growing faster than revenue
The GAAP operating loss was $67.9 million versus $37.5 million a year earlier, or 8.7% of revenue. Gross profit rose to $557.2 million, but gross margin fell to 71.2% from 74.0% – growth is getting more expensive.
The main pressure comes from sales and marketing: $338.0 million versus $236.3 million a year earlier. R&D rose to $168.2 million from $121.0 million. Both lines are growing faster than revenue, which is what erodes the operating result.
The release also includes one-off items: $11.0 million of restructuring and a $10.7 million legal reserve. Without them the loss would be smaller, but even excluding one-offs the GAAP result remains negative.
Adjusted operating income of $137.1 million rests on excluding $174.1 million of stock-based compensation and one-off items
Non-GAAP operating income was $137.1 million, or 17.5% of revenue, versus $85.9 million and 15.3% a year earlier. Adjusted margin improved, and this is management's main argument for operating leverage.
The gap to the $67.9 million GAAP loss is explained by exclusions: $174.1 million of stock-based compensation and related taxes, $9.2 million of intangible amortisation, $11.0 million of restructuring and a $10.7 million legal reserve. Stock-based compensation rose from $119.7 million a year earlier, more than 45% higher.
Adjusted net income was $143.7 million, or $0.38 per share, versus $0.27 a year earlier. Profitability on paper is improving, but it rests on excluding a fast-growing line that represents real dilution for shareholders.
Free cash flow of $82.1 million came in below last year as capital expenditure rose to $121.8 million
Operating cash flow was $215.4 million versus $167.1 million a year earlier. That is a strong result, and it grew faster than revenue, pointing to good cash collection from customers.
However, capital expenditure rose to $121.8 million from $84.6 million, and capitalised development costs to $11.5 million. As a result, free cash flow was $82.1 million versus $75.0 million a year earlier, but its margin fell to 10% from 13%.
For the nine months, free cash flow was $222.5 million on revenue of $2,118.3 million. The company remains cash-generative, but rising infrastructure investment is consuming a growing share of the operating result.
Net debt rose from $1.6 billion on 30 June to $2.7 billion on 30 September as the company raised $2.5 billion in new convertible notes
Net debt stood at $2.7 billion on 30 September versus $1.6 billion on 30 June, an increase of $1.1 billion in the quarter. Over the year, from 30 September 2025, the increase was $0.3 billion – from $2.4 billion to $2.7 billion.
The increase reflects the issuance of $2.5 billion of new convertible notes and the repayment of $1.29 billion of old ones. Cash and available-for-sale securities at quarter-end were $5.1 billion, so the liquidity buffer remains large.
Interest expense is modest at $3.5 million for the quarter, and interest income of $45.4 million more than covers it. The debt is not yet a cash-flow burden, but its absolute level has risen and is worth watching.
Q4 guidance of $845–846 million implies further acceleration, but GAAP profitability remains negative
The company guides Q4 revenue to $845–846 million, implying growth of roughly 37–38% year over year – slightly slower than in Q3 but still above the Q2 level. Full-year 2026 guidance is $2,963–2,964 million.
Adjusted operating income is guided at $156–157 million for Q4 and $462–463 million for the year. Full-year adjusted earnings per share are guided at $1.35.
The guidance does not imply a return to GAAP profitability: the gap between adjusted and GAAP profit remains wide because of stock-based compensation and one-off items. For investors, this means revenue acceleration is not yet converting into accounting profit.
At an $87.4 billion market cap and a negative return on equity of -8.8%, the share is priced for growth rather than current profit
The company's market capitalisation is $87.4 billion against trailing-twelve-month revenue of $2.7 billion. That is more than 30 times revenue – a valuation that assumes either very long growth or future margin expansion that is not yet visible in the accounts.
Return on equity is negative at -8.8%. Adjusted profit exists, but it rests on exclusions, while the GAAP loss is widening. The facts do not include a three-year history of valuation multiples, so it is not possible to judge whether this is expensive or cheap relative to its own history.
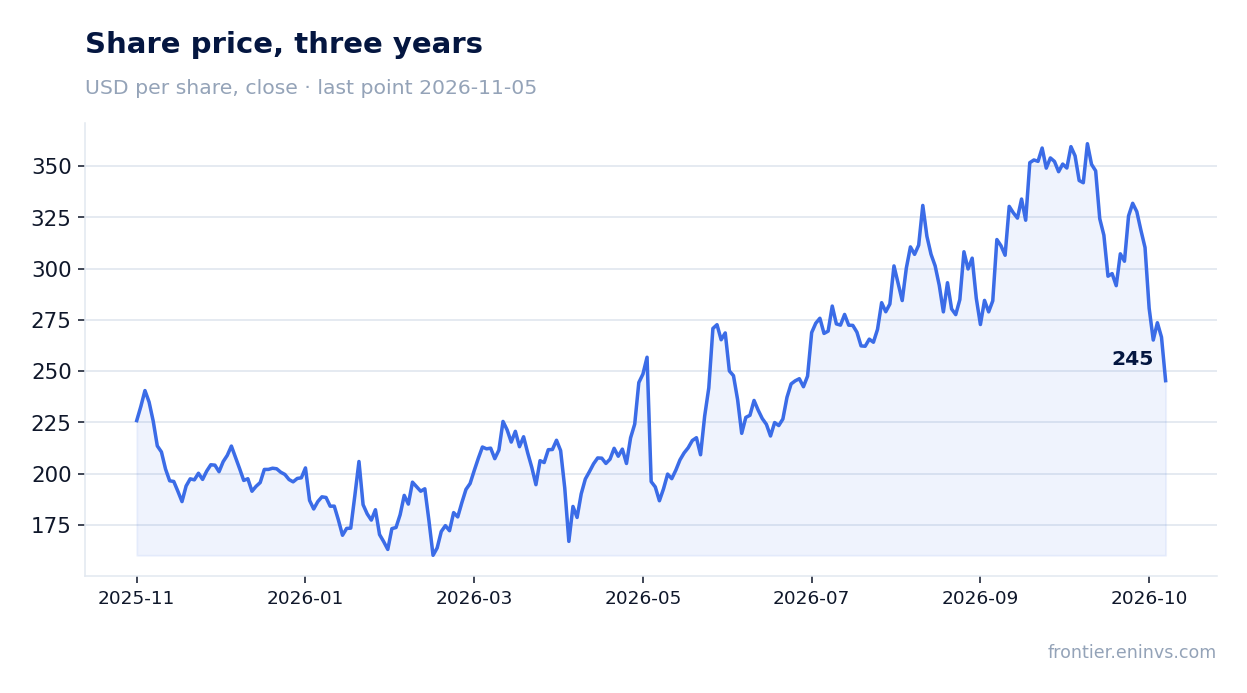
The market reaction was sharply negative: the share fell 8.0% on the release day and remained at that level by 5 November. The market apparently expected more from the revenue acceleration, or was spooked by the rise in debt and the loss.
Valuation on the latest reported figures
| Metric | Value |
|---|---|
| Market cap | 87.4 bn USD |
| P/B | 59.88 |
| Operating cash flow (LTM) | 0.68 bn |
| ROE | -8.8% |
Bottom line
The strong point of the report is the acceleration of revenue to 39.2% and Current RPO growth of 37%, which points to genuine demand for the platform. The weak point is the GAAP loss of $67.9 million and the rise in net debt to $2.7 billion, as well as the decline in free cash flow to $82.1 million. Adjusted profit of $137.1 million looks good, but it rests on excluding $174.1 million of stock-based compensation. At an $87.4 billion market cap the share is priced for future growth rather than current profit, and is therefore neutral: revenue acceleration is a plus, but the absence of GAAP profit and rising debt are minuses.
Open the company's financial profile NET →
See also: market overview · valuation map · stock screeners