NETFLIX INC: revenue growth slowed to 11.8% while profit jumped 43.9% on expense timing

On 20 October NETFLIX INC reported third-quarter 2026 results: revenue of $12,874.0 million (+11.8% year over year), operating profit of $4,459.0 million, and net profit of $3,664.0 million (+43.9%). Revenue growth slowed from 13.4% in the second quarter, but the margin rose to 34.6% from 28.2% a year earlier – partly on expense timing. At an EV/EBITDA of 19.3 against its own three-year average of 32.5 and a +21% upside on the portal's model, the share looks attractive, though slowing revenue and the one-off nature of part of the profit call for caution.
Key takeaways
— Revenue grew 11.8%, but that is slower than 13.4% in the second quarter – the third consecutive quarter of deceleration
— The 34.6% operating margin rose from 28.2% mainly on expense timing, not a durable cost reduction
— Net profit +43.9% against revenue +11.8% – the gap came from a low prior-year base, not operating leverage
— Free cash flow of $2,884.0 million rose from $2,660.5 million, and the company bought back $4.8 billion of stock – a quarterly record
— Leverage is moderate: net debt of $7,113.9 million, net debt/EBITDA LTM of 0.5
— EV/EBITDA of 19.3 is 41% below its own three-year average of 32.5 – the share is cheaper than its history
— The 2026 forecast was cut on advertising to $2.7 billion from $3.0 billion, but the 31.5% margin and 13% revenue growth are maintained
Attractiveness
Key figures, USD bn
| Metric | Q3 2025 | Q3 2026 | Change |
|---|---|---|---|
| Revenue | 11.5 | 12.9 | +11.8% |
| EBITDA | 3.34 | — | — |
| Operating profit | 3.25 | 4.46 | +37.3% |
| Net profit | 2.55 | 3.66 | +43.9% |
| Operating cash flow | 2.83 | 3.16 | +11.9% |
| Capex | 0.16 | — | — |
| EBITDA margin | 29.0% | — | — |
| Net margin | 22.1% | 28.5% | +6.4 pp |
Revenue grew 11.8%, but that is slower than 13.4% in the second quarter – the third consecutive quarter of deceleration
Third-quarter 2026 revenue was $12,874.0 million, up 11.8% year over year. That is below 13.4% in the second quarter and 16.2% in the first – growth has decelerated for three consecutive quarters. The company attributes growth to subscriptions, pricing and advertising, plus a favourable foreign-exchange effect.
The regional picture is uneven. UCAN contributed $5,628.2 million (+11%), EMEA $4,106.6 million (+11%), LATAM $1,602.6 million (+17%), and APAC $1,536.8 million (+12%). Latin America remains the fastest region, but its growth also slowed from 21% in the second quarter. In India the company cites a record quarter of paid net additions and revenue growth of about 18% on an FX-neutral basis.
The slowdown coincides with the 2026 price increases. The company says member response matches prior adjustments and expectations, and churn improved year over year. But pricing is what is carrying revenue growth, while subscriber growth in mature regions is close to saturation.
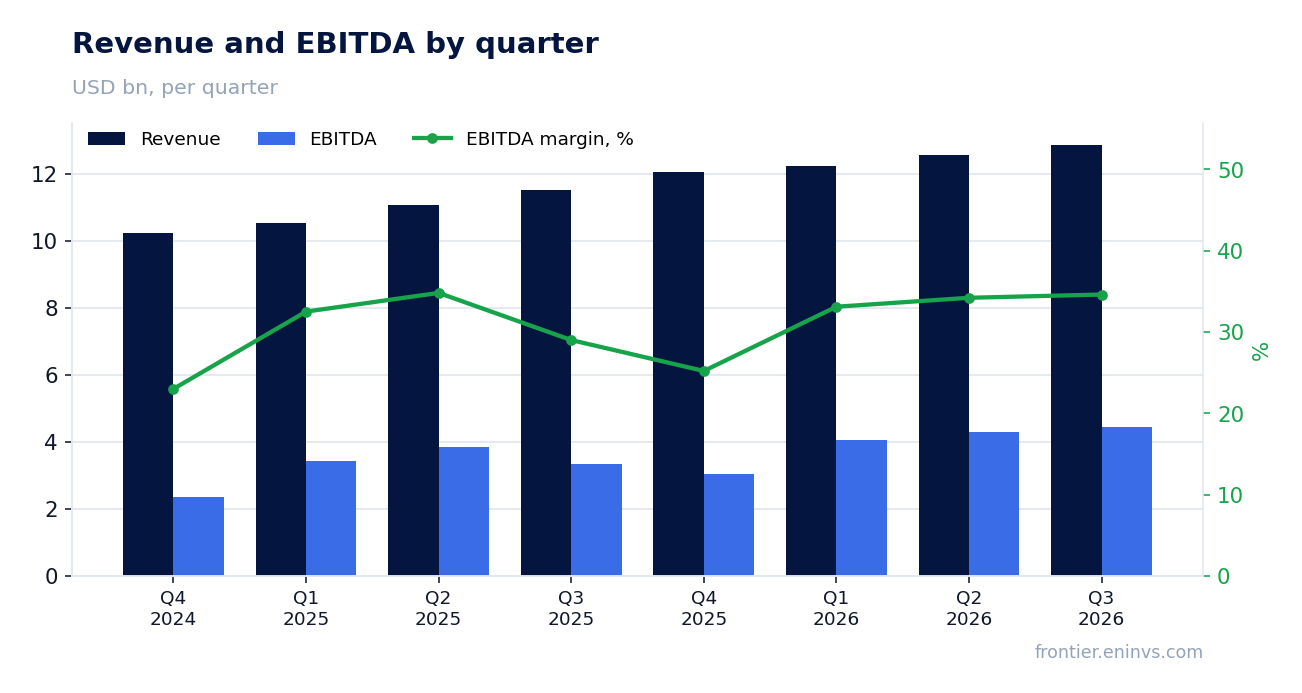
The 34.6% operating margin rose from 28.2% mainly on expense timing, not a durable cost reduction
Operating profit for the quarter was $4,459.0 million, a 34.6% margin versus 28.2% a year earlier. The company says explicitly that the beat on operating income and margin came primarily from expense timing and slight revenue upside. That means part of the improvement is deferred spending, not permanent savings.
Cost of revenues fell to $6,079.0 million from $6,164.3 million a year earlier while revenue rose by $1,363.7 million. Sales and marketing rose to $837.1 million from $786.3 million, technology and development to $1,033.1 million from $853.6 million, and G&A to $466.4 million from $457.9 million. Cost of revenues drove the margin, not restraint elsewhere.
For the fourth quarter the company guides to a 26.0% margin – well below the quarterly level, including about 120 basis points of negative impact from headcount reductions. Full-year margin is expected at 31.5% versus 29.5% in 2025. The 34.6% quarterly figure should not be extrapolated to the year.
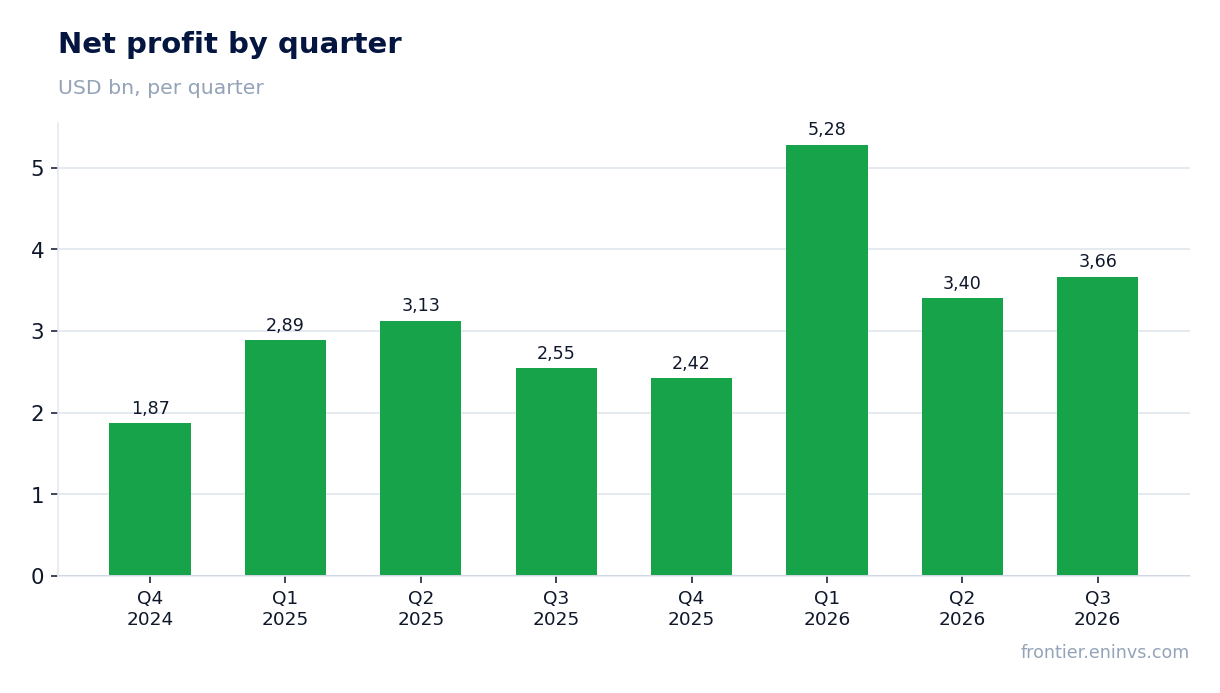
Net profit +43.9% against revenue +11.8% – the gap came from a low prior-year base, not operating leverage
Net profit for the quarter was $3,664.0 million versus $2,546.9 million a year earlier, up 43.9%. The net margin rose to 28.5% from 22.1%. The gap with 11.8% revenue growth is explained primarily by the low base: profit was depressed a year earlier, and this time other income added to the operating improvement.
The income statement shows interest expense rising to $184.7 million from $175.3 million, while interest and other income contributed $43.0 million versus $36.5 million. Income tax was $653.0 million versus $562.5 million. The main lever is operating profit, not one-off items below the operating line.
However, nine-month profit includes a large one-off component: interest and other income for the nine months was $2,946.8 million versus $127.0 million a year earlier. There is no such spike in the quarter, but the annual profit base is distorted. For durability, operating profit – up 37% – is the better gauge.
Free cash flow of $2,884.0 million rose from $2,660.5 million, and the company bought back $4.8 billion of stock – a quarterly record
Operating cash flow for the quarter was $3,162.0 million versus $2,825.2 million a year earlier. Capex was $278.8 million, and free cash flow $2,884.0 million versus $2,660.5 million. Cash flow grew more modestly than profit because content spend rose to $5,159.8 million from $4,653.9 million.
The company repurchased 63.9 million shares for $4.8 billion – its largest buyback quarter ever. Remaining authorisation is $22.3 billion. Buybacks supported diluted EPS: the share count fell to 4,195 million from 4,340 million a year earlier. This is the main capital-return channel in the absence of dividends.
The 2026 free cash flow forecast was cut to about $12.0 billion from $12.5 billion due to the expected closing of a real estate transaction in the fourth quarter. The cash content spend to amortisation ratio remains about 1.1x. Cash flow remains sufficient for buybacks and debt service.
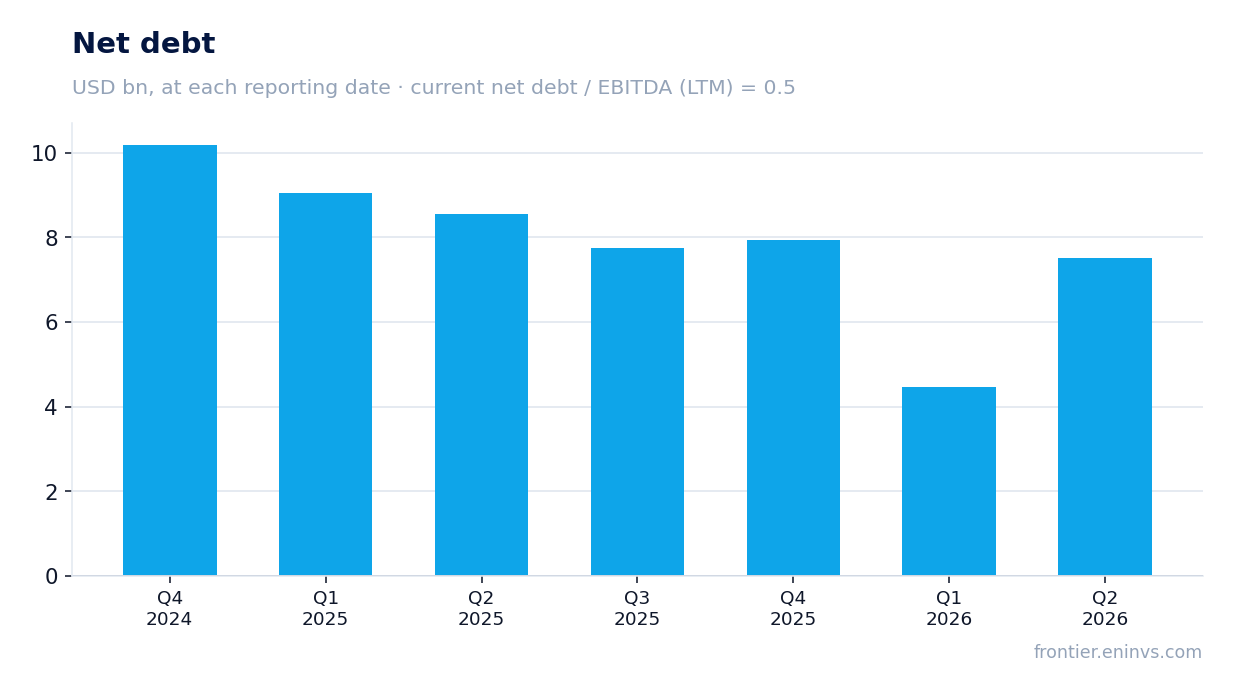
Leverage is moderate: net debt of $7,113.9 million, net debt/EBITDA LTM of 0.5
At the end of the third quarter net debt was $7,113.9 million, and net debt to trailing-twelve-month EBITDA was 0.5. That is a low level for a company with this cash flow. The report shows gross debt of $15.3 billion and cash of $8.2 billion.
Gross debt rose by about $1 billion from the end of the second quarter: the company issued $1 billion of bonds to fund a $1 billion debt maturity in the fourth quarter. Short-term debt on the balance sheet is $2,474.8 million and long-term debt $12,657.6 million. Quarterly interest expense was $184.7 million.
Trailing-twelve-month EBITDA was $15,872.6 million and revenue $49,700.0 million. With that cushion, debt constrains neither buybacks nor content investment. The direction of the ratio is not disclosed, so it can be cited only as a level.
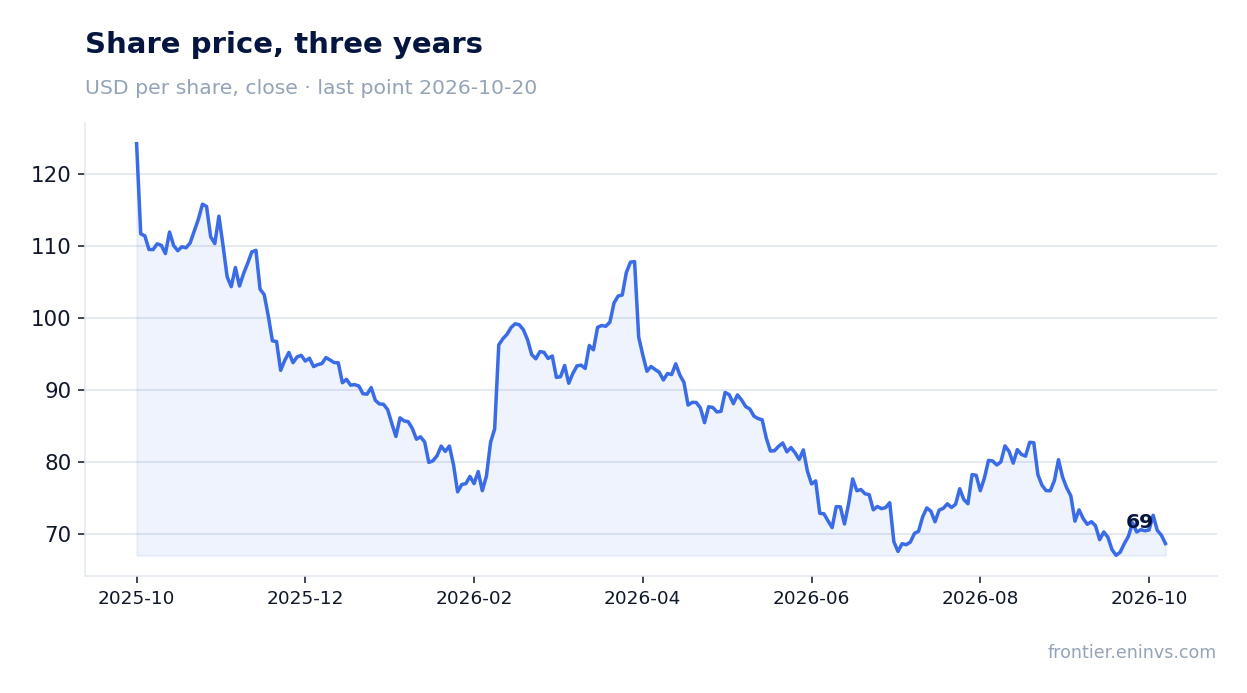
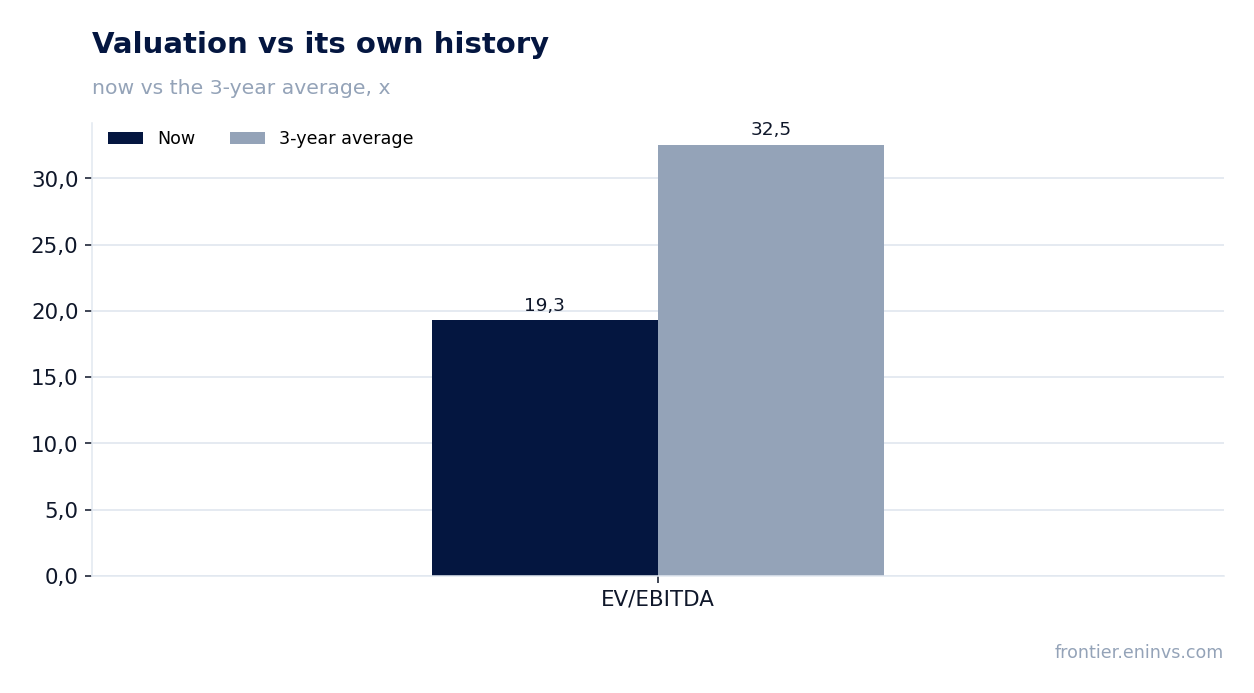
EV/EBITDA of 19.3 is 41% below its own three-year average of 32.5 – the share is cheaper than its history
Trailing-twelve-month EV/EBITDA is 19.3 against its own three-year average of 32.5. The share trades 41% below its historical valuation on this multiple. Trailing-twelve-month P/E is 20.2 and market capitalisation is $298,380.0 million.
The lower multiple reflects slowing revenue growth and market caution on advertising: the 2026 ad revenue forecast was cut to about $2.7 billion from $3.0 billion. Yet profit and cash flow are growing, and buybacks are shrinking the share count. On the portal's model the upside to fair value is +21%.
The market reaction to the report was muted: the share lost 1.7% on the publication day and the same from the report to 20 October. The price before publication was $69.85. A valuation below history and rising profit create room, but realising it requires visible reacceleration in revenue.
The 2026 forecast was cut on advertising to $2.7 billion from $3.0 billion, but the 31.5% margin and 13% revenue growth are maintained
The company maintained its 2026 revenue forecast at $51.1 billion, up 13% year over year. That is 0.2% below the midpoint of the prior range: subscription revenue growth beat expectations, but advertising revenue is now expected at about $2.7 billion versus roughly $3.0 billion previously, due to a slower rollout of some ad products.
The 2026 operating margin is expected at 31.5% versus 29.5% in 2025, including about 30 basis points of negative impact from headcount reductions. The forecast implies operating income growth of more than 20% for the year. For the fourth quarter, revenue is expected at $13,442 million (+11.5%) and margin at 26.0%.
What to watch in the next report: advertising revenue after the guidance cut, subscriber growth in UCAN and EMEA, and margin durability after the 34.6% quarter. The launch of the ad tier in 15 new countries in 2027 is the next catalyst, but it lies beyond the current year.
Valuation on the latest reported figures
| Metric | Value |
|---|---|
| Market cap | 298 bn USD |
| P/E (LTM) | 20.2 |
| EV/EBITDA (LTM) | 19.3 |
| P/B | 11.21 |
| Net debt / EBITDA (LTM) | 0.50 |
| Operating cash flow (LTM) | 12.3 bn |
| ROE | 16.4% |
| EV/EBITDA, 3-year average | 32.5 |
Bottom line
What was strong in the report was everything cash-related: free cash flow of $2,884.0 million, a record $4.8 billion buyback, and low leverage at 0.5 times EBITDA. What was weak was the revenue trajectory: growth slowed to 11.8%, and the advertising forecast was cut. Part of the 34.6% quarterly margin is one-off, and the 31.5% full-year target confirms it. The key question for a holder is whether the company can reaccelerate revenue while the multiple of 19.3 stays below its own history of 32.5. With that discount and the +21% upside on the portal's model, the share looks attractive, but the verdict rests on belief in a recovery in the growth rate.
Open the company's financial profile NFLX →
See also: market overview · valuation map · stock screeners