Northern Oil and Gas: WTI rose 31.7%, yet EBITDA beat the price-implied figure by only $2.0m — costs and realisations ate the rest
On 6 November Northern Oil and Gas, Inc. reported results for the quarter ended 30 September 2026. Average WTI was $85.4 versus $64.9 a year earlier (+31.7%), Henry Hub $2.893 versus $3.083 (-6.2%). Revenue rose 43.6% to $697.7m and EBITDA to $131.1m at an 18.8% margin versus 0.6% a year earlier, but at the year-ago volumes and costs those prices implied EBITDA of $129.1m — a beat of only $2.0m, or 1.6%. With EV/EBITDA at 7.5 against its own three-year average of 5.1 and a net loss, the share looks neutral: an 8.1% dividend yield and $1,083.1m of EBITDA at current prices in the portal spot model offset weak conversion of price into profit.
Key takeaways
— WTI rose 31.7% year on year but fell 7.9% quarter on quarter — the price backdrop was mixed
— At the year-ago volumes and costs those prices implied EBITDA of $129.1m against $131.1m reported — a beat of just 1.6%
— Against the previous quarter the gap reverses: prices implied $284.2m of EBITDA, reported came in $153.1m lower
— Revenue rose 43.6% year on year, and the acceleration from 16.8% in Q2 came from price, not volume
— Operating profit went to a $76.9m loss, and the $131.1m of EBITDA rests on $207.9m of depreciation
— Net debt of $2.6bn is 4.2x LTM EBITDA, alongside an 8.1% dividend yield
— EV/EBITDA of 7.5 against a three-year average of 5.1 puts the share 48% above its own history
Attractiveness
Key figures, USD bn
| Metric | Q3 2025 | Q3 2026 | Change |
|---|---|---|---|
| Revenue | 0.49 | 0.70 | +43.6% |
| EBITDA | 0.00 | 0.13 | +4546.3% |
| Operating profit | -0.20 | -0.08 | — |
| Net profit | -0.13 | -0.11 | — |
| Operating cash flow | 0.42 | — | — |
| Capex | 0.35 | — | — |
| EBITDA margin | 0.6% | 18.8% | +18.2 pp |
| Net margin | -26.6% | -16.0% | +10.6 pp |
WTI rose 31.7% year on year but fell 7.9% quarter on quarter — the price backdrop was mixed
Average WTI in the quarter ended 30 September 2026 was $85.4 versus $64.9 a year earlier, or +31.7%. This is the main external driver of the report: oil accounts for 85% of revenue in the portal model.
US Henry Hub gas averaged $2.893 versus $3.083 a year earlier (-6.2%) and accounts for 15% of revenue. The gas leg did not share in the oil price gain.
Quarter on quarter oil fell 7.9% ($92.8 in Q2) and gas 1.1%. So revenue rose year on year, while sequentially prices worked against the result.
As of 6 November spot WTI is $91.3, 6.9% above the reported-period average, and Henry Hub $2.95 (+2.0%). The current price backdrop for the next report is slightly better than the reported one.
Commodity prices: period average and now
| Benchmark | Year ago | Q3 2026 | YoY | Spot 2026-11-06 |
|---|---|---|---|---|
| WTI, USD | 64,9 | 85,4 | +31,7% | 91,3 |
| Henry Hub, USD | 3,08 | 2,89 | -6,2% | 2,95 |
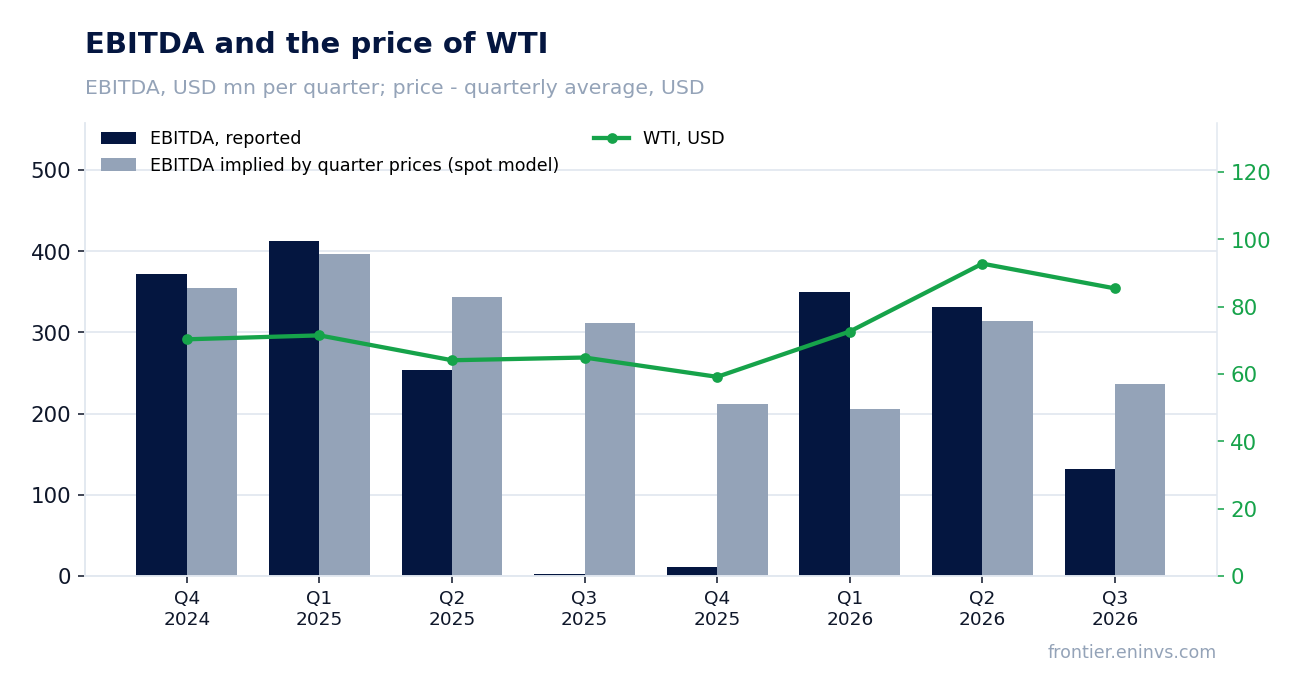
At the year-ago volumes and costs those prices implied EBITDA of $129.1m against $131.1m reported — a beat of just 1.6%
Holding Q3 2025 volumes and costs and moving only prices to the reported period gives revenue of $612.1m and EBITDA of $129.1m. This is our calculation, not company data.
Actual revenue was $697.7m, $85.6m (14.0%) above the implied figure; actual EBITDA was $131.1m, just $2.0m (1.6%) above. Price explains most of the revenue but almost none of the EBITDA.
The gap between revenue and EBITDA means higher volumes or realisations came with higher costs: with the price 31.7% higher year on year, EBITDA rose 4,546.3% from a near-zero base of $2.8m a year earlier, i.e. by $128.3m in absolute terms.
The portal spot model, re-priced from the average of the previous four quarters, expected EBITDA of $236.2m and revenue of $612.0m. Reported EBITDA is 44.5% below the model and revenue 14.0% above it. That estimate is sensitive to one-off quarters in the base and disagrees in direction with the year-ago calculation; we treat the latter as the anchor.
What the prices implied and what the company earned
| Base (Q3 2025) | Implied at period prices | Reported | Reported vs implied | |
|---|---|---|---|---|
| Revenue, USD mn | 485,9 | 612,1 | 697,7 | +14,0% |
| EBITDA, USD mn | 2,80 | 129,1 | 131,1 | +1,6% |
| EBITDA, portal spot model, USD mn | — | 236,2 | 131,1 | -44,5% |
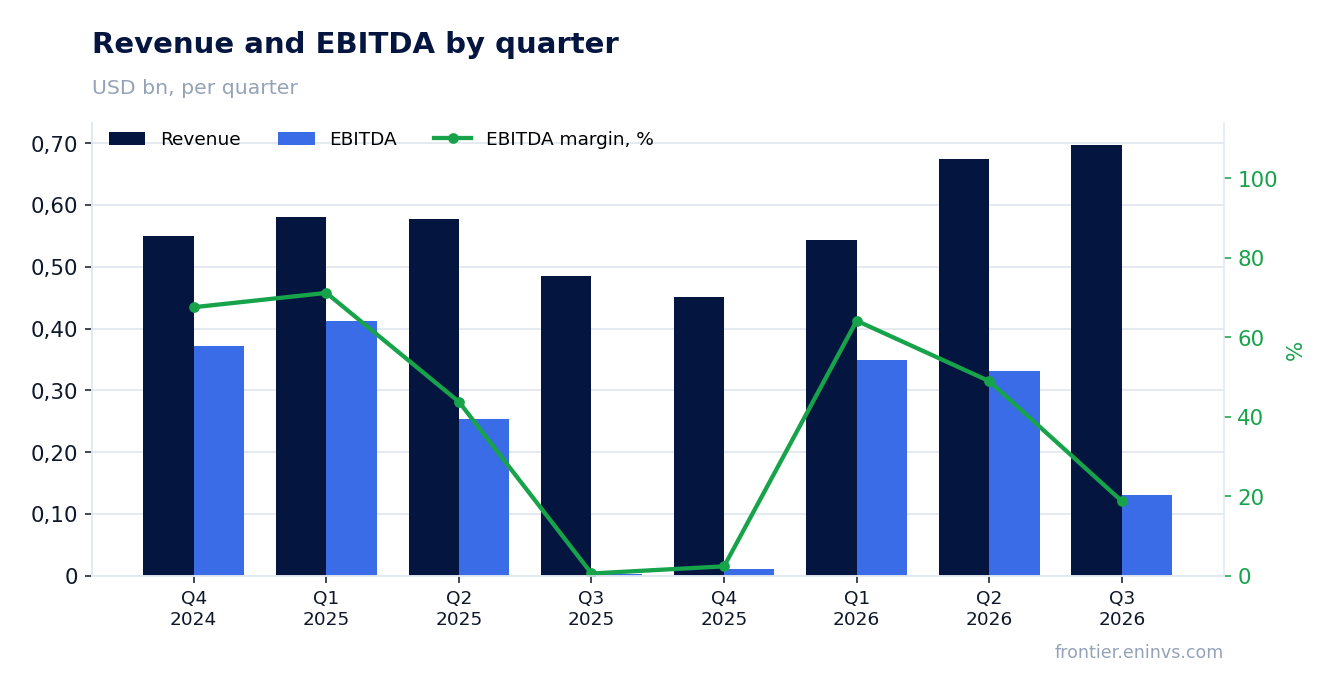
Against the previous quarter the gap reverses: prices implied $284.2m of EBITDA, reported came in $153.1m lower
At Q2 2026 volumes and costs and reported-period prices, revenue would have been $628.4m (price effect -$46.7m, -6.9%) and EBITDA $284.2m. This is our calculation.
Actual revenue was $697.7m, $69.3m (11.0%) above the implied figure; actual EBITDA was $131.1m, $153.1m (53.9%) below. The sequential picture shows the quarter was not carried by price: oil fell 7.9% quarter on quarter.
In Q2 2026 EBITDA was $330.9m on revenue of $675.1m; in Q3 it was $131.1m on revenue of $697.7m. Revenue rose $22.6m while EBITDA fell $199.8m: the revenue gain did not reach EBITDA.
The facts and the source do not name the cause of that divergence, so we state only what moved: revenue up, EBITDA down, and not a price effect, since the price fell quarter on quarter.
Revenue rose 43.6% year on year, and the acceleration from 16.8% in Q2 came from price, not volume
Reported-quarter revenue was $697.7m versus $485.9m a year earlier, +43.6%. In Q2 2026 growth was 16.8%, so this is an acceleration.
The price effect in our calculation adds $126.2m, or 26.0%, to year-ago revenue at unchanged volumes and costs. The remaining $85.6m of the beat versus the implied figure comes from volumes, realisations against the benchmark and other factors the source does not break out.
The year-on-year acceleration rests on a low Q3 2025 base ($485.9m) and on WTI at $85.4 versus $64.9. The sequential picture is more modest: revenue rose 3.4% from $675.1m in Q2.
Operating profit went to a $76.9m loss, and the $131.1m of EBITDA rests on $207.9m of depreciation
Reported-quarter operating profit was a loss of $76.9m. EBITDA of $131.1m is operating profit plus $207.9m of depreciation, depletion and amortisation: without that line the operating result is negative.
The EBITDA margin was 18.8% versus 0.6% a year earlier. The margin gain is explained by the low year-ago base, when EBITDA was $2.8m on revenue of $485.9m.
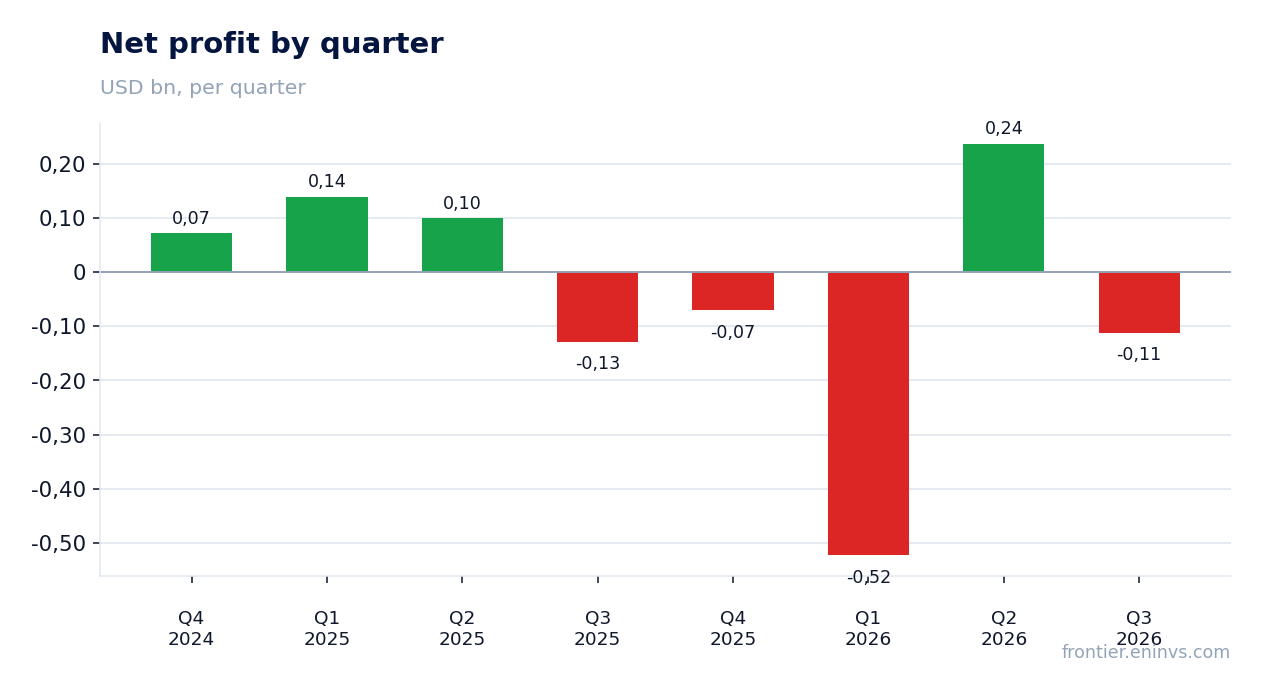
The net loss was $111.8m, a -16.0% margin versus -26.6% a year earlier. The loss exceeds the operating loss, so items below the operating line sit outside EBITDA and explain only the net result; the source does not detail them in the data provided.
For a holder this means positive EBITDA is not yet turning into profit: depletion-driven depreciation is large and operating costs absorb the price gain.
Net debt of $2.6bn is 4.2x LTM EBITDA, alongside an 8.1% dividend yield
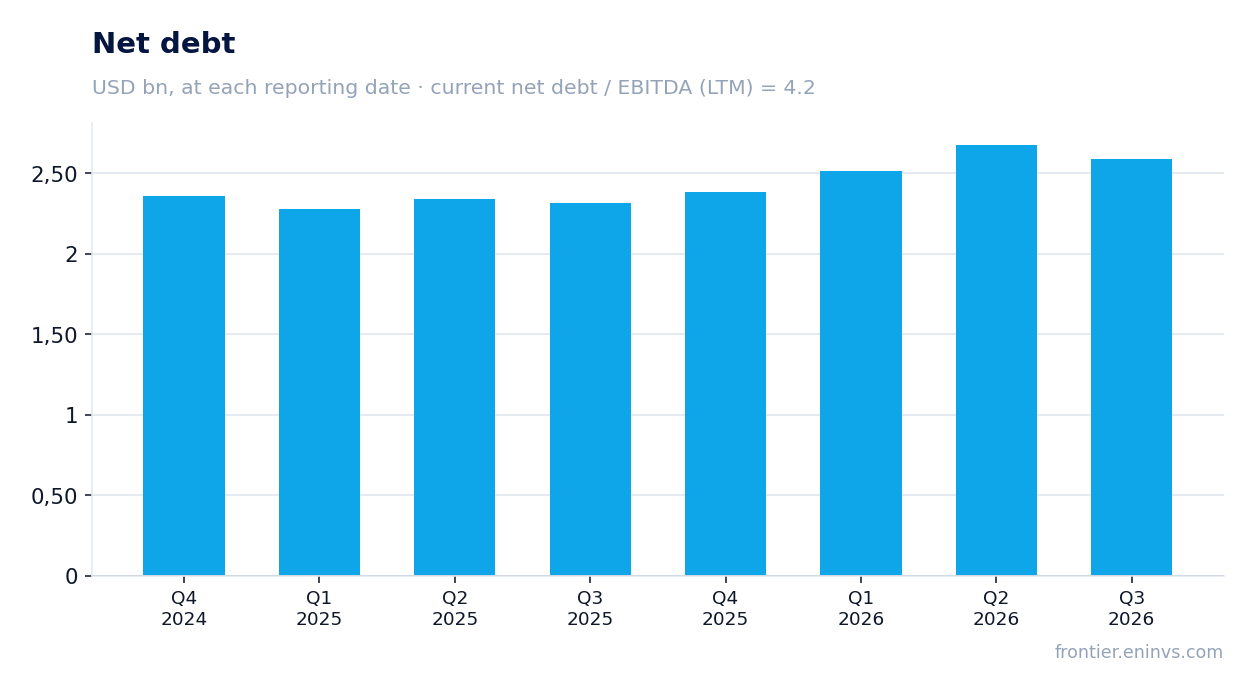
Net debt at 30 September 2026 was $2,589.8m, or $2.6bn. At 30 June it was $2.7bn (down $0.1bn), and a year earlier, at 30 September 2025, $2.3bn (up $0.3bn over 12 months).
Net debt to LTM EBITDA is 4.2. That is a level, not a direction: the earlier value is not in the facts.
The trailing 12-month dividend yield is 8.1% on a market capitalisation of $2,365.4m. Payouts over the year are comparable to $192m, which with a net loss rests on cash flow rather than profit.
Operating cash flow and capex for the reported quarter are not in the facts, so dividend cover and reinvestment cannot be judged from this quarter. Reserve life is 10.5 years at the current production rate.
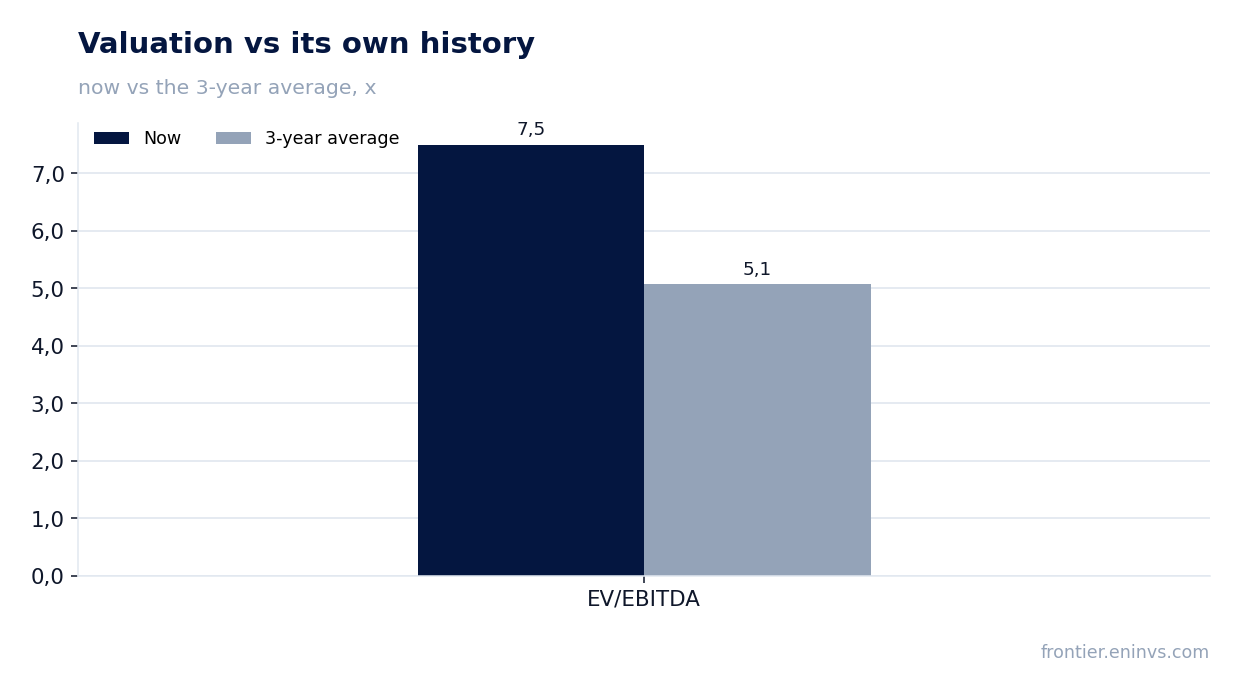
EV/EBITDA of 7.5 against a three-year average of 5.1 puts the share 48% above its own history
LTM EV/EBITDA is 7.5 against its own three-year average of 5.1, or 48% above. On this multiple the share is more expensive than its three-year norm.
The caveat for a commodity producer: LTM EBITDA of $616.9m was earned at past prices. In the portal spot model, annual EBITDA at current prices is $1,083.1m against model LTM EBITDA of $822.4m (+31.7%), EV/EBITDA at current prices is 4.6 and net debt to EBITDA 2.39.
At current prices the multiple is below the three-year average; on historical earnings it is above. The spot model matters more for valuation: it shows the market paying 4.6x EBITDA with WTI around $91.
Return on equity is negative (-23.4%) because of the loss. The key variable for the verdict is the WTI price: held near $90, EBITDA at current prices is nearly double LTM; back at $65, the advantage disappears.
Valuation on the latest reported figures
| Metric | Value |
|---|---|
| Market cap | 2.37 bn USD |
| EV/EBITDA (LTM) | 7.5 |
| P/B | 1.11 |
| Net debt / EBITDA (LTM) | 4.20 |
| ROE | -23.4% |
| Dividend yield (12m) | 8.1% |
| EV/EBITDA, 3-year average | 5.1 |
Bottom line
The quarter's strength was price: WTI at $85.4 versus $64.9 a year earlier gave revenue +43.6% and an acceleration from 16.8% in Q2. But at the year-ago volumes and costs those prices implied EBITDA of $129.1m against $131.1m reported: the price gain barely reached EBITDA, and operating profit stayed at a $76.9m loss. The 8.1% dividend yield and $1,083.1m of EBITDA at current prices in the spot model are the main supports; against them stand EV/EBITDA of 7.5 versus a three-year average of 5.1 and debt at 4.2x EBITDA. The verdict is neutral: a holder should watch the WTI price and whether the price gain converts into EBITDA in the next report.
Open the company's financial profile NOG →
See also: market overview · valuation map · stock screeners