NOVA LTD.: revenue grew 15.9%, but cash flow lags and the valuation sits above its own history
NOVA LTD. reported results for the second quarter of 2026. Revenue grew 15.9% year-on-year to $255.0 million, EBITDA added 15.6% to $82.2 million, and net profit increased 9.8% to $75.0 million. The EBITDA margin held at 32.2%, while the net margin declined to 29.4% from 31.0%. Operating cash flow for the quarter was only $40.9 million, and debt rose to $608.7 million. In our view, the share looks neutral: revenue growth has slowed, the valuation is above its three-year average, and cash flow is not keeping pace with profit.
Key takeaways
— Revenue grew 15.9% year-on-year, but this is slower than in previous quarters
— EBITDA margin held at 32.2%, but net margin declined to 29.4%
— Operating cash flow for the quarter was only $40.9 million, well below net profit
— Debt rose to $608.7 million, while net debt to LTM EBITDA stands at -0.53
— EV/EBITDA LTM of 42.3x is above the three-year average of 32.1x
— On the portal's model, the upside to fair value is 0%
Attractiveness
Key figures, USD bn
| Metric | Q2 2025 | Q2 2026 | Change |
|---|---|---|---|
| Revenue | 0.22 | 0.25 | +15.9% |
| EBITDA | 0.07 | 0.08 | +15.6% |
| Operating profit | 0.07 | 0.08 | +16.1% |
| Net profit | 0.07 | 0.08 | +9.8% |
| Operating cash flow | 0.05 | 0.04 | -10.4% |
| Capex | 0.00 | 0.00 | -8.9% |
| EBITDA margin | 32.3% | 32.2% | -0.1 pp |
| Net margin | 31.0% | 29.4% | -1.6 pp |
Revenue grew 15.9% year-on-year, but this is slower than in previous quarters
In the second quarter of 2026, NOVA LTD.'s revenue reached $255.0 million, up 15.9% year-on-year. For comparison: in the first quarter of 2026 growth was 10.3%, and in the second quarter of 2025 it was 40.2%. The slowdown began in the third quarter of 2025, when growth was 25.5%, and continued in the fourth quarter of 2025 at 14.3%.
Sequential revenue growth from quarter to quarter persists: $235.3 million in Q1 2026 and $255.0 million in Q2. However, the annual pace has slowed, which may indicate demand saturation or a high comparison base from last year.
The company does not disclose in the provided data which segment or product drove growth. Therefore, we can only state the fact of a slowdown in annual growth while maintaining positive quarterly dynamics.
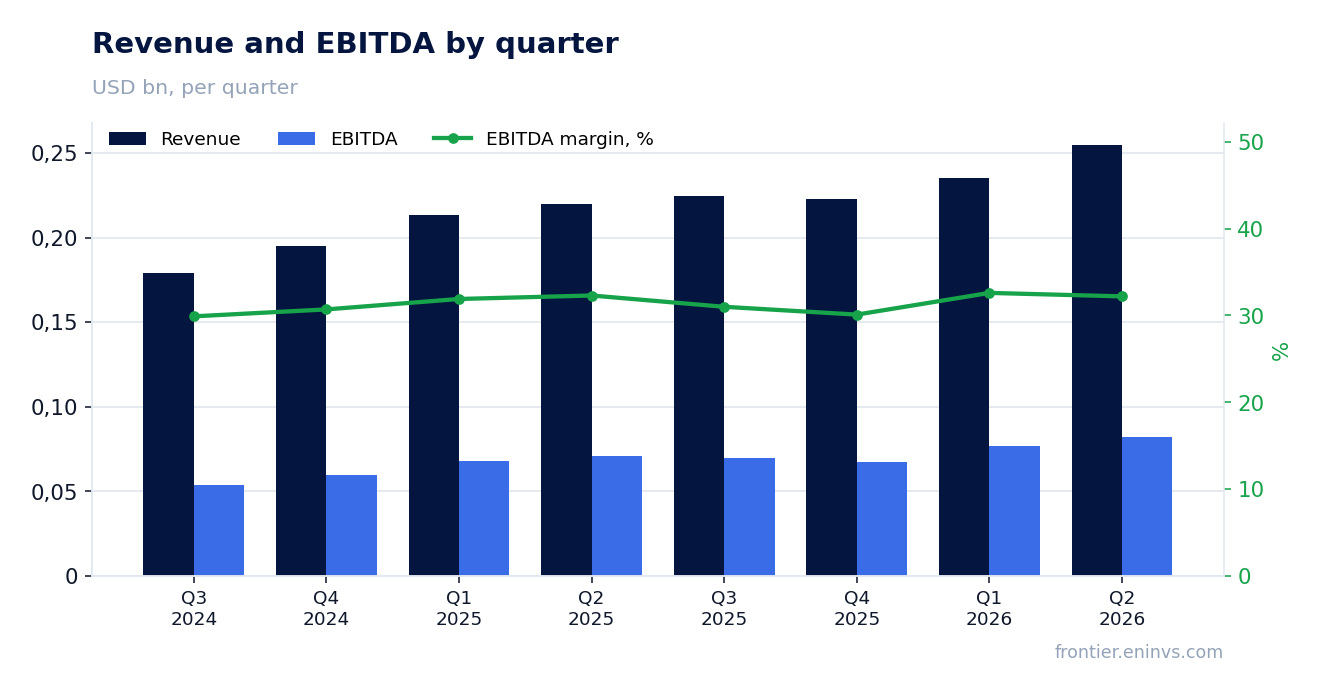
EBITDA margin held at 32.2%, but net margin declined to 29.4%
In the second quarter of 2026, EBITDA was $82.2 million, up 15.6% year-on-year. The EBITDA margin remained virtually unchanged at 32.2% versus 32.3% a year earlier. This indicates stability in operating efficiency at the EBITDA level.
However, net profit grew only 9.8% to $75.0 million, and the net margin declined to 29.4% from 31.0%. The difference between EBITDA and net profit dynamics points to higher expenses below operating profit – possibly increased interest on debt or taxes.
Operating profit in Q2 2026 was $76.2 million, up 16.1% from $65.6 million a year earlier. Thus, the pressure on net profit came not from operating expenses but from other items.
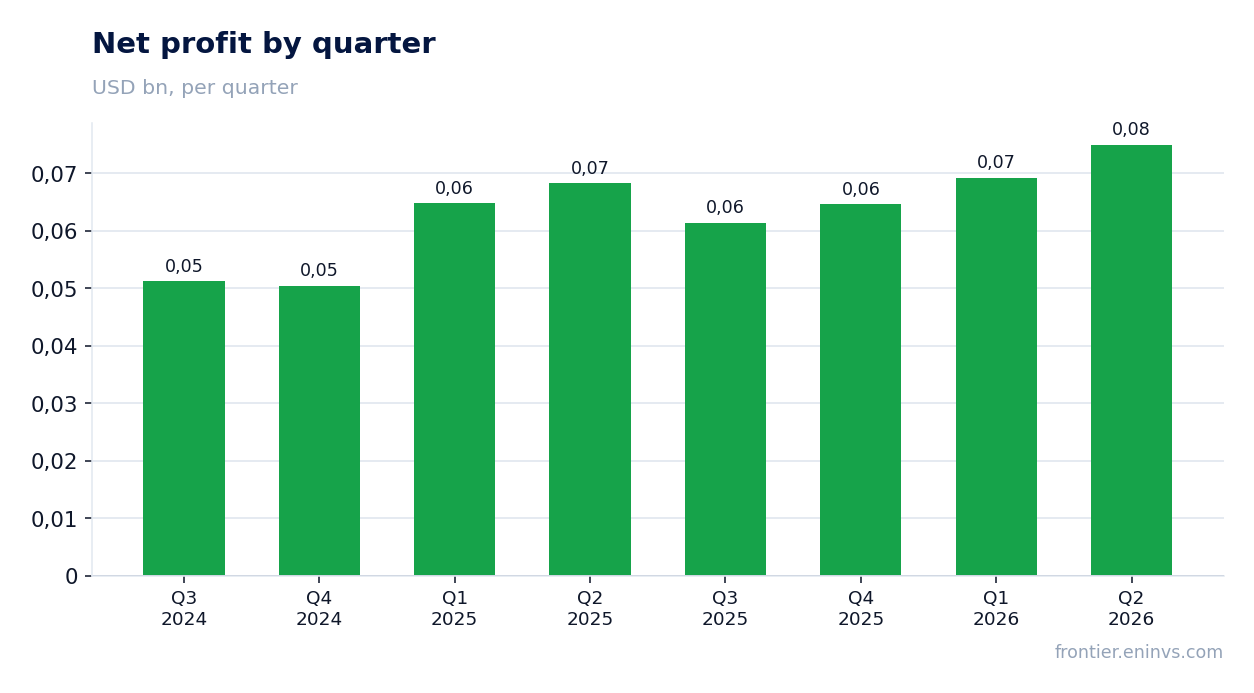
Operating cash flow for the quarter was only $40.9 million, well below net profit
In the second quarter of 2026, operating cash flow was $40.9 million, while net profit was $75.0 million. This discrepancy means that a significant portion of profit is not converting into cash – likely due to growth in receivables or inventories.
Over the trailing twelve months, operating cash flow was $245.6 million against net profit of $270.4 million. The gap persists on an annual basis, though it is less pronounced.
Capital expenditures in Q2 were small at $2.5 million, so the main cash outflow is related to operating activities rather than investments. This may signal deteriorating earnings quality or a seasonal factor.
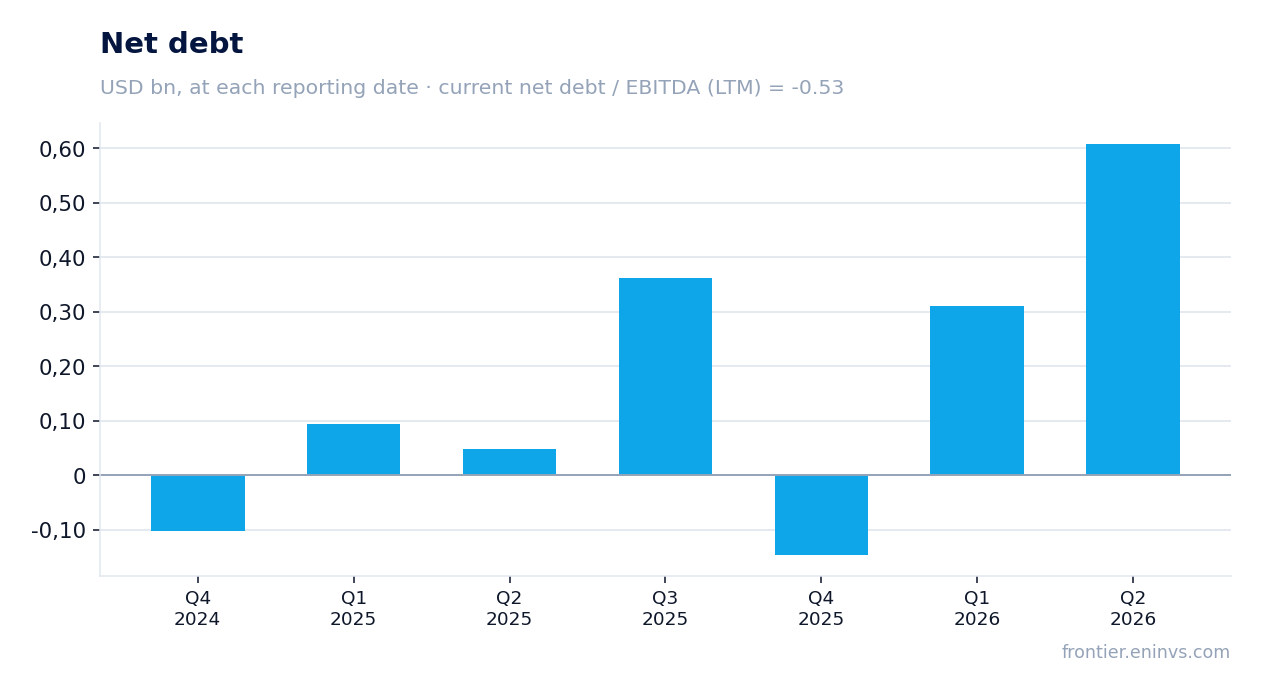
Debt rose to $608.7 million, while net debt to LTM EBITDA stands at -0.53
NOVA LTD.'s net debt at the end of Q2 2026 was $608.7 million, up 0.3 billion rubles from the previous reporting date and 0.6 billion rubles over the last 12 months. The increase in debt is partly explained by expanded operations.
The net debt to LTM EBITDA ratio is -0.53. This means the company has negative net debt, i.e., cash exceeds debt obligations. However, we cannot judge the direction of change in this ratio, as the previous value is not in the facts.
Interest expenses are not disclosed, but the decline in net margin with stable operating margin may indicate rising debt servicing costs. This warrants attention in future reports.
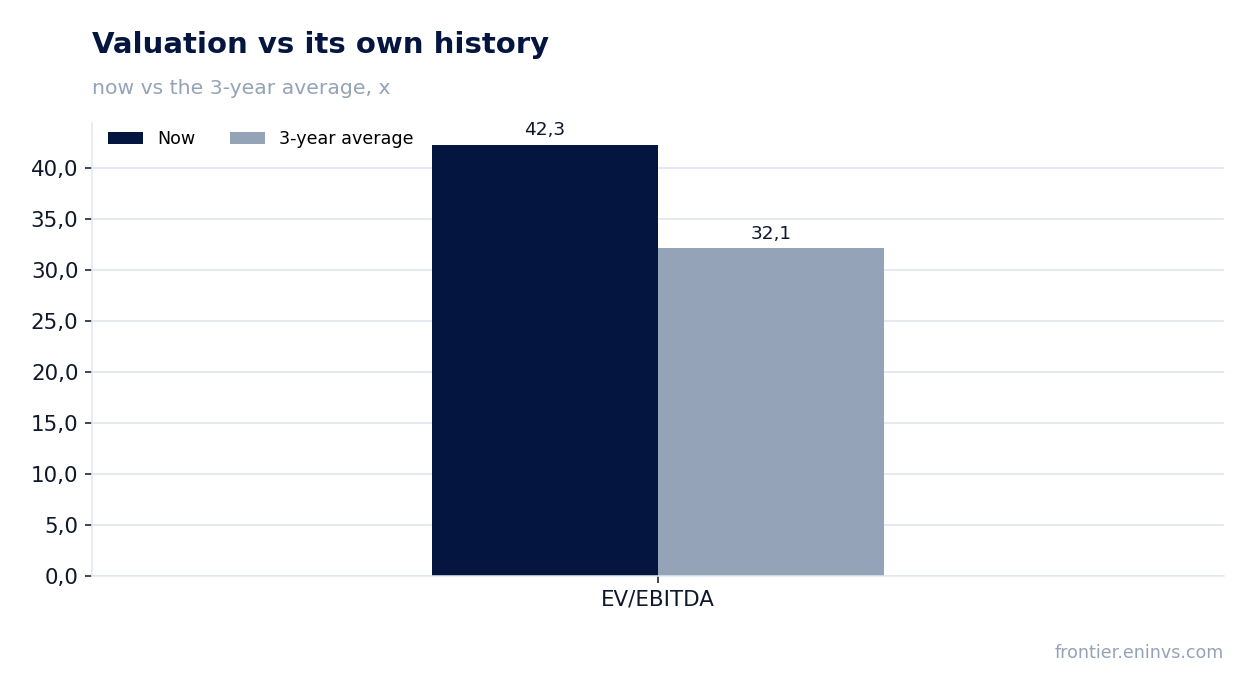
EV/EBITDA LTM of 42.3x is above the three-year average of 32.1x
The current EV/EBITDA for the trailing twelve months is 42.3x, significantly above the three-year average of 32.1x. This indicates that the stock is trading at a premium to its historical valuation.
The P/E LTM is 43.9. Market capitalization is $11.9 billion. EV/EBITDA is above average, which could only be justified by accelerating growth or margin improvement, neither of which is observed in the reported quarter.
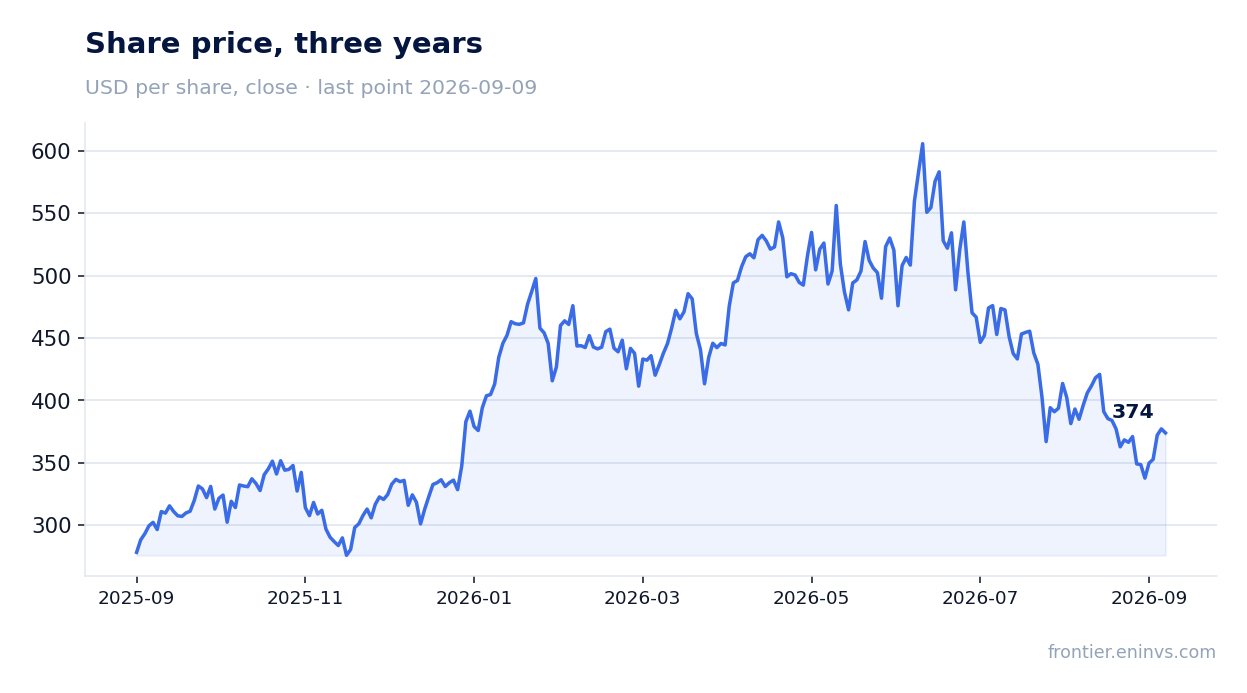
On the portal's model, the upside to fair value is 0%. This means the current price already reflects the expectations embedded in the model and does not imply additional growth.
On the portal's model, the upside to fair value is 0%
Our fundamental model, based on EBITDA growth and a target multiple, shows that the fair value of the share corresponds to the current market price. The upside is 0%.
This means the market has already priced in EBITDA growth expectations that align with our forecasts. Further upside would require either accelerating revenue and profit growth or reducing risks.
The model is not a target price and does not reflect market consensus. It is our own tool, indicating that at current fundamentals, the share is fairly valued.
Valuation on the latest reported figures
| Metric | Value |
|---|---|
| Market cap | 11.9 bn USD |
| P/E (LTM) | 43.9 |
| EV/EBITDA (LTM) | 42.3 |
| P/B | 9.01 |
| Net debt / EBITDA (LTM) | -0.53 |
| Operating cash flow (LTM) | 0.25 bn |
| ROE | 21.0% |
| EV/EBITDA, 3-year average | 32.1 |
Bottom line
NOVA LTD. delivered 15.9% revenue growth and stable EBITDA margin, but net profit grew slower and cash flow was well below profit. Debt increased, although the net debt to EBITDA ratio remains negative. EV/EBITDA is above the three-year average, and the portal's model implies no upside. The share looks neutral: strong operating results are balanced by weak cash flow and a high valuation.
Open the company's financial profile NVMI →
See also: market overview · valuation map · stock screeners