Ovintiv Inc.: profit nearly quadrupled, but revenue growth is already slowing
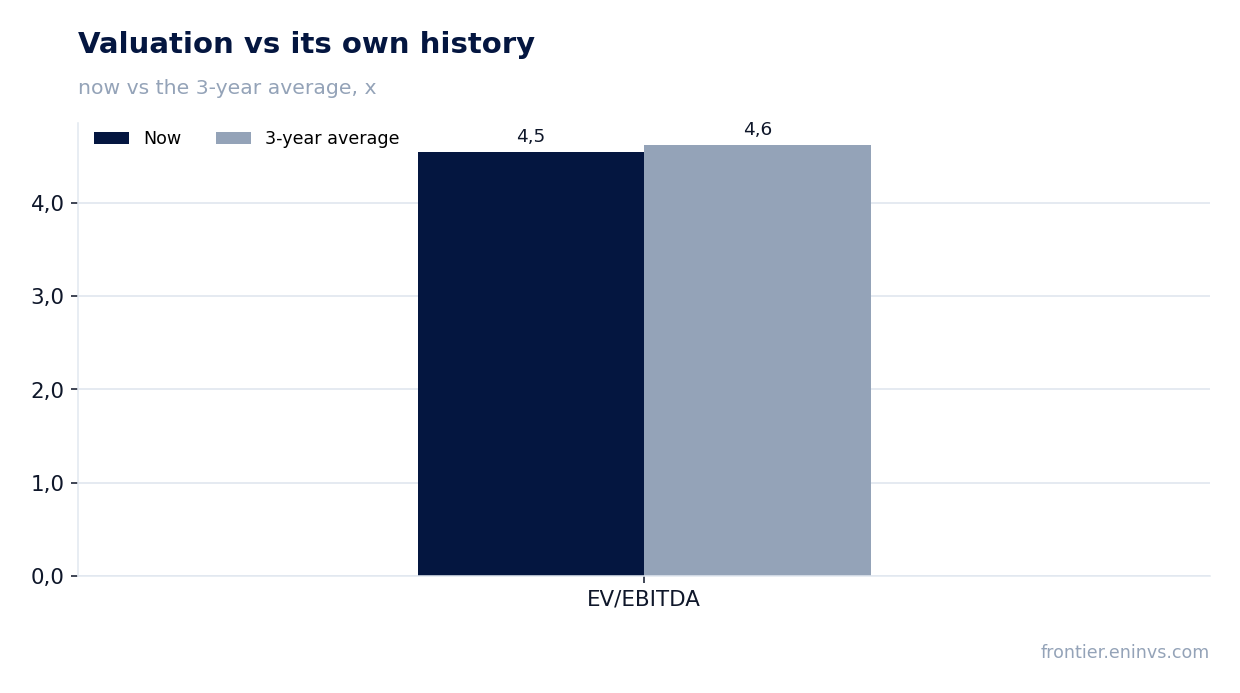
On 3 November Ovintiv Inc. reported results for the third quarter of 2026. Revenue came in at USD 2,558.0 million, up 25.4% year on year, EBITDA reached USD 1,427.0 million (+52.9%), and net profit was USD 549.0 million (+270.9%). The EBITDA margin rose to 55.8% from 45.7% a year earlier, while net debt at the end of the quarter stood at USD 4.9 billion, or 0.92 times trailing twelve-month EBITDA. At the current price the share looks neutral: the EV/EBITDA multiple of 4.5 is in line with its own three-year average, and the portal's model points to 48% downside.
Key takeaways
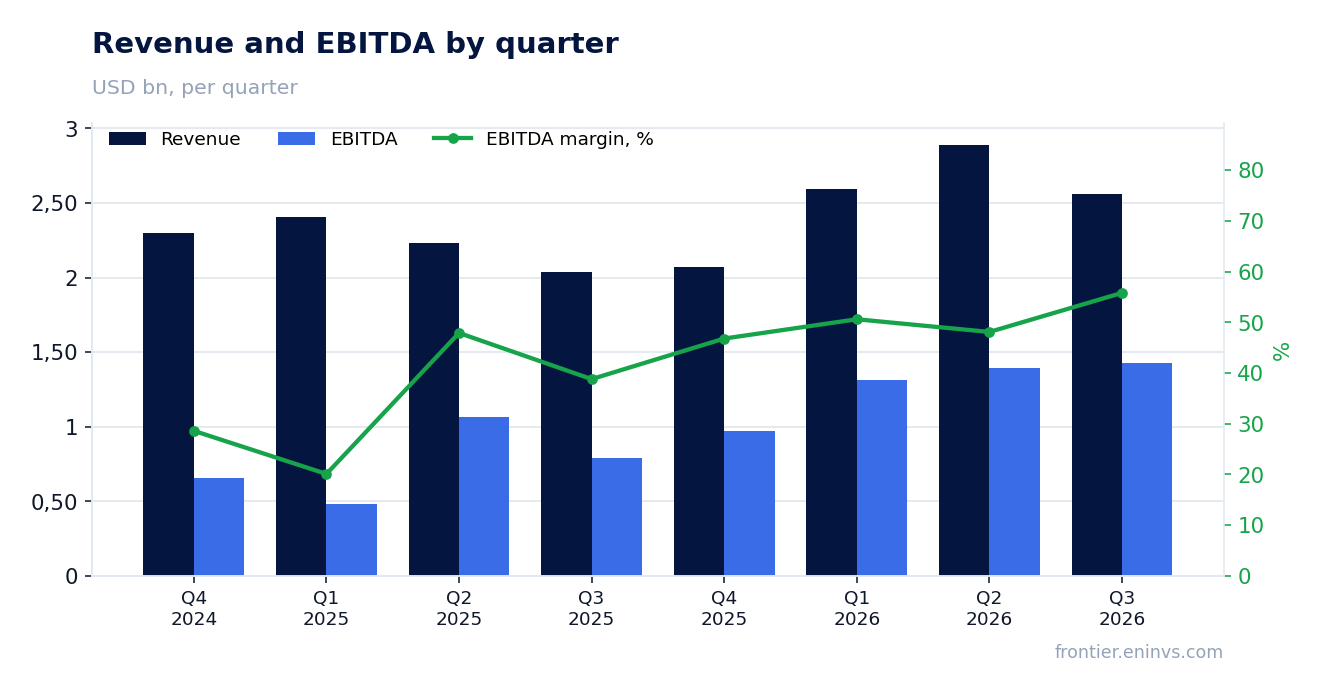
— Revenue rose 25.4% year on year, but growth slowed from 29.7% a quarter earlier
— The EBITDA margin rose to 55.8% from 45.7% a year earlier
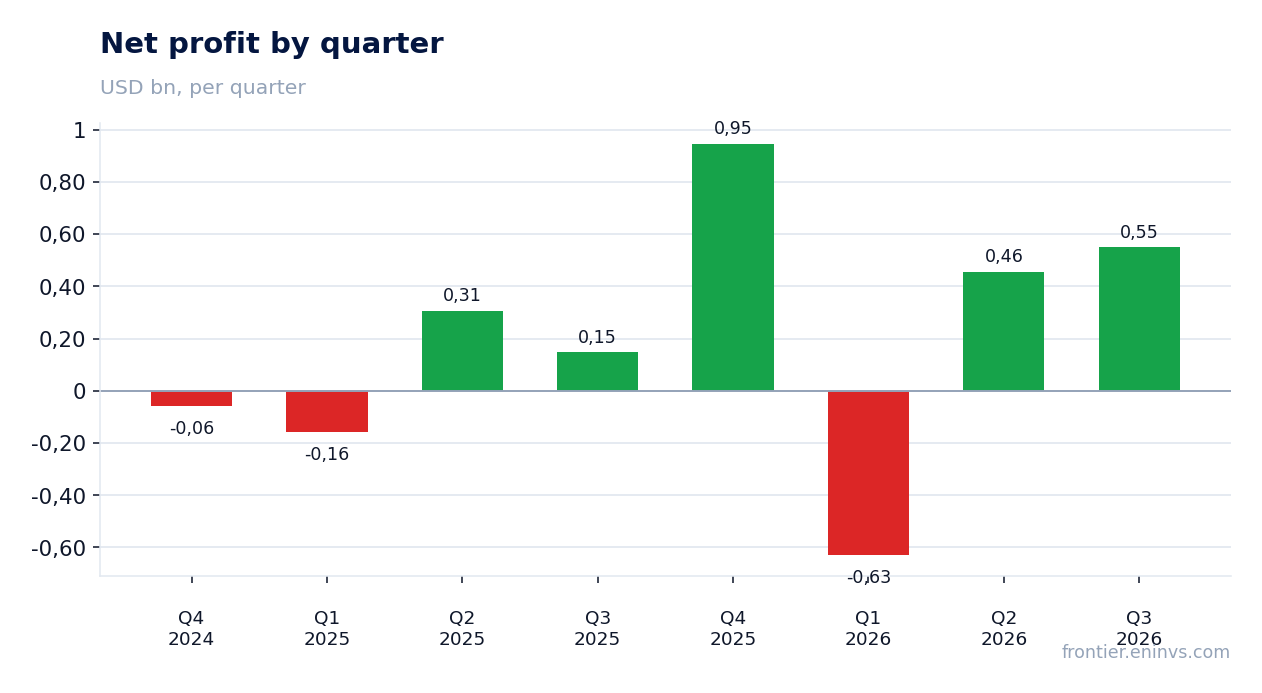
— Net profit grew 3.7 times, to USD 549.0 million
— Free cash flow for the quarter was USD 507.0 million on capex of USD 563.0 million
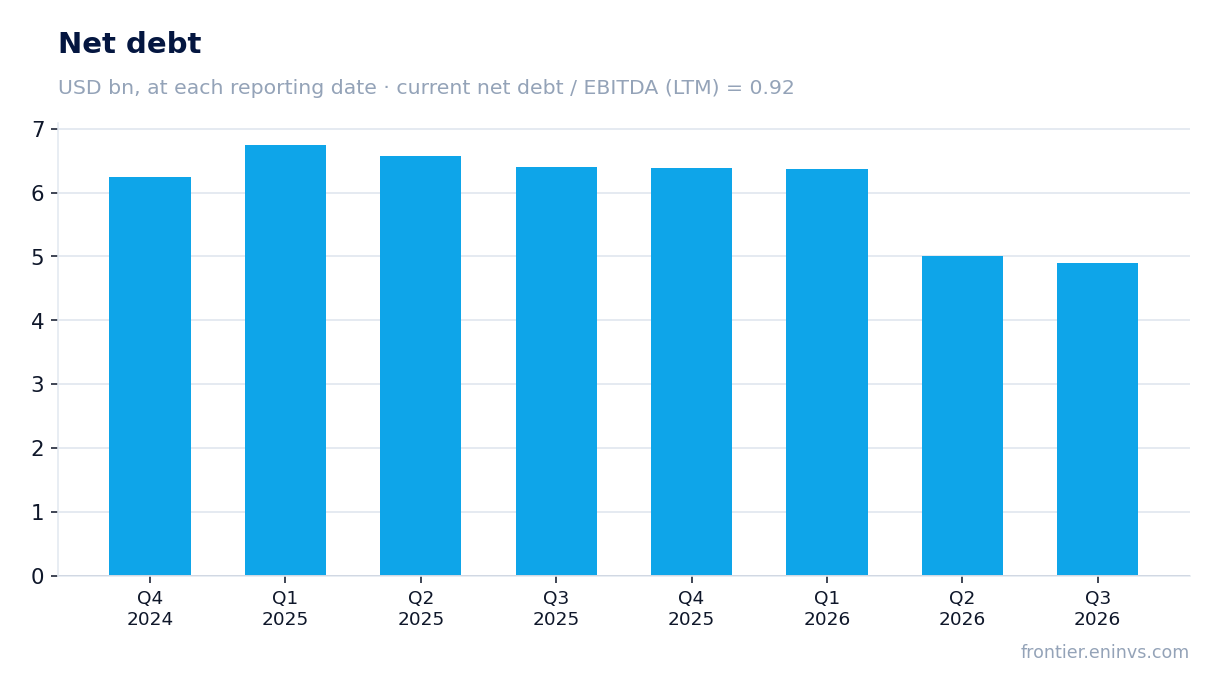
— Net debt fell to USD 4.9 billion from USD 6.4 billion a year earlier
— A dividend yield of 1.8% is modest against the key rate
— EV/EBITDA of 4.5 is in line with its own three-year average of 4.6
Attractiveness
Key figures, USD bn
| Metric | Q3 2025 | Q3 2026 | Change |
|---|---|---|---|
| Revenue | 2.04 | 2.56 | +25.4% |
| EBITDA | 0.93 | 1.43 | +52.9% |
| Operating profit | 0.25 | 0.88 | +255.1% |
| Net profit | 0.15 | 0.55 | +270.9% |
| Operating cash flow | 0.81 | 1.07 | +31.8% |
| Capex | 0.54 | 0.56 | +3.5% |
| EBITDA margin | 45.7% | 55.8% | +10.1 pp |
| Net margin | 7.3% | 21.5% | +14.2 pp |
Revenue rose 25.4% year on year, but growth slowed from 29.7% a quarter earlier
In the third quarter of 2026 Ovintiv Inc.'s revenue was USD 2,558.0 million, 25.4% more than a year earlier. That is a strong result, but it is more modest than the 29.7% growth in the second quarter. The slowdown followed two quarters of acceleration: growth was 7.9% in the first quarter and 29.7% in the second.
The sequential decline from the previous quarter is explained primarily by hydrocarbon price dynamics rather than production volumes. The report does not provide a factor breakdown, so we limit ourselves to stating that quarterly revenue fell from USD 2,891.0 million in the second quarter to USD 2,558.0 million in the third. Year-on-year growth remains double-digit, but its pace is no longer accelerating.
The EBITDA margin rose to 55.8% from 45.7% a year earlier
EBITDA for the third quarter was USD 1,427.0 million, up 52.9% year on year. Against revenue of USD 2,558.0 million that gives a margin of 55.8%, versus 45.7% in the third quarter of 2025. A margin gain of almost 10 percentage points on revenue growth of 25.4% means costs grew more slowly than income.
Operating profit was USD 877.0 million and net profit USD 549.0 million. The net margin rose to 21.5% from 7.3% a year earlier. The gap between operating and net profit is explained in part by tax and financial items, but their detail is not available in the provided data. The main point is that both margins improved rather than diverging.
Net profit grew 3.7 times, to USD 549.0 million
Net profit for the third quarter of 2026 was USD 549.0 million, against USD 148.0 million a year earlier – growth of 270.9%. This is the strongest quarterly result in the last five quarters. For comparison, in the first quarter of 2026 the company posted a loss of USD 630.0 million, and in the second a profit of USD 456.0 million.
Profit over the last twelve months was USD 1,321.0 million. The spread of quarterly results – from a loss of USD 630.0 million to a profit of USD 549.0 million – shows that the bottom line is heavily influenced by one-off and non-operating items. In the third quarter profit grew many times faster than EBITDA, which points to favourable dynamics below the operating line, but the specific items are not disclosed in the provided data.
Free cash flow for the quarter was USD 507.0 million on capex of USD 563.0 million
Operating cash flow for the third quarter was USD 1,070.0 million and capital expenditure USD 563.0 million. The difference of USD 507.0 million is free cash flow, which covers dividends and debt reduction. Over the last twelve months operating cash flow was USD 4,712.0 million.
Capital expenditure of USD 563.0 million is slightly below the second quarter's USD 574.0 million and above the third quarter of 2025's USD 544.0 million. The company is holding investment roughly flat rather than scaling it up with revenue growth. This allows freed-up funds to be directed to the balance sheet.
Net debt fell to USD 4.9 billion from USD 6.4 billion a year earlier
Net debt as of 30 September 2026 was USD 4.9 billion. A year earlier, on 30 September 2025, it was USD 6.4 billion – a reduction of USD 1.5 billion over 12 months. Over the quarter debt fell from USD 5.0 billion on 30 June to USD 4.9 billion on 30 September.
The ratio of net debt to trailing twelve-month EBITDA is 0.92. A level below one for an oil and gas company means moderate leverage. Free cash flow of USD 507.0 million for the quarter allows further debt reduction without resorting to new borrowing.
A dividend yield of 1.8% is modest against the key rate
The trailing twelve-month dividend yield is 1.8%. The company pays dividends, but their size is not disclosed in the provided data. With a market capitalisation of USD 17,861.0 million and trailing twelve-month profit of USD 1,321.0 million, payouts remain moderate relative to profit.
A yield of 1.8% is below the key rate, which makes the share less attractive to investors focused on current income. The main return of capital here comes through debt reduction and potential share price appreciation rather than dividends. If the company maintains free cash flow at USD 507.0 million per quarter, the dividend could be raised, but there are no specific statements to that effect in the data.
EV/EBITDA of 4.5 is in line with its own three-year average of 4.6
The trailing twelve-month EV/EBITDA multiple is 4.5. That is 2% below its own three-year average of 4.6, meaning the share is valued roughly as it has been historically. The trailing twelve-month P/E is 13.5, which looks moderate against a net margin of 21.5%.
The portal's model, which re-prices EBITDA at current commodity prices at the target EV/EBITDA, points to 48% downside to fair value. This is our own estimate, not a market consensus. It suggests the current price already reflects favourable conditions, and further growth needs a new driver.
Valuation on the latest reported figures
| Metric | Value |
|---|---|
| Market cap | 17.9 bn USD |
| P/E (LTM) | 13.5 |
| EV/EBITDA (LTM) | 4.5 |
| P/B | 1.60 |
| Net debt / EBITDA (LTM) | 0.92 |
| Operating cash flow (LTM) | 4.71 bn |
| ROE | 19.0% |
| Dividend yield (12m) | 1.8% |
| EV/EBITDA, 3-year average | 4.6 |
Bottom line
The strong side of the report is the rise in the EBITDA margin to 55.8% and a 3.7-fold increase in net profit, along with a reduction in net debt to USD 4.9 billion. Free cash flow of USD 507.0 million for the quarter confirms that profit converts into cash. However, revenue growth slowed from 29.7% to 25.4%, and trailing twelve-month profit includes a large quarterly loss, indicating instability. The EV/EBITDA valuation of 4.5 is in line with its historical average, and the portal's model points to 48% downside. The verdict is neutral: strong operating results are already priced in.
Open the company's financial profile OVV →
See also: market overview · valuation map · stock screeners