PEPSICO INC: profit up 17%, but organic growth only 3.1% — and the company itself cut its EPS guidance
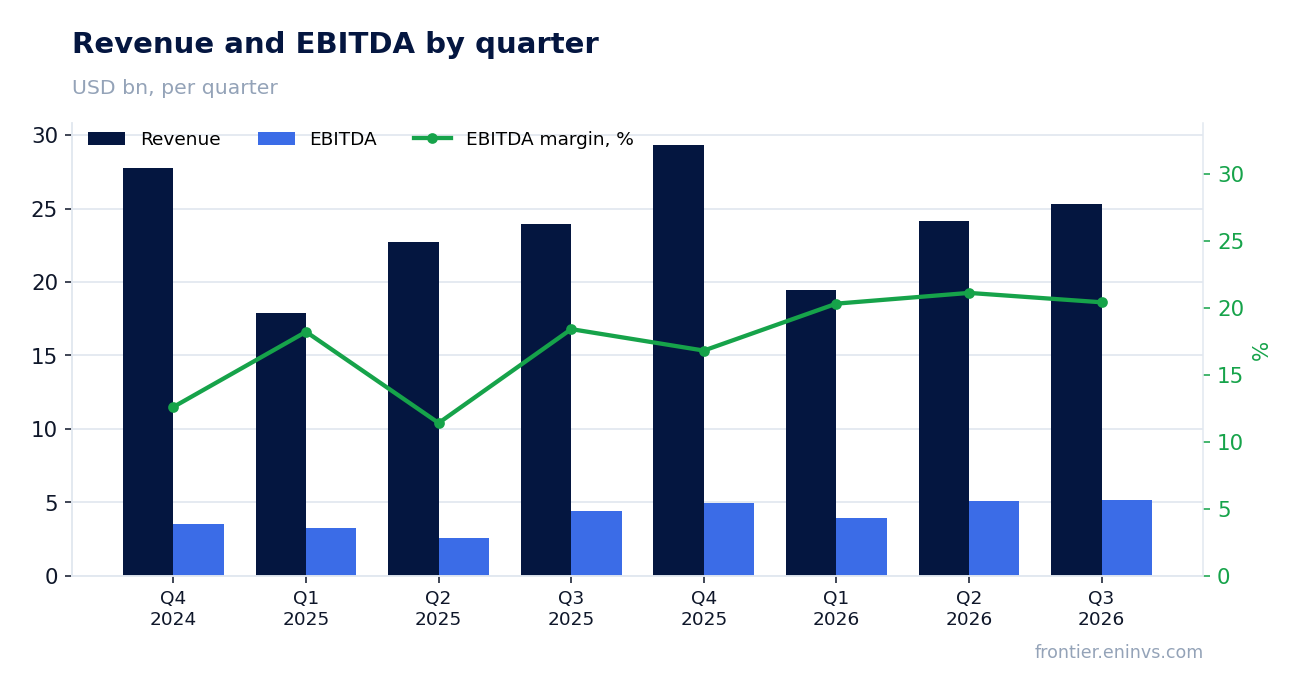
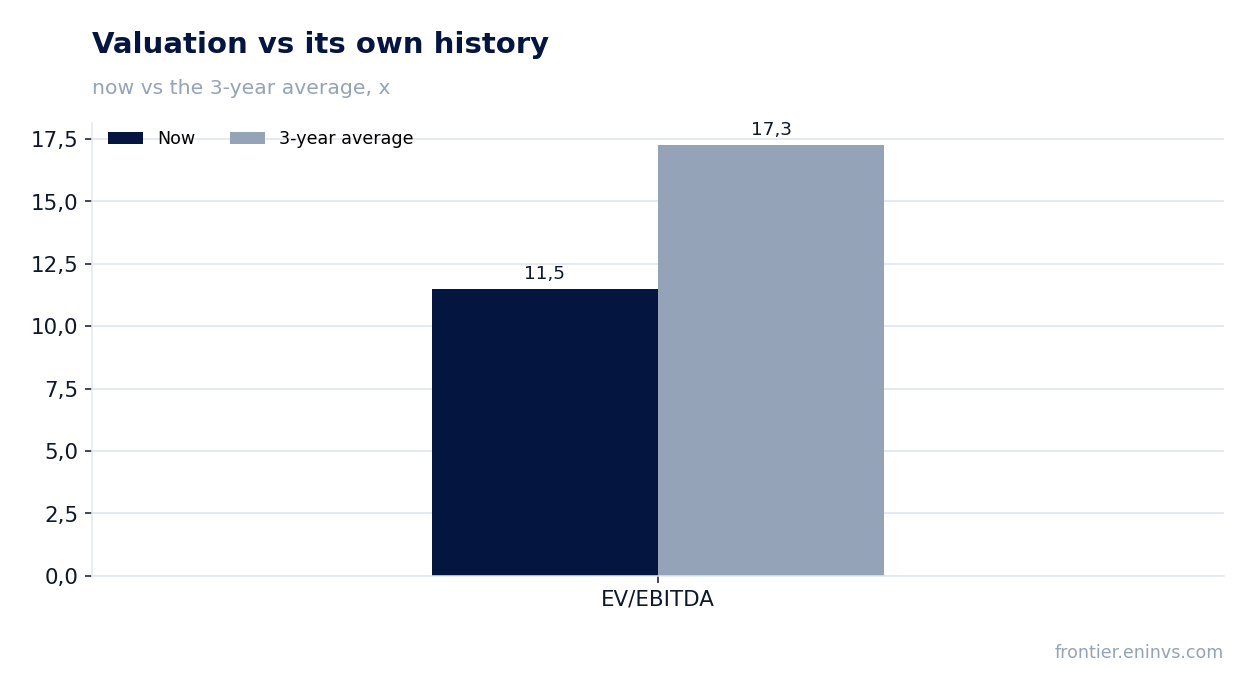
On October 8, PEPSICO INC released its third-quarter 2026 results. Revenue rose 5.6% year-on-year to $25,274 million, EBITDA grew 17.3% to $5,152 million, and net profit increased 17.1% to $3,048 million. However, organic growth was only 3.1%, and the company cut its core EPS guidance from 5–7% to 2.5–3.5%. At an EV/EBITDA multiple of 11.5 versus its own three-year average of 17.3, the stock looks cheaper than its history, but decelerating organic growth and weakness in the North American business prevent calling it unequivocally attractive.
Key takeaways
— Revenue rose 5.6%, but organic growth was only 3.1% — the rest came from acquisitions and currency
— Profit grew 17%, and a significant part of that growth came from one-off effects, not business improvement
— The North American food business cut operating profit by 13% — the company acknowledges the need for urgent measures
— Core EPS grew just 2%, and the company lowered its full-year guidance for this metric
— Free cash flow for nine months was $5,768 million, covering dividends and capital expenditures
— Net debt fell to $41.2 billion, and the EV/EBITDA multiple of 11.5 is below its own three-year average of 17.3
— Dividend yield of 4.5% with $8.9 billion in payouts looks sustainable, but dividend growth may slow
Attractiveness
Key figures, USD bn
| Metric | Q3 2025 | Q3 2026 | Change |
|---|---|---|---|
| Revenue | 23.9 | 25.3 | +5.6% |
| EBITDA | 4.39 | 5.15 | +17.3% |
| Operating profit | 3.57 | 4.26 | +19.4% |
| Net profit | 2.60 | 3.05 | +17.1% |
| Operating cash flow | 4.47 | 5.58 | +24.9% |
| Capex | 0.99 | 0.92 | -7.7% |
| EBITDA margin | 18.4% | 20.4% | +2.0 pp |
| Net margin | 10.9% | 12.1% | +1.2 pp |
Revenue rose 5.6%, but organic growth was only 3.1% — the rest came from acquisitions and currency
In the third quarter of 2026, PEPSICO INC revenue rose 5.6% year-on-year to $25,274 million. However, organic growth was only 3.1%, while acquisitions and structural changes added 1.7 percentage points and a positive foreign exchange translation effect added another 0.7 points. This means more than half of the revenue increase came from external factors rather than internal development.
Organic growth decelerated compared to the second quarter of 2026, when it was 6.4% year-on-year. The slowdown is primarily explained by weakness in the North American food business: revenue in the PepsiCo Foods North America segment was unchanged year-on-year, and volume grew only 0.5%. At the same time, international segments showed strong results: revenue in Latin America grew 14%, in Asia Pacific 10%, and in Europe, Middle East and Africa 8%.
The company notes that organic revenue growth was driven by effective net pricing and a contribution from organic volume. However, in North America, revenue trends in the food segment improved sequentially but remain weak: volume growth in snacks was offset by lower effective net pricing. In North American beverages, revenue grew 5%, but mainly due to 2025 acquisitions, while organic growth was only 1%.
Profit grew 17%, and a significant part of that growth came from one-off effects, not business improvement
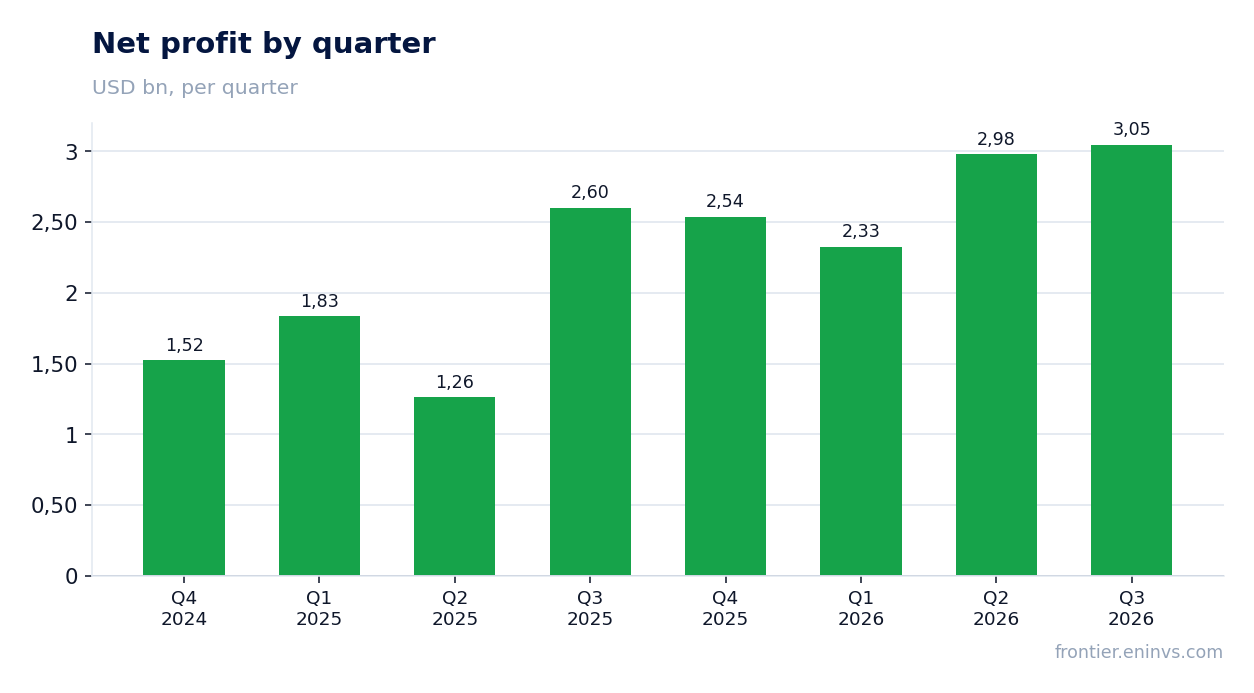
Operating profit in the third quarter of 2026 rose 19% year-on-year to $4,260 million, and net profit increased 17.1% to $3,048 million. However, this growth was largely driven by one-off factors: a favorable net impact of acquisition and divestiture-related charges/credits and a favorable impact of net mark-to-market gains on commodity derivatives. Excluding these factors, core operating profit grew only 3%, and core EPS grew only 2%.
Core operating margin contracted 35 basis points to 16.9%, reflecting higher operating costs and increased advertising and marketing expenses, partially offset by productivity savings and effective net pricing. The company also received a 4-percentage-point favorable impact from tariff refunds, which is also a one-off factor.
Net margin in the reported period was 12.1% versus 10.9% a year earlier, and EBITDA margin was 20.4% versus 18.4%. This margin improvement looks positive, but it was achieved mainly through one-off items rather than sustainable operational efficiency gains. Year-to-date, operating profit rose 45%, but this is mainly due to prior-year impairment charges related to the Rockstar and Be & Cheery brands totaling $1,993 million.
The North American food business cut operating profit by 13% — the company acknowledges the need for urgent measures
Operating profit in the PepsiCo Foods North America segment in the third quarter of 2026 fell 13% year-on-year to $1,333 million. This is the company's weakest segment: revenue was unchanged, and volume growth in snacks was offset by lower effective net pricing. Core operating profit for the segment fell 12%.
CEO Ramon Laguarta explicitly acknowledged the need for urgent measures: "We remain focused on building upon the strength of the International business while acting with urgency to sustainably improve our performance in North America through more investments in innovation, effective brand building, and sharper marketplace execution by channel." The company also said it is identifying additional structural cost reduction actions to be implemented in the coming months to help fund investments and mitigate the impacts of rising input cost inflation.
By comparison, international segments showed strong dynamics: operating profit in Latin America grew 47%, in Asia Pacific 15%, and in Europe, Middle East and Africa 25%. However, the North American business remains key for the company, and its weakness puts pressure on overall results.
Core EPS grew just 2%, and the company lowered its full-year guidance for this metric
Core EPS in the third quarter of 2026 grew only 2% year-on-year to $2.34, while diluted GAAP EPS rose 17% to $2.23. The gap is explained by the fact that GAAP profit growth was driven by one-off factors that the company excludes from its core metric.
The company significantly lowered its guidance for fiscal 2026: core EPS growth is now expected at 2.5–3.5% versus the previous guidance of 5–7%. Organic revenue guidance remained at approximately 3%, but total revenue guidance was raised to approximately 6% due to higher contributions from currency and acquisitions. Capital spending guidance remained below 5% of net revenue, and free cash flow conversion ratio at least 80%.
Lowering EPS guidance while raising revenue guidance means the company expects continued margin pressure. This is confirmed by quarterly results: core operating margin contracted 35 basis points. The main reasons are higher operating costs, increased advertising and marketing expenses, and the need for additional investments in the North American business.
Free cash flow for nine months was $5,768 million, covering dividends and capital expenditures
Operating cash flow for the first nine months of 2026 was $7,950 million, and capital expenditures were $2,182 million. Free cash flow thus amounted to $5,768 million. This is sufficient to cover dividend payments of $5,935 million, albeit with a small deficit covered by cash balances.
In the third quarter of 2026, operating cash flow was $5,585 million, and capital expenditures were $916 million. This is significantly better than in the second quarter, when operating cash flow was $2,324 million, and in the first quarter, when it was only $41 million. The improvement in cash flow in the third quarter is partly seasonal but also reflects more efficient working capital management.
The company confirmed its guidance for free cash flow conversion ratio at least 80% and capital spending below 5% of net revenue. This means that even under profit pressure, the company maintains the ability to generate cash flow sufficient to fund dividends and investments.
Net debt fell to $41.2 billion, and the EV/EBITDA multiple of 11.5 is below its own three-year average of 17.3
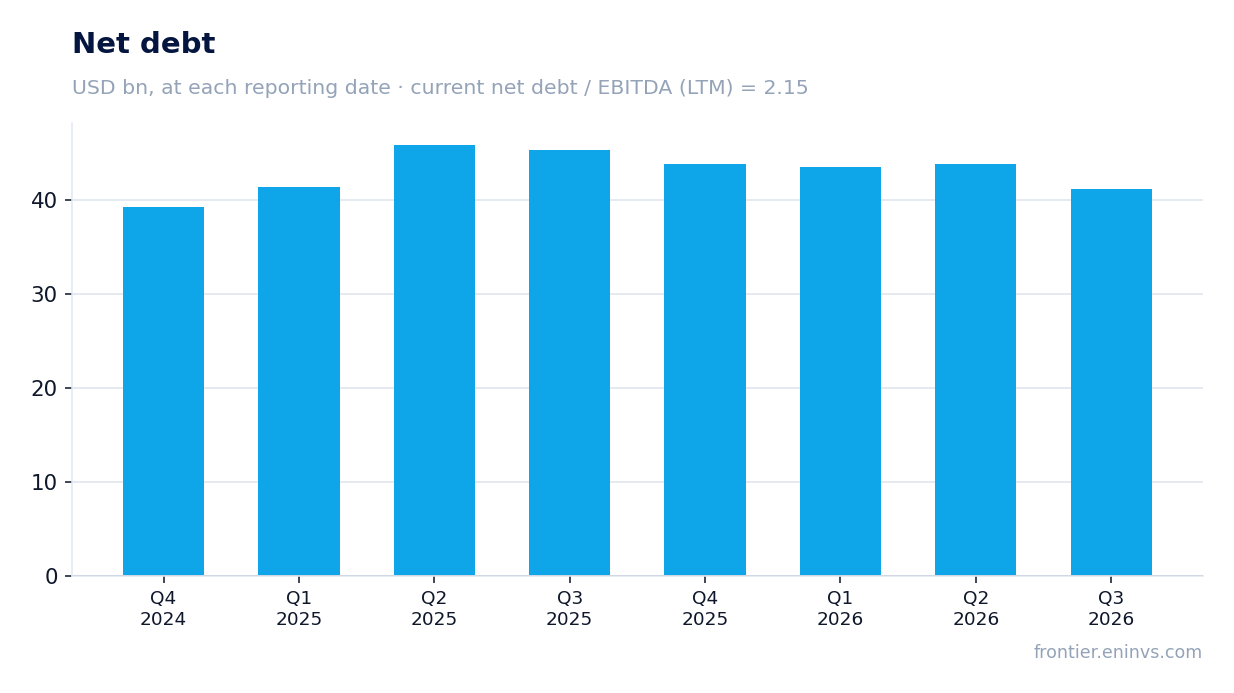
Net debt as of September 5, 2026 was $41,206 million, down from $43,874 million on June 13, 2026, and from $45,388 million on September 6, 2025. The decline over the year was $4,182 million. The net debt to EBITDA ratio for the trailing twelve months is 2.15 — a moderate level for an investment-grade company.
The EV/EBITDA multiple for the trailing twelve months is 11.5, which is 33% below its own three-year average of 17.3. This means the stock trades cheaper than its historical valuation on this metric. The P/E multiple for the trailing twelve months is 16.2, and the dividend yield is 4.5%.
According to the portal's model, which compares EBITDA growth with the target multiple and market capitalization, the upside to fair value is estimated at +22%. This is our own estimate, not a market consensus. The stock is held in the live model strategy Frontier AI Selection on the portal, which is a fact, not an argument for the valuation.
Dividend yield of 4.5% with $8.9 billion in payouts looks sustainable, but dividend growth may slow
The dividend yield for the trailing twelve months is 4.5% at the current price. The company plans to return $8.9 billion to shareholders in 2026, of which $7.9 billion is dividends and $1.0 billion is share repurchases. For the first nine months of 2026, dividends amounted to $5,935 million, consistent with the annual plan.
Our estimate for the 2026 dividend is based on the company's guidance for core EPS growth of 2.5–3.5% and a payout ratio of about 60–65%. At the current price and expected dividend, the yield could be around 4.5–4.7%. This is above the key rate, making the stock attractive for income investors, but dividend growth may slow due to profit pressure.
The main risk to the dividend is further deterioration in the North American business and the need for increased investment there. The company has already announced additional cost reduction measures to fund investments. If profit growth continues to slow, the company may maintain the current dividend level, but its growth rate will decelerate.
Valuation on the latest reported figures
| Metric | Value |
|---|---|
| Market cap | 176 bn USD |
| P/E (LTM) | 16.2 |
| EV/EBITDA (LTM) | 11.5 |
| P/B | 8.64 |
| Net debt / EBITDA (LTM) | 2.15 |
| ROE | 18.3% |
| Dividend yield (12m) | 4.5% |
| EV/EBITDA, 3-year average | 17.3 |
Tracked metrics of the idea
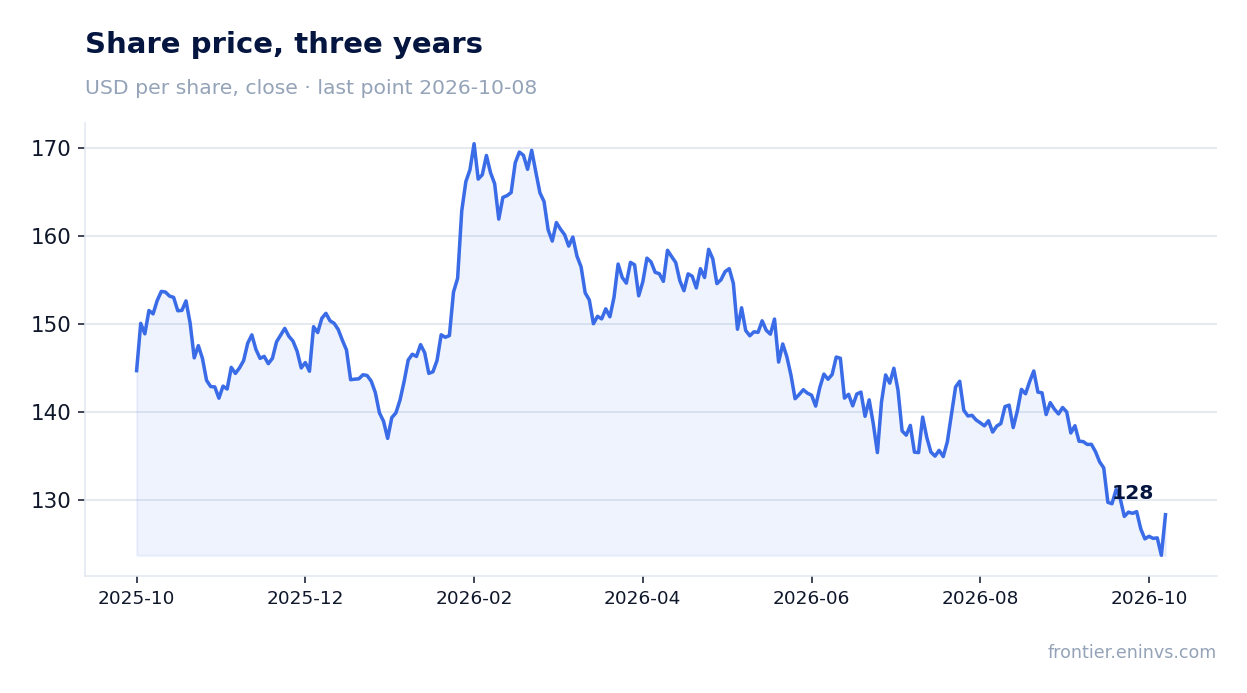
The metrics we track our idea "PepsiCo" of 2026-07-22 by - at the idea date and now. The share price moved -5% over the period. Original write-up: https://frontier.eninvs.com/region/us/article/pep
Idea: at publication and now
| Metric | 2026-07-22, price 136 | Now, price 128 |
|---|---|---|
| Fundamental value created, share of market cap | +22% | +22% |
Bottom line
The report's strengths include 5.6% revenue growth, 17.3% EBITDA growth, and a reduction in net debt to $41.2 billion. However, a significant portion of profit growth came from one-off factors, and organic growth was only 3.1%. The company lowered its core EPS guidance, reflecting margin pressure and weakness in the North American business. At an EV/EBITDA multiple of 11.5 versus a three-year average of 17.3, the stock looks cheaper than its history, and a 4.5% dividend yield supports its appeal for income investors. However, sustainable growth requires improvement in North America, and until there are signs of such improvement, the assessment remains neutral.
Open the company's financial profile PEP →
See also: market overview · valuation map · stock screeners