Palantir Technologies Inc.: revenue up 95.9% as US commercial overtakes government for the first time

On 2 November Palantir Technologies Inc. reported results for the third quarter of 2026. Revenue reached $2,313.4 million, up 95.9% year over year, adjusted EBITDA came in at $1,433.9 million at a 62.0% margin, and net income was $1,128.0 million. US commercial revenue grew 148% and surpassed US government revenue for the first time in the company's history. The stock trades below its own three-year history on EV/EBITDA, and the portal's model implies +17% upside to fair value, so the share looks attractive at the current price.
Key takeaways
— Revenue accelerated to 95.9% year over year, with nearly half coming from US commercial
— EBITDA margin rose to 62.0% on the same pace of hiring and sales
— Net income of $1,128.0 million is clean of one-offs, and cash flow confirms it
— There is effectively no debt: a net cash position and a negative ratio to EBITDA
— The stock trades at 103.0x EBITDA against a three-year average of 270.9x – a discount to its own history
— The portal's model implies +17% to fair value, yet the market met the report with a 3.1% decline
Attractiveness
Key figures, USD bn
| Metric | Q3 2025 | Q3 2026 | Change |
|---|---|---|---|
| Revenue | 1.18 | 2.31 | +95.9% |
| EBITDA | 0.40 | 1.43 | +259.2% |
| Operating profit | 0.39 | 1.08 | +175.9% |
| Net profit | 0.48 | 1.13 | +137.2% |
| Operating cash flow | 0.51 | 1.20 | +137.3% |
| Capex | 0.01 | — | — |
| EBITDA margin | 33.8% | 62.0% | +28.2 pp |
| Net margin | 40.3% | 48.8% | +8.5 pp |
Revenue accelerated to 95.9% year over year, with nearly half coming from US commercial
Revenue for the third quarter of 2026 was $2,313.4 million, up 95.9% from a year earlier. That is an acceleration from the second quarter, when growth was 92.8%. Quarterly revenue exceeded $2 billion for the first time.
The main driver is US commercial: it grew 148% year over year and 29% quarter over quarter, to $984 million. US government added 96% and reached $953 million. For the first time, US commercial revenue surpassed US government revenue, and that changes the business mix: the company is less dependent on a single budget customer.
Total US revenue grew 119% year over year, to $1,937 million. The rest of the world grows more slowly, but the overall rate is still accelerating. The company closed 212 deals of at least $1 million, 107 of at least $5 million and 64 of at least $10 million, while total contract value was $2,918 million, up 6% year over year.
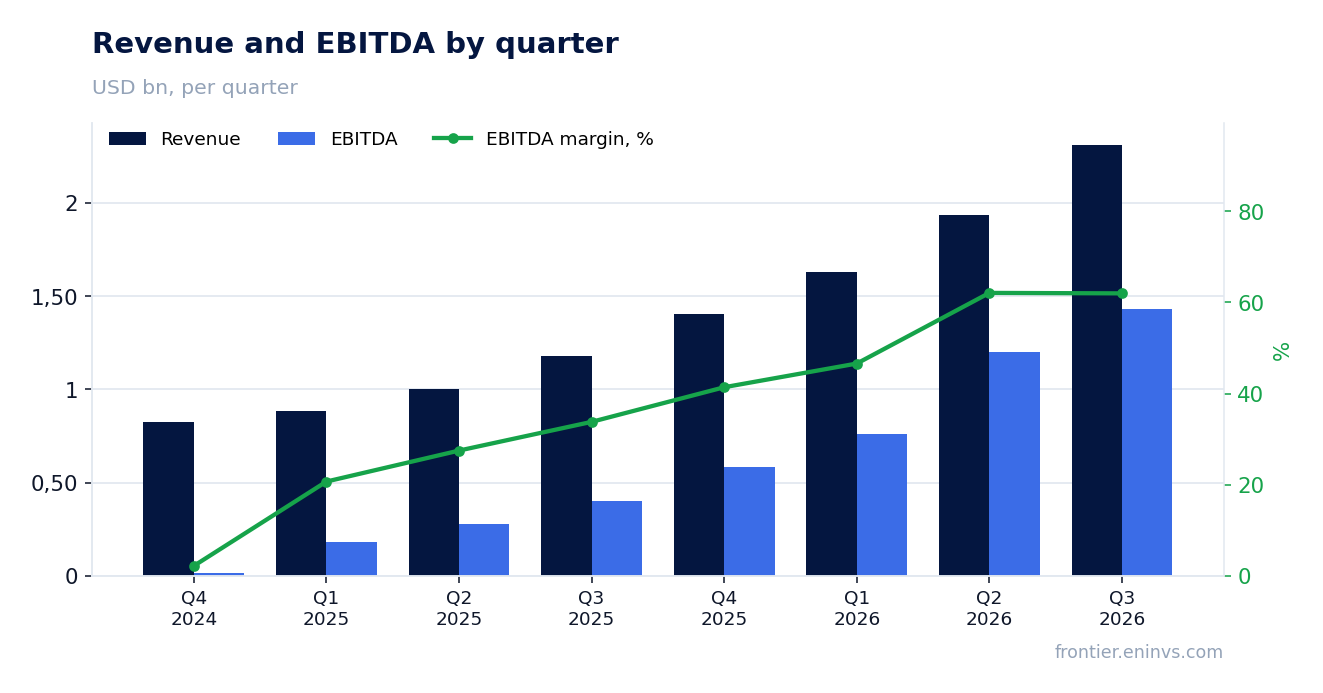
EBITDA margin rose to 62.0% on the same pace of hiring and sales
Adjusted EBITDA was $1,433.9 million at a 62.0% margin, against 33.8% a year earlier. GAAP operating income reached $1,084.8 million, or 47% of revenue. The margin gain did not come from cutting costs: sales and marketing rose to $396.7 million, research and development to $219.7 million, and general and administrative expenses to $228.8 million.
Costs are rising, but more slowly than revenue, and that is the key. Cost of revenue increased to $383.3 million, yet gross profit rose to $1,930.1 million. The company keeps high operating efficiency while scaling: its Rule of 40 score is 158%.
Adjusted operating income was $1,426.8 million at a 62% margin. The gap between GAAP and adjusted profit is mainly stock-based compensation of $318.9 million. It grew year over year but does not prevent the company from being profitable on a GAAP basis.
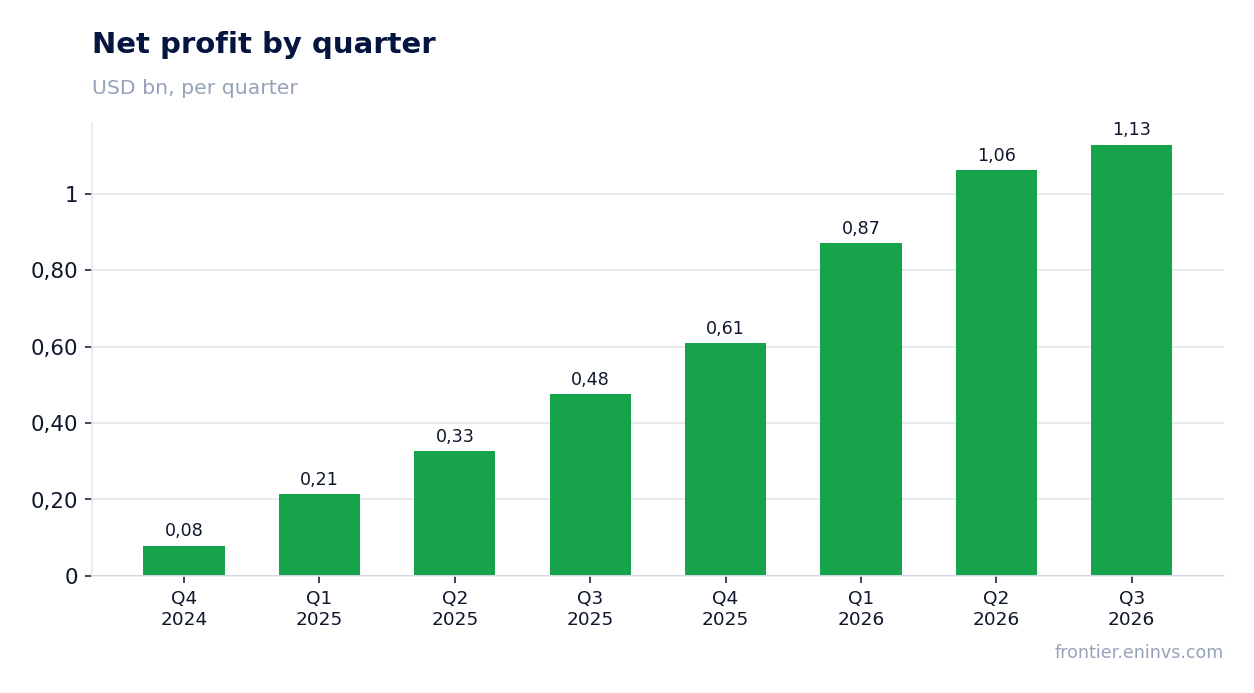
Net income of $1,128.0 million is clean of one-offs, and cash flow confirms it
Net income attributable to common stockholders was $1,128.0 million, or 48.8% of revenue, against 40.3% a year earlier. Profit growth of 137.2% outpaces revenue growth. There are no large one-off asset sales inside the profit: the main contribution comes from operations.
Operating cash flow for the quarter was $1,204.6 million at a 52% margin. Adjusted free cash flow was $1,216.1 million, or 53% of revenue. Cash flow almost matches net income, which confirms its quality.
Interest income brought in $88.9 million – the company earns on its cash pile. Other expenses were $25.8 million and income tax was $13.6 million. Pre-tax income reached $1,148.0 million.
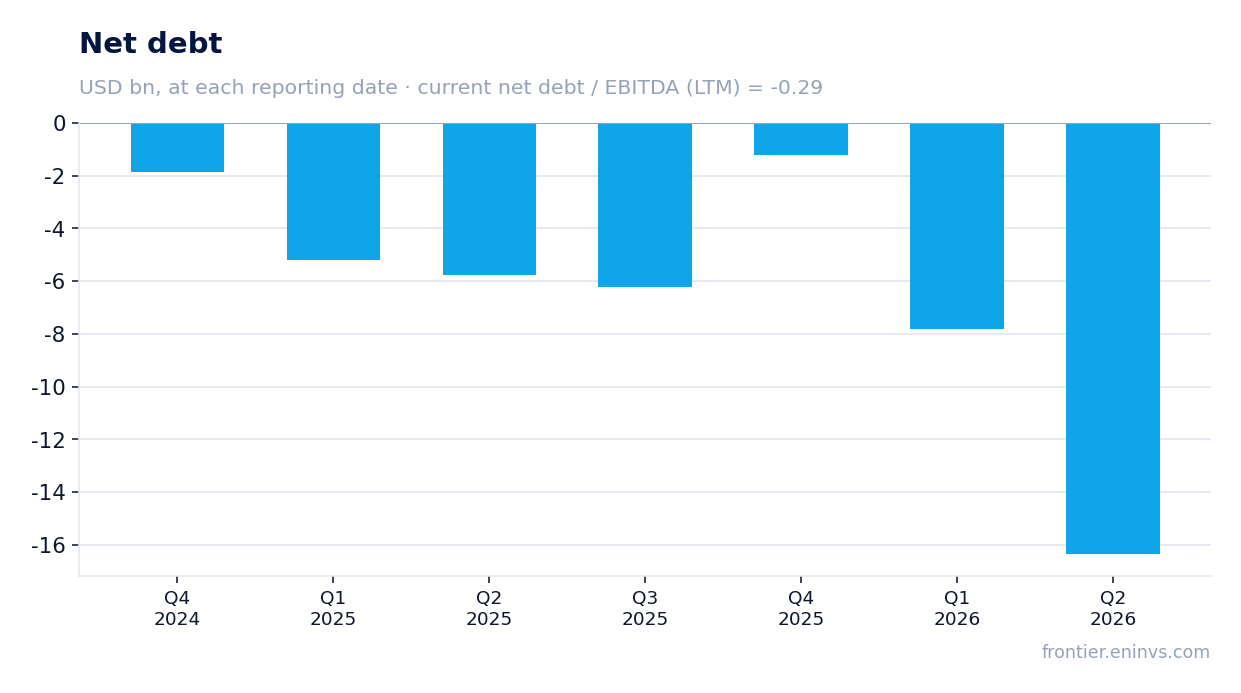
There is effectively no debt: a net cash position and a negative ratio to EBITDA
At the end of 2025, net debt was minus $1,194.5 million, meaning the company had a net cash position. The ratio of net debt to trailing-twelve-month EBITDA is minus 0.29. There is no debt burden.
Cash and US Treasury securities at the end of the third quarter stood at $10.4 billion. That gives the company freedom for investment and acquisitions without raising debt.
Operating cash flow for the nine months of 2026 reached $3,319.9 million against $1,357.2 million a year earlier. The company funds growth from its own resources rather than debt.
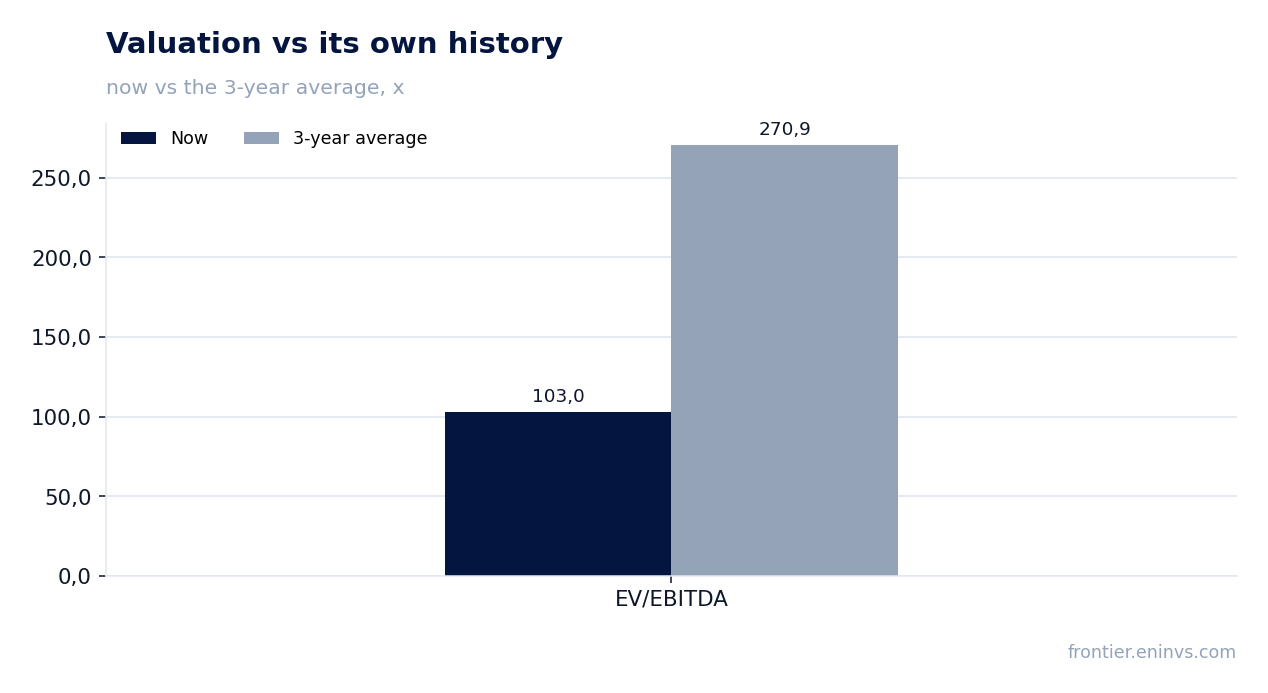
The stock trades at 103.0x EBITDA against a three-year average of 270.9x – a discount to its own history
On the trailing-twelve-month EV/EBITDA multiple the stock trades at 103.0x against a three-year average of 270.9x. That is 62% below its own history, meaning the share is cheaper than usual.
The trailing-twelve-month P/E is 116.2. Return on equity is 43.0%. Market capitalisation is $426.4 billion.
The lower multiple reflects rapid EBITDA growth: over the last twelve months it was $4,127.0 million, while profit is growing faster than the share price. The market has not yet re-rated the company for its new scale.
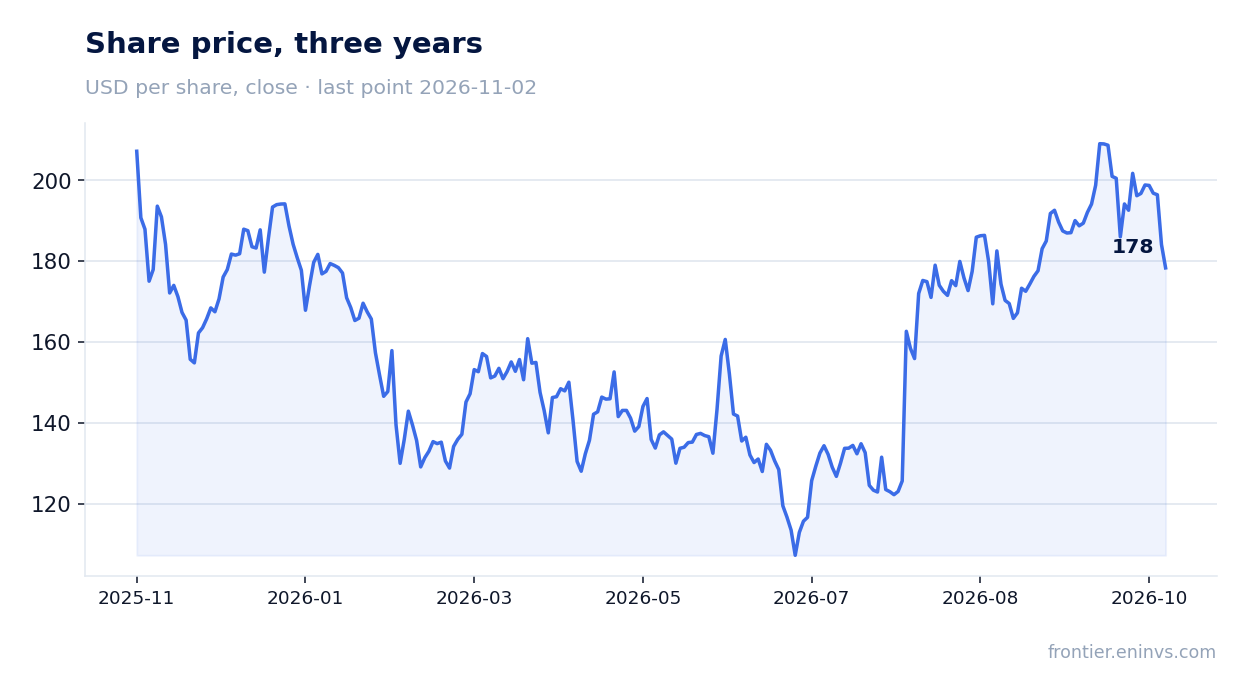
The portal's model implies +17% to fair value, yet the market met the report with a 3.1% decline
On the portal's model, which compares EBITDA growth with a target multiple and market capitalisation, the upside to fair value is +17%. This is our own estimate, not a market consensus.
The market reaction was muted: the share fell 3.1% on the day of the report, and from publication to 2 November the decline was also 3.1%. The closing price before the report was $184.1.
The company raised its 2026 revenue guidance to $8,530–8,534 million, implying 91% year-over-year growth, and its US commercial revenue guidance to more than $3,559 million, or at least 143% growth. Guidance for adjusted operating income is $5,245–5,249 million and for free cash flow $4.8–5.0 billion. For the fourth quarter it expects revenue of $2,649–2,653 million.
Valuation on the latest reported figures
| Metric | Value |
|---|---|
| Market cap | 426 bn USD |
| P/E (LTM) | 116.2 |
| EV/EBITDA (LTM) | 103.0 |
| P/B | 57.73 |
| Net debt / EBITDA (LTM) | -0.29 |
| Operating cash flow (LTM) | 4.10 bn |
| ROE | 43.0% |
| EV/EBITDA, 3-year average | 270.9 |
Bottom line
The quarter is genuinely strong: revenue grew 95.9%, EBITDA margin reached 62.0%, and net income of $1,128.0 million is confirmed by cash flow. US commercial revenue surpassed government for the first time, changing the company's profile. There are no one-offs in profit, effectively no debt, and an EV/EBITDA multiple of 103.0x against a three-year average of 270.9x points to a discount to its own history. The question for a holder now is whether US commercial growth holds at 148% – that is what determines whether the stock delivers the +17% implied by the portal's model.
Open the company's financial profile PLTR →
See also: market overview · valuation map · stock screeners