Philip Morris International Inc.: revenue growth slowed to +5.5%, but operating income rose 14.1%

On October 21, Philip Morris International Inc. reported third-quarter 2026 results. Revenue rose 5.5% year on year to $11,438 million, operating income grew 14.1% to $4,866 million, and diluted EPS fell 4.9% to $2.12. Revenue growth slowed from 10.4% in the second quarter, while EPS was held back by a non-cash fair value adjustment on equity investments. At an EV/EBITDA of 19.2 versus its own three-year average of 15.5, the share looks more expensive than its history, and the verdict is neutral.
Key takeaways
— Revenue rose 5.5% but slowed from 10.4% in the second quarter
— Operating income added 14.1% on price and scale, not volume
— Diluted EPS fell 4.9% on a non-cash equity investment revaluation
— Adjusted EPS grew 5.4% to $2.36
— Dividend raised 8.8% to $1.60 per quarter, yield 3.0%
— Leverage at 2.26x EBITDA is a level, not an improvement
— EV/EBITDA of 19.2 is 24% above its own three-year average of 15.5
Attractiveness
Key figures, USD bn
| Metric | Q3 2025 | Q3 2026 | Change |
|---|---|---|---|
| Revenue | 10.8 | 11.4 | +5.5% |
| EBITDA | 4.77 | — | — |
| Operating profit | 4.26 | 4.87 | +14.1% |
| Net profit | 3.48 | — | — |
| Operating cash flow | 4.46 | — | — |
| Capex | 0.36 | — | — |
| EBITDA margin | 44.0% | — | — |
| Net margin | 32.1% | — | — |
Revenue rose 5.5% but slowed from 10.4% in the second quarter
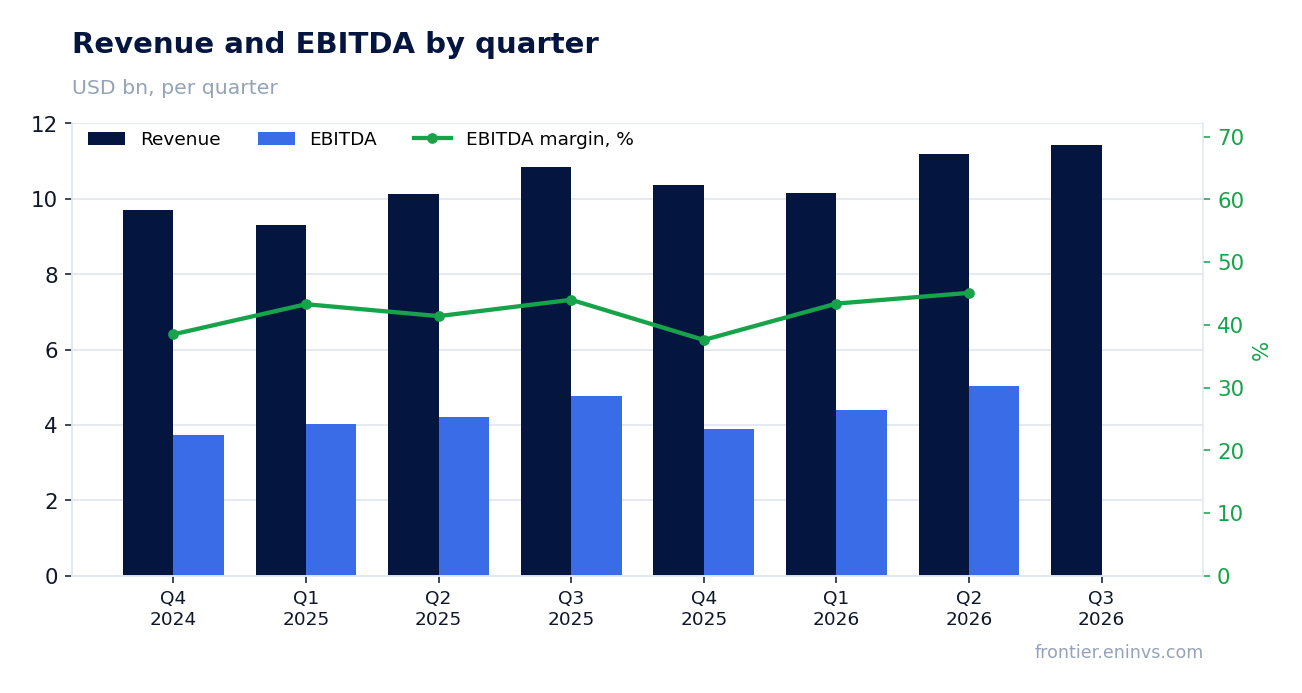
Third-quarter 2026 revenue was $11,438 million, up 5.5% year on year. Growth was 10.4% in the second quarter, so the pace slowed. Organic revenue growth was 7.1%, according to the release.
Price was the main driver: pricing added $739 million, while volume and mix added only $36 million. The weak volume contribution reflects total shipment growth of just 0.6%, with cigarette shipments broadly flat.
By segment, international combustibles rose 6.5% to $6,725 million, international smoke-free grew 0.7% to $3,867 million, and the U.S. segment jumped 22.7% to $845 million. Smoke-free products accounted for more than 40% of revenue.
The slowdown does not signal weakness: the company points to a challenging heat-not-burn comparison due to shipment phasing, notably in Japan. It expects a fourth-quarter reacceleration in international smoke-free.
Operating income added 14.1% on price and scale, not volume
Third-quarter operating income was $4,866 million, up 14.1% year on year. Organic operating income growth was 10.5%. This is a new quarterly record for the group.
Profit grew faster than revenue because gross profit rose 6.7% to $7,854 million, while marketing, administration and research costs fell 2.1% to $2,993 million. The cost decline partly reflects lower adjusting items: $251 million in the quarter versus $407 million a year earlier.
Adjusted operating income grew 9.6% to $5,117 million, and the adjusted margin rose 1.6 pp to 44.7%. Pricing added $739 million, while volume and mix subtracted $23 million and costs subtracted $71 million.
Profit growth rests on price and scale, not shipment volume. That is a durable model for a tobacco business, but it makes results sensitive to the ability to raise prices without losing consumers.
Diluted EPS fell 4.9% on a non-cash equity investment revaluation
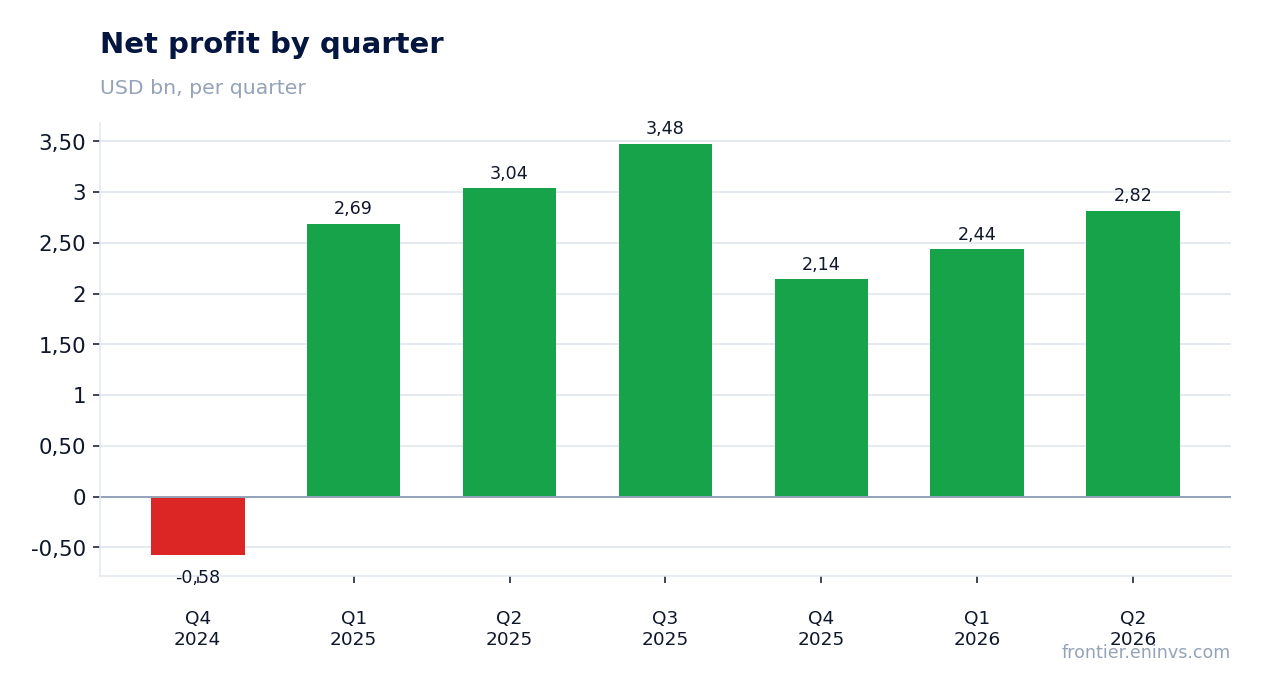
Third-quarter diluted EPS was $2.12, down 4.9% year on year. The decline is explained by a non-cash fair value adjustment on equity security investments, which added $0.06 to EPS this quarter versus a $0.07 subtraction a year earlier.
Adjusted diluted EPS rose 5.4% to $2.36, and by 5.8% excluding currency to $2.37. This is a quarterly all-time high. The adjusted measure excludes amortization of intangibles, investment revaluation, tax items and one-offs.
The gap between reported and adjusted profit is not operational: it is an accounting revaluation of the securities portfolio. For valuing the business, the adjusted figure matters more, and it has grown for a fifth consecutive quarter.
Adjusted EPS grew 5.4% to $2.36
Third-quarter adjusted diluted EPS was $2.36, up 5.4% year on year. Excluding currency, growth was 5.8%. This is the highest quarterly result in the company's history.
For the first nine months of 2026, adjusted EPS rose 11.8% to $6.52, and by 8.4% excluding currency to $6.32. Reported EPS for the nine months fell 7.0% to $5.48 on one-off items, including a $0.33 per share impairment of the RBH investment.
The company's full-year 2026 forecast is adjusted EPS of $8.29–$8.44, up 9.9–11.9% from $7.54 in 2025. Excluding currency, growth would be 7.5–9.5%. The forecast assumes organic revenue growth of 5–7% and organic operating income growth of 7–9%.
Dividend raised 8.8% to $1.60 per quarter, yield 3.0%
The company raised its regular quarterly dividend by 8.8% to $1.60 per share, or $6.40 annualized. The board announced the decision alongside the results. The dividend yield at the current price is 3.0%.
Our estimate for the 2026 dividend is based on the $6.40 annual payout against forecast adjusted EPS of $8.29–$8.44. That implies a payout ratio of about 76–77% of adjusted earnings. The company does not buy back shares, so the dividend remains the main way of returning capital.
A 3.0% yield is modest versus many fixed-income instruments, but the dividend is growing at a double-digit pace. Trailing twelve-month EBITDA was $18,184 million, and the company forecasts operating cash flow of around $13.5 billion for the year. The payout is covered by cash flow.
A smaller payout could come from slower profit growth, for example due to rising energy costs or heavier investment in the U.S. segment. The company has already warned of additional spending to support ZYN in the fourth quarter.
Leverage at 2.26x EBITDA is a level, not an improvement
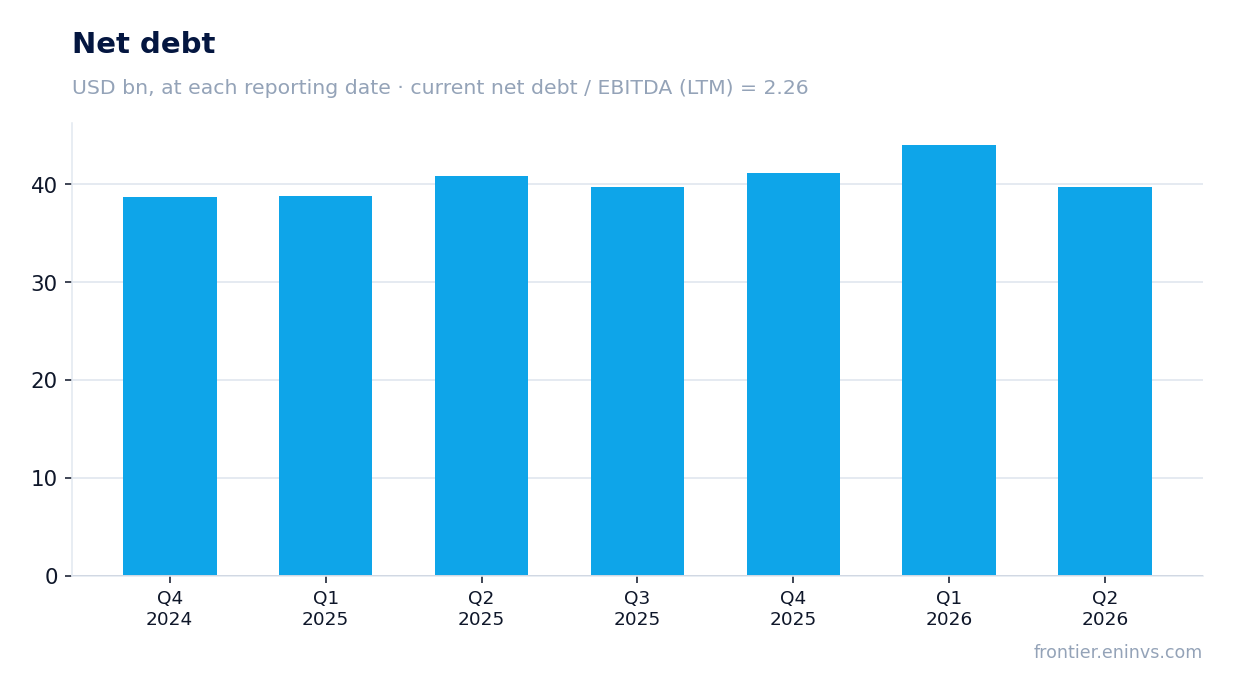
Net debt at the latest balance sheet date was $41,163 million, and the ratio of net debt to trailing twelve-month EBITDA was 2.26. This is a level, not a direction: we do not have an earlier value for this ratio, so we cannot say leverage rose or fell.
The company targets a net debt to adjusted EBITDA ratio of close to 2.0 by the end of 2026. That is a management target, not a fact. Achieving it requires EBITDA growth and restrained debt growth.
The company estimates operating cash flow for the first nine months of 2026 at around $13.5 billion, with capital expenditures of $1.4–1.6 billion. Free cash flow covers the dividend and allows debt reduction without new borrowing.
EV/EBITDA of 19.2 is 24% above its own three-year average of 15.5
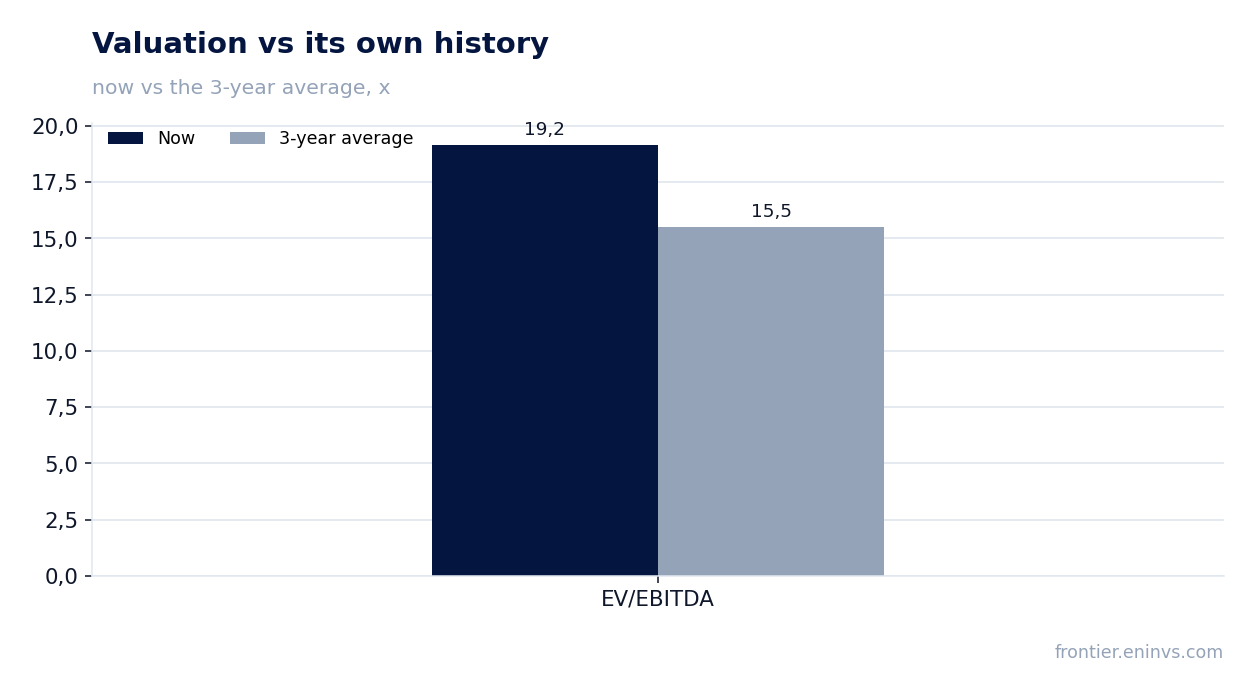
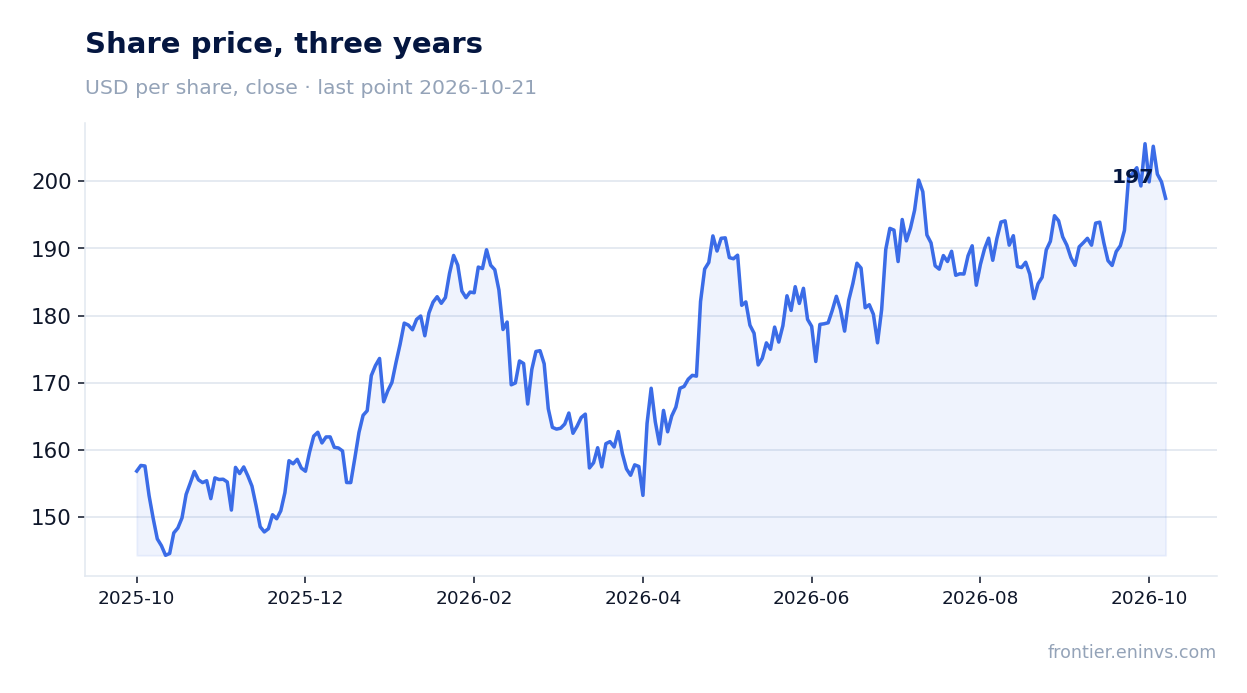
The trailing twelve-month EV/EBITDA multiple is 19.2, which is 24% above its own three-year average of 15.5. The share trades above its history. The trailing P/E is 28.3.
Market capitalization is $307,248 million. On the portal's model, which compares EBITDA growth with a target multiple, the upside to fair value is estimated at +17%. This is our own estimate, not a market consensus.
The premium is justified by business quality: a 44.7% operating margin, double-digit profit growth, and a rising dividend. But further multiple expansion requires sustained revenue and profit growth, and revenue growth slowed to 5.5% in the third quarter.
The market reaction was muted: the share fell 1.2% on the release day and is down 1.2% from the release to October 21. Investors appear to have expected a stronger revenue acceleration than 5.5%.
Valuation on the latest reported figures
| Metric | Value |
|---|---|
| Market cap | 307 bn USD |
| P/E (LTM) | 28.3 |
| EV/EBITDA (LTM) | 19.2 |
| Net debt / EBITDA (LTM) | 2.26 |
| ROE | -112.7% |
| Dividend yield (12m) | 3.0% |
| EV/EBITDA, 3-year average | 15.5 |
Bottom line
A strong quarter: operating income rose 14.1%, adjusted EPS grew 5.4%, and the dividend was raised 8.8%. The weak spot is revenue: growth slowed to 5.5% from 10.4% in the second quarter, and pricing drove almost all of the increase. Reported EPS fell on a non-cash revaluation unrelated to the business. The key question for a holder is whether they are willing to pay an EV/EBITDA of 19.2 versus its own average of 15.5 for slowing growth. The verdict is neutral: the business is high-quality, but the price already reflects much of it.
Open the company's financial profile PM →
See also: market overview · valuation map · stock screeners