Permian Resources: revenue up 48.1%, but hedges kept most of the profit from reaching the cash line
On 4 November, Permian Resources Corporation reported third-quarter 2026 results. Revenue reached $1,957.7 million (+48.1% YoY), EBITDA – $1,480.8 million (+62.2%), net profit – $420.2 million (+609.3%). The EBITDA margin rose to 75.6% from 69.0% a year earlier, but a non-cash derivative loss of $308.6 million and net debt of $4.4 billion capped the return to shareholders. At an EV/EBITDA of 5.0 against its own three-year average of 6.1, the stock looks cheaper than its own history, and the verdict is 'rather attractive'.
Key takeaways
— Revenue rose 48.1% on higher output and prices, but growth decelerated from 55.1% in Q2
— The EBITDA margin rose to 75.6% on record-low unit costs, not on one-off items
— Net profit grew 7x, but a $308.6 million hedging loss never reached the cash flow
— Free cash flow of $846 million covers the dividend with room to spare, though net debt rose to $4.4 billion
— EV/EBITDA of 5.0 is below its own three-year average of 6.1 – the stock is cheaper than its own history
Attractiveness
Key figures, USD bn
| Metric | Q3 2025 | Q3 2026 | Change |
|---|---|---|---|
| Revenue | 1.32 | 1.96 | +48.1% |
| EBITDA | 0.91 | 1.48 | +62.2% |
| Operating profit | 0.39 | 0.89 | +127.1% |
| Net profit | 0.06 | 0.42 | +609.3% |
| Operating cash flow | 0.77 | 1.25 | +63.7% |
| Capex | 0.49 | 0.52 | +6.6% |
| EBITDA margin | 69.0% | 75.6% | +6.6 pp |
| Net margin | 4.5% | 21.5% | +17.0 pp |
Revenue rose 48.1% on higher output and prices, but growth decelerated from 55.1% in Q2
Third-quarter revenue reached $1,957.7 million versus $1,321.8 million a year earlier – growth of 48.1%. In Q2 the pace was higher at 55.1%, so this is deceleration, not acceleration. Oil sales drove the bulk: they rose to $1,640.8 million from $1,113.8 million a year earlier.
Oil output reached 208.0 thousand barrels per day, up 5% quarter-on-quarter, and total output was 457.5 thousand barrels of oil equivalent per day, up 22% from the prior quarter. The average oil price was $85.73 per barrel versus $64.77 a year earlier. The company brought back high-GOR wells that had been curtailed in Q2 due to negative regional gas prices.
Gas sales rose to $52.0 million from $33.9 million, and NGL sales to $263.6 million from $170.4 million. Growth across all three streams reflects both volume and price, not a one-off. The slowdown versus Q2 is explained by the high base: revenue was already rising a year earlier.
The EBITDA margin rose to 75.6% on record-low unit costs, not on one-off items
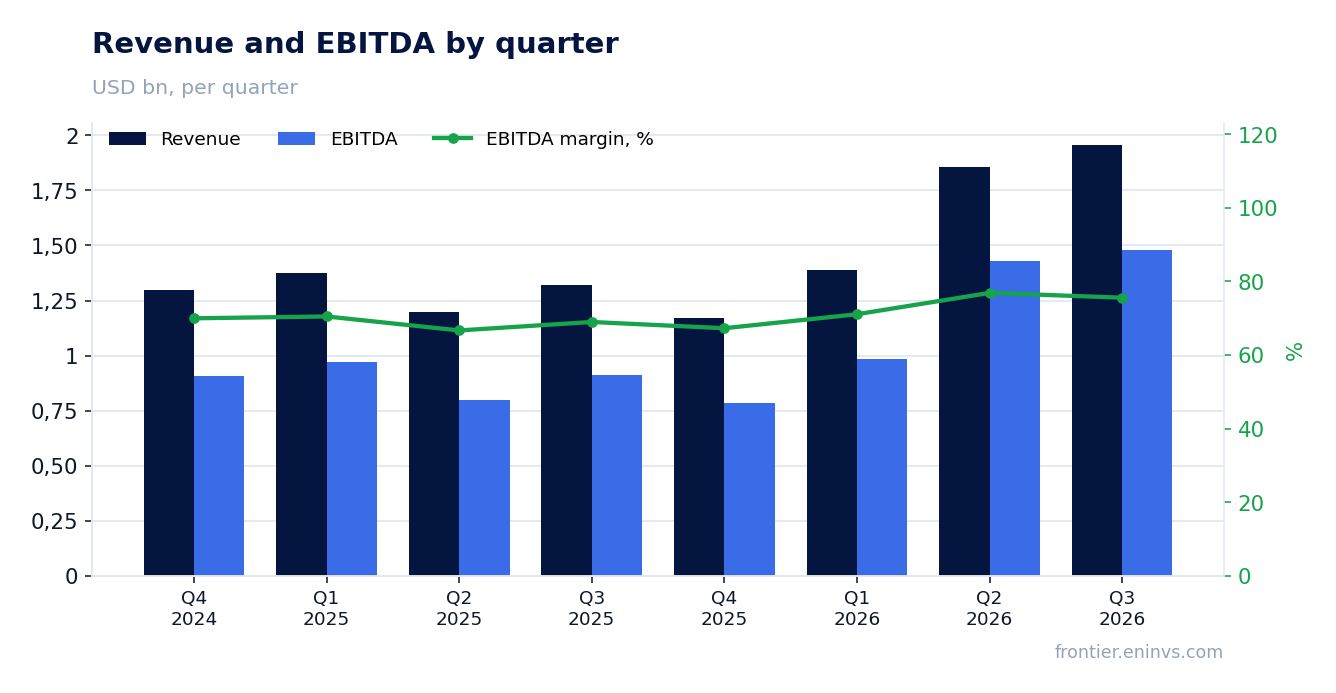
Third-quarter EBITDA reached $1,480.8 million, 62.2% above the $912.7 million of a year earlier. The margin rose to 75.6% from 69.0%. The margin gain came not from one-off items but from lower unit costs: lease operating expenses per barrel fell to $5.11 from $5.07, and total controllable cash costs hit a record $7.05 per barrel.
Gathering, processing and transportation costs fell to $1.21 per barrel from $1.43, and cash G&A to $0.73 from $0.87. The company attributes this to optimisation of power and compression and to G&A discipline. Operating profit rose to $887.8 million from $390.9 million.
The high margin holds as long as prices and unit costs hold. But it leaves little room for further cost reduction: controllable costs are already the company's historical low.
Net profit grew 7x, but a $308.6 million hedging loss never reached the cash flow
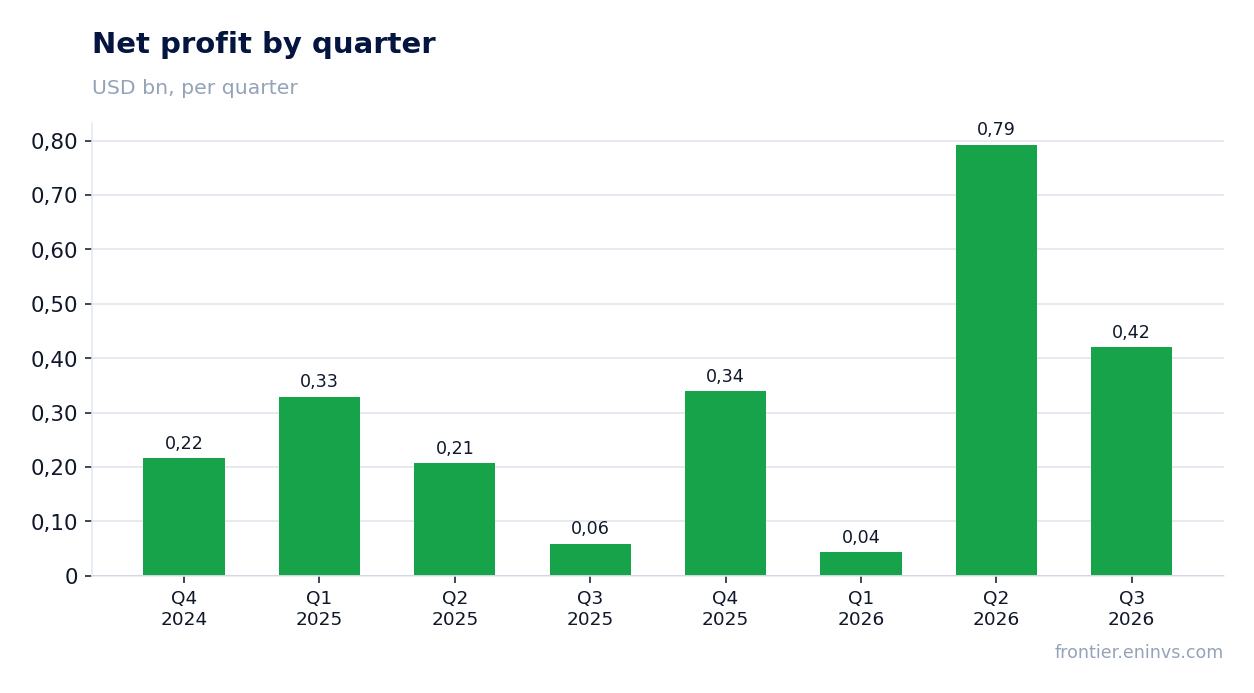
Net profit reached $420.2 million versus $59.2 million a year earlier – growth of 609.3%. The net margin rose to 21.5% from 4.5%. But the result contains a non-cash derivative loss of $308.6 million: a year earlier this line contributed a $105.7 million gain. Without it, profit would have been materially higher.
Hedges also cost the company in realised prices: including derivative settlements, oil sold at $79.96 per barrel instead of $85.73. That is minus $5.77 per barrel – the price of protection against a fall. Operating cash flow nonetheless reached $1,255.0 million, confirming the hedging loss did not eat real money.
The gap between profit and cash flow is the quarter's key feature. An investor looking only at profit sees 7x growth, but the real return is visible in free cash flow.
Free cash flow of $846 million covers the dividend with room to spare, though net debt rose to $4.4 billion
Adjusted free cash flow reached $846 million on capital expenditure of $518 million. Operating cash flow was $1,255.0 million. The company declared a quarterly dividend of $0.16 per share, or $0.64 annualised; the dividend yield at the current price is 2.8%. The payout takes only a small share of free cash flow, so there is room.
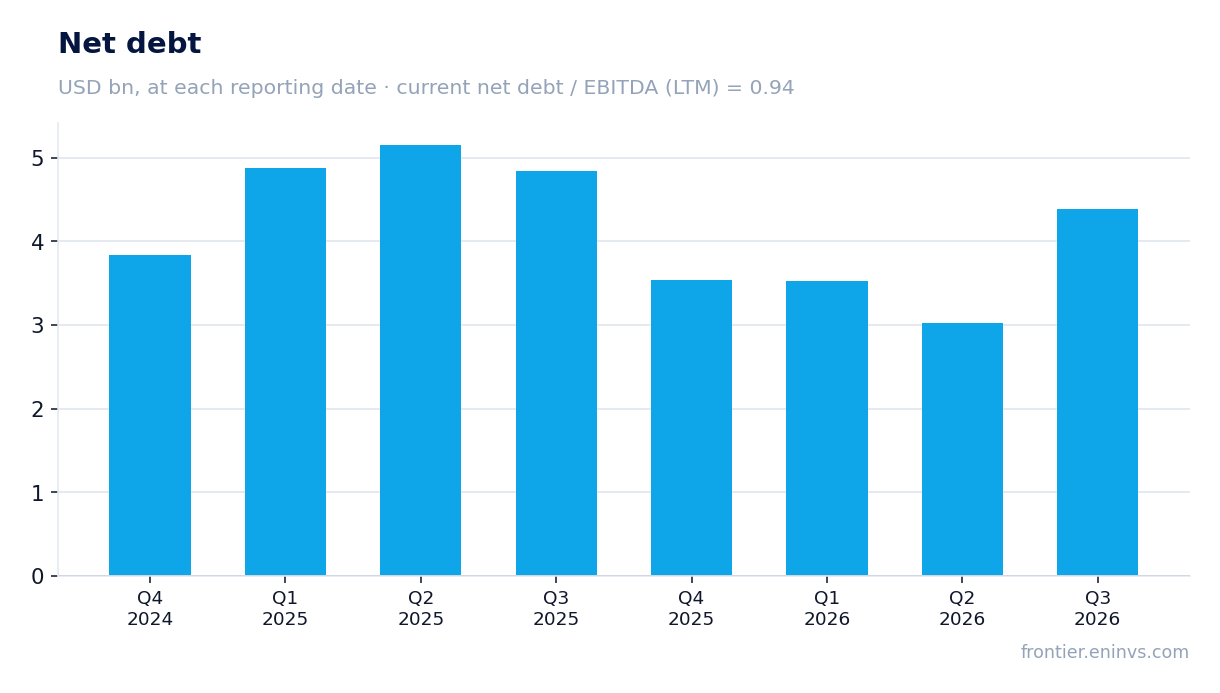
Net debt at 30 September 2026 was $4.4 billion versus $3.0 billion at 30 June 2026, an increase of $1.4 billion. Over the year net debt fell: from $4.8 billion at 30 September 2025 to $4.4 billion. Net debt to EBITDA over the last twelve months was 0.94. The company attributes the increase to the $1.025 billion Ridge Runner acquisition and about $120 million of additional deals.
Interest expense fell to $53.3 million from $69.4 million a year earlier: the company redeemed $325 million of legacy Earthstone 9.875% notes and expects annual savings of about $75 million. Net debt at 0.94 EBITDA is a moderate level, but it rose during the quarter because of deals, not operational problems.
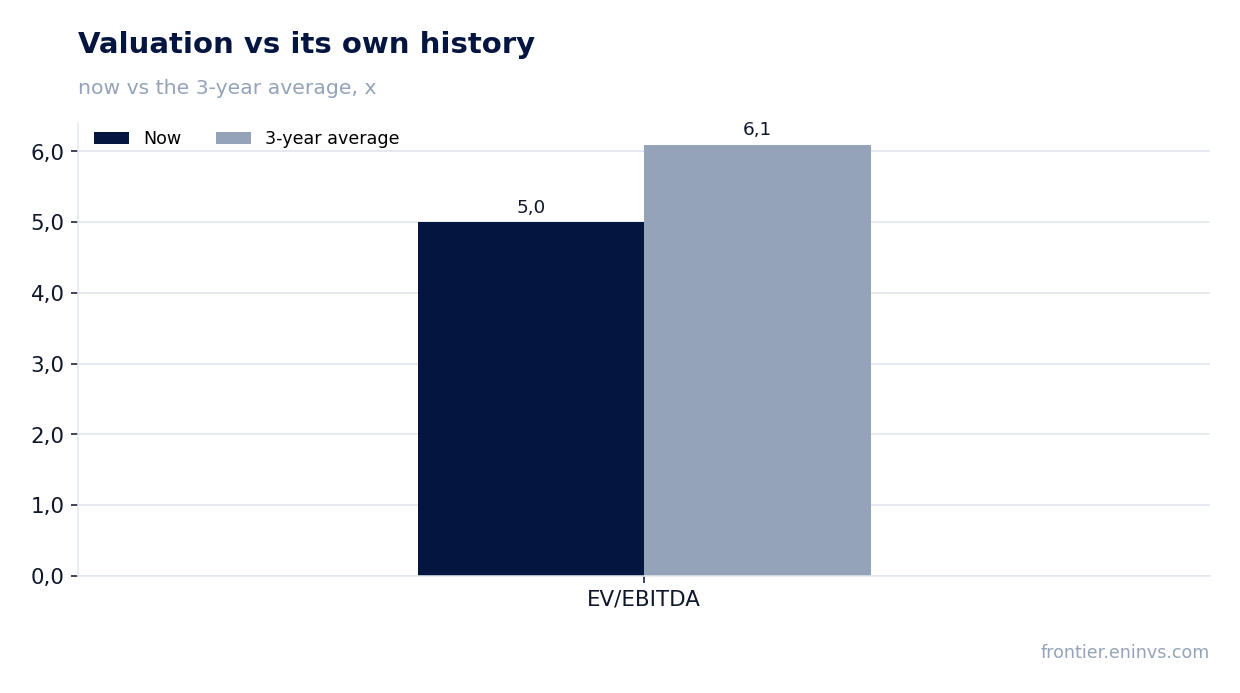
EV/EBITDA of 5.0 is below its own three-year average of 6.1 – the stock is cheaper than its own history
The trailing-twelve-month EV/EBITDA multiple is 5.0 against its own three-year average of 6.1, 18% below. On this multiple the stock is cheaper than its own history. The trailing P/E is 11.8 and return on equity is 13.8%.
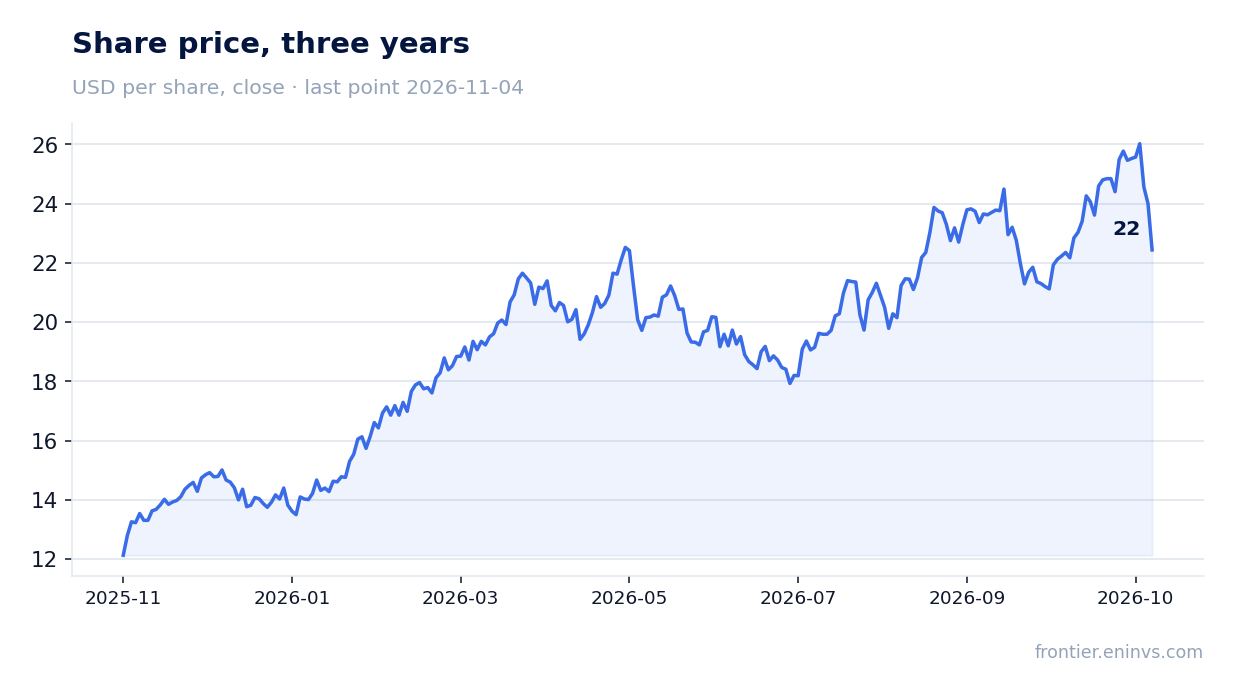
The market reacted to the report with a decline: the stock lost 6.5% on the release day and the same from the release to 4 November. The reason is likely the rise in debt and profit coming in below expectations because of hedges. But the multiple already reflects these concerns.
A dividend yield of 2.8% is modest for the oil and gas sector, but the payout is covered by free cash flow with a large margin. If oil prices hold above $70, the company can both grow output and reduce debt.
Valuation on the latest reported figures
| Metric | Value |
|---|---|
| Market cap | 18.8 bn USD |
| P/E (LTM) | 11.8 |
| EV/EBITDA (LTM) | 5.0 |
| P/B | 1.63 |
| Net debt / EBITDA (LTM) | 0.94 |
| Operating cash flow (LTM) | 4.48 bn |
| ROE | 13.8% |
| Dividend yield (12m) | 2.8% |
| EV/EBITDA, 3-year average | 6.1 |
Bottom line
The quarter was strong operationally: revenue rose 48.1%, the EBITDA margin reached 75.6%, and free cash flow was $846 million. But profit of $420.2 million looks smaller because of the $308.6 million non-cash hedging loss. Net debt rose to $4.4 billion because of the Ridge Runner acquisition, though it fell over the year from $4.8 billion. At an EV/EBITDA of 5.0 against its own three-year average of 6.1, the stock is cheaper than its own history, and the dividend is covered with room to spare. The verdict is 'rather attractive': the multiple is below its historical level and cash flow is resilient, but rising debt and dependence on oil prices cap the rating.
Open the company's financial profile PR →
See also: market overview · valuation map · stock screeners