QUANTA SERVICES, INC.: revenue up 57.4%, but the stock trades above its own history

On 29 October QUANTA SERVICES, INC. reported third-quarter 2026 results. Revenue reached $12.0 bn, up 57.4% year on year, EBITDA came to $1.3 bn (+77.1%) and net income to $694.9 mn (+104.7%). Growth accelerated from 41.1% in the second quarter, and backlog hit a record $63.7 bn. Yet the stock trades at EV/EBITDA of 26.7, above its own three-year average of 24.3, so despite the strong operating momentum the valuation looks full and the verdict is neutral.
Key takeaways
— Revenue rose 57.4% and accelerated from 41.1% in the second quarter
— EBITDA margin widened to 11.1% from 9.9% a year earlier
— Net income doubled, but part of it came from one-off items
— Free cash flow of $1.2 bn covers capital expenditure of $268 mn
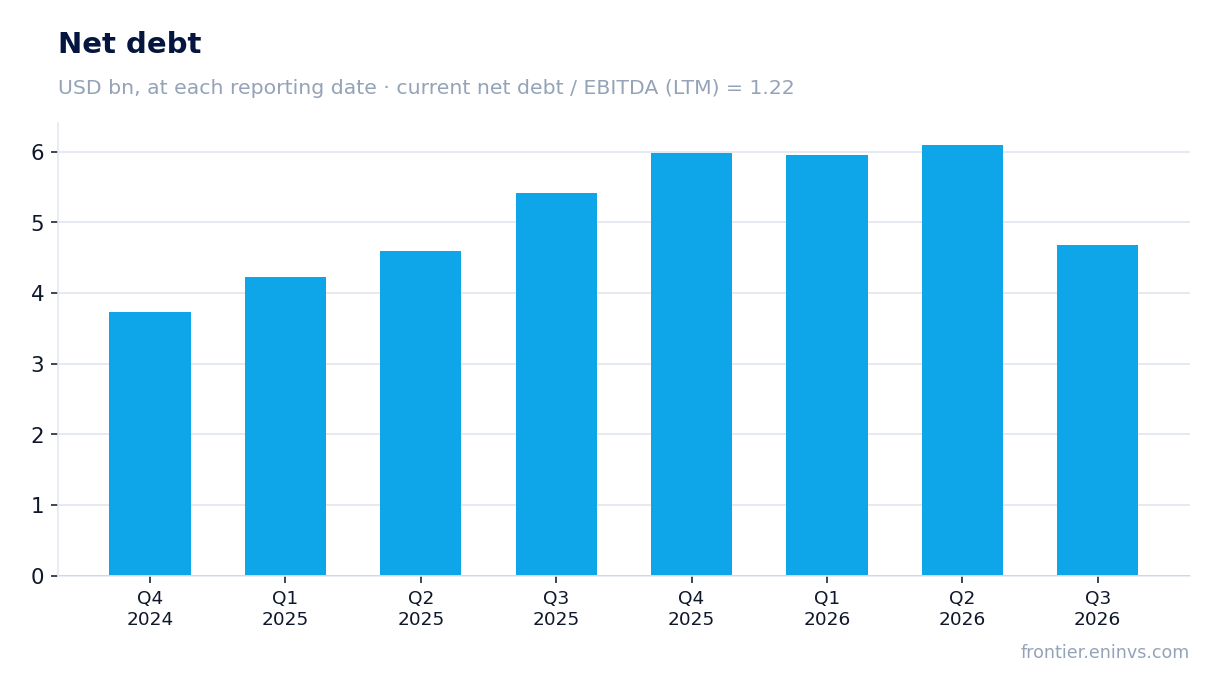
— Net debt fell to $4.7 bn from $6.1 bn at the end of June
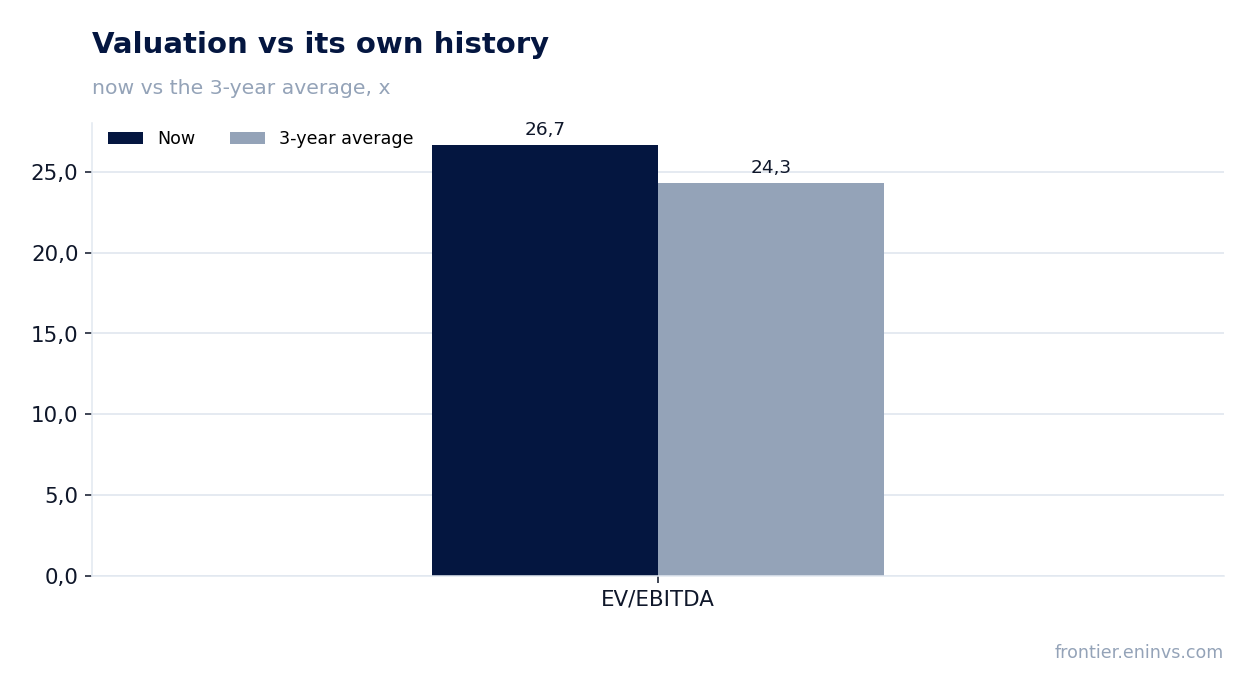
— The stock trades at EV/EBITDA of 26.7, above its three-year average of 24.3
— Full-year 2026 guidance was raised across all metrics, including revenue of $41.3–41.6 bn
Attractiveness
Key figures, USD bn
| Metric | Q3 2025 | Q3 2026 | Change |
|---|---|---|---|
| Revenue | 7.63 | 12.0 | +57.4% |
| EBITDA | 0.75 | 1.34 | +77.1% |
| Operating profit | 0.52 | 1.03 | +98.5% |
| Net profit | 0.34 | 0.69 | +104.7% |
| Operating cash flow | 0.56 | 1.45 | +158.0% |
| Capex | 0.14 | 0.27 | +88.1% |
| EBITDA margin | 9.9% | 11.1% | +1.2 pp |
| Net margin | 4.4% | 5.8% | +1.4 pp |
Revenue rose 57.4% and accelerated from 41.1% in the second quarter
Third-quarter 2026 revenue came to $12.0 bn against $7.6 bn a year earlier, a gain of 57.4%. The second quarter grew 41.1%, so momentum accelerated. The Electric segment did the heavy lifting: its revenue reached $9.8 bn, or 81.6% of the total versus 80.9% a year earlier.
Underground and Infrastructure rose to $2.2 bn from $1.5 bn, but its share of revenue slipped to 18.4% from 19.1%. That shift toward Electric means growth rests on power transmission and distribution rather than general infrastructure work.
The company completed five acquisitions in the first nine months of 2026 and eight in full-year 2025, with their results included from the respective closing dates. Two more deals closed in September and October for aggregate consideration of about $245 mn, which management does not expect to contribute materially to 2026 results.
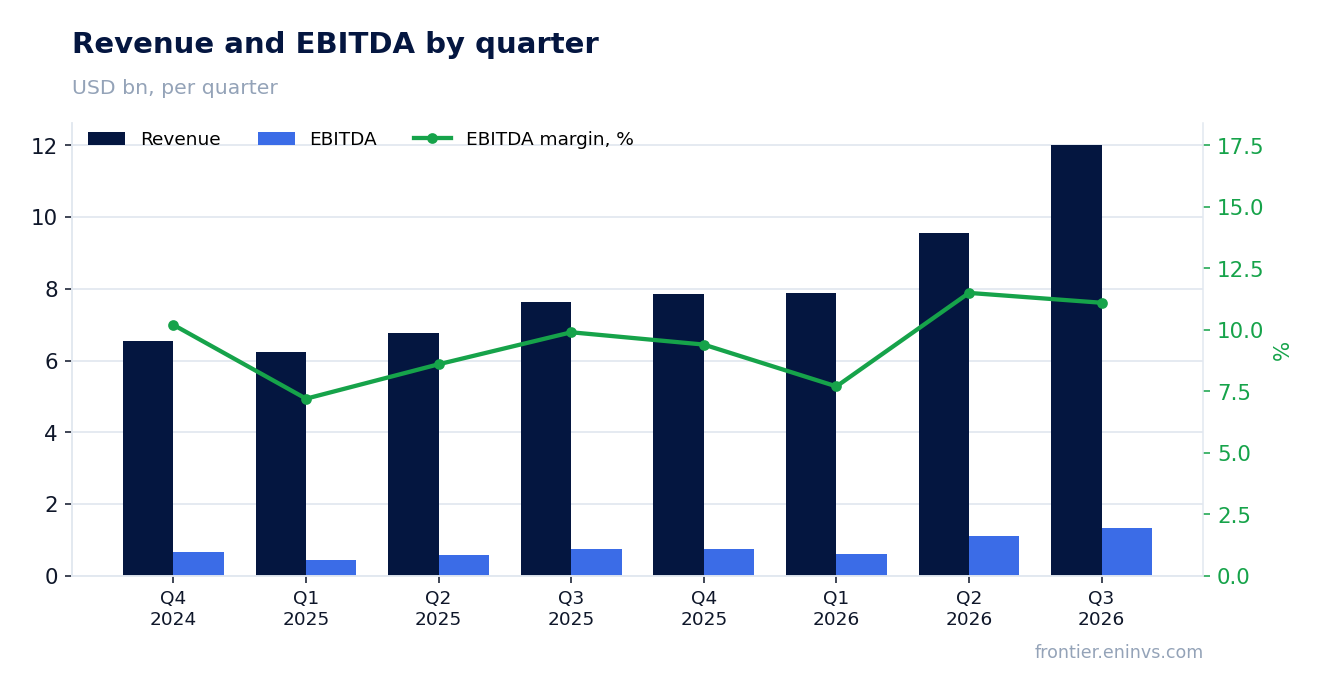
EBITDA margin widened to 11.1% from 9.9% a year earlier
Third-quarter EBITDA reached $1.3 bn, up 77.1% year on year, and its margin rose to 11.1% from 9.9%. Operating income climbed to $1.0 bn from $517.2 mn, more than doubling.
The improvement came mainly from Electric, where the operating margin was 12.6% versus 11.4% a year earlier. Underground and Infrastructure margin rose to 9.4% from 8.4%. Corporate and non-allocated costs increased to $419.5 mn from $308.8 mn, including amortisation of intangibles of $188.6 mn versus $133.2 mn.
The rise in amortisation stems from acquisitions: the company bought five businesses in the first nine months of 2026. That lifts non-cash expenses but does not affect EBITDA, so the gap between EBITDA and operating income growth narrows.
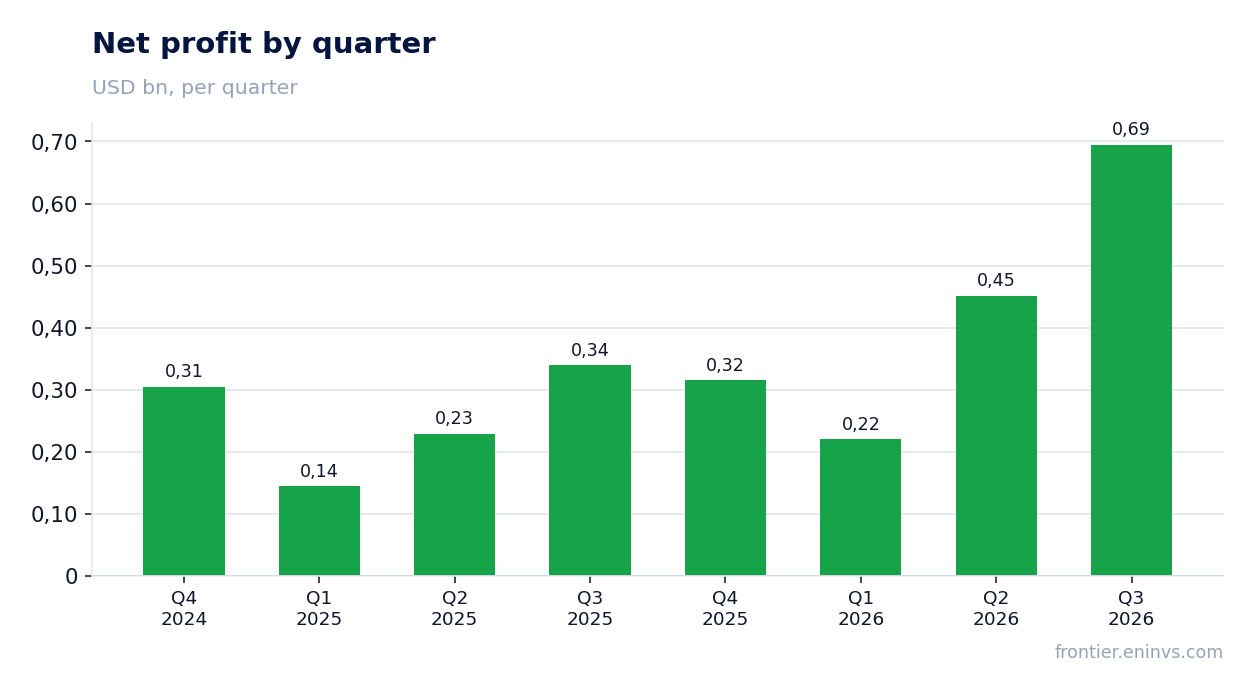
Net income doubled, but part of it came from one-off items
Net income attributable to common stock was $694.9 mn versus $339.4 mn a year earlier, up 104.7%. Diluted earnings per share came to $4.55 against $2.24. Adjusted diluted EPS was $6.06 versus $3.33.
The gap between GAAP and adjusted earnings reflects items the company excludes: acquisition and integration costs of $34.8 mn, a $19.8 mn increase in the fair value of contingent consideration, $1.4 mn of losses from non-integral unconsolidated affiliates and a $13.1 mn tax effect of adjustments.
The increase in contingent consideration fair value is a non-cash item tied to revaluing obligations on acquired businesses. It lifts operating expenses but does not reflect current operations. Adjusted EPS of $6.06 is the cleaner gauge of underlying earnings power.
Free cash flow of $1.2 bn covers capital expenditure of $268 mn
Third-quarter operating cash flow was $1.45 bn and free cash flow $1.2 bn. Capital expenditure came to $268 mn, so free cash flow covered it more than four times over.
The company raised its 2026 operating cash flow guidance to $3.45–4.00 bn and free cash flow guidance to $2.50–3.00 bn. That implies management expects the strong conversion of earnings into cash to continue in the second half.
The cash flow funds both acquisitions and shareholder returns. In the first nine months of 2026 the company closed five deals, and in September–October two more for $245 mn, of which $96 mn was paid in cash. Free cash flow covers these outlays without adding debt.
Net debt fell to $4.7 bn from $6.1 bn at the end of June
Net debt at 30 September 2026 was $4.7 bn versus $6.1 bn at 30 June 2026, a reduction of $1.4 bn. A year earlier, at 30 September 2025, it stood at $5.4 bn, so it fell by $0.7 bn over twelve months.
The net debt to EBITDA ratio for the trailing twelve months is 1.22. That is a moderate level for a company with capital-intensive projects. In August 2026 the company issued $2.0 bn of senior notes and in September prepaid $618.8 mn of its term loan, improving the debt structure.
Interest expense rose to $84.0 mn from $71.8 mn a year earlier, but interest income also increased to $9.7 mn from $3.7 mn. The August debt issuance was partly offset by strong operating cash flow, which allowed net debt to fall over the quarter.
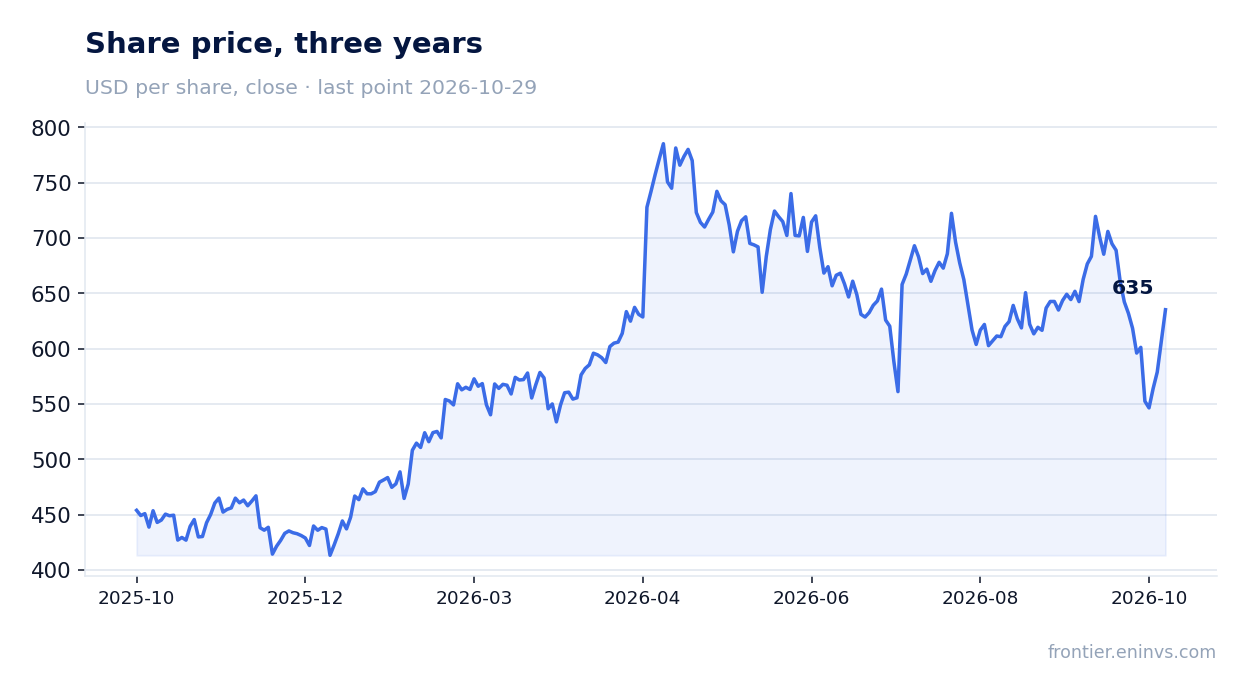
The stock trades at EV/EBITDA of 26.7, above its three-year average of 24.3
EV/EBITDA for the trailing twelve months is 26.7, 10% above the three-year average of 24.3. P/E on the same basis is 57.1. The stock trades above its own history on this multiple, reflecting the strong growth expectations embedded in the price.
Market capitalisation is $96.1 bn and net debt $4.7 bn. On the portal's model, fair value implies upside of +33%, but that is our own estimate, not a market consensus.
Dividend yield over the trailing twelve months is 0.07%, very low for a company with such cash flow. The company prefers to direct funds into acquisitions and organic growth rather than shareholder payouts. At the current valuation the dividend is not an argument in favour of the stock.
Full-year 2026 guidance was raised across all metrics, including revenue of $41.3–41.6 bn
The company raised its 2026 guidance: revenue is expected at $41.3–41.6 bn, EBITDA at $3.99–4.09 bn, adjusted EBITDA at $4.40–4.49 bn, net income at $1.92–1.98 bn, diluted EPS at $12.57–12.97 and adjusted EPS at $17.90–18.30.
Backlog reached a record $63.7 bn, of which $41.8 bn is remaining performance obligations. That provides revenue visibility for several quarters ahead and underpins management's confidence in growth into 2027.
CEO Duke Austin said the company is pacing ahead of the multi-year targets outlined at its 2026 Investor Day and expects double-digit adjusted EPS growth in 2027. The outlook is sensitive, however, to weather, regulatory and supply-chain factors that the company itself cites as risks.
Valuation on the latest reported figures
| Metric | Value |
|---|---|
| Market cap | 96.1 bn USD |
| P/E (LTM) | 57.1 |
| EV/EBITDA (LTM) | 26.7 |
| P/B | 10.75 |
| Net debt / EBITDA (LTM) | 1.22 |
| Operating cash flow (LTM) | 4.07 bn |
| ROE | 27.6% |
| Dividend yield (12m) | 0.1% |
| EV/EBITDA, 3-year average | 24.3 |
Bottom line
The quarter was strong across all operating metrics: revenue rose 57.4% with acceleration, EBITDA margin widened to 11.1% and free cash flow reached $1.2 bn. Net income doubled, but part of it came from one-off items, and adjusted EPS of $6.06 is the more durable gauge. Net debt fell to $4.7 bn and the net debt to EBITDA ratio is 1.22. The key question for a holder is valuation: the stock trades at EV/EBITDA of 26.7 against its own three-year average of 24.3, and at that multiple further gains must be confirmed by delivery on guidance. The verdict is neutral: operating momentum is excellent, but the price already reflects a lot.
Open the company's financial profile PWR →
See also: market overview · valuation map · stock screeners