QUALCOMM INC/DE: revenue falls for a fourth straight quarter while profit leans on one-off tax items

On 4 November QUALCOMM INC/DE reported results for the fourth quarter of fiscal 2026. Revenue came in at USD 10.32 bn, down 8.4% year on year, operating profit at USD 1.36 bn and net profit at USD 1.25 bn with a 12.1% net margin versus a loss a year earlier. Over the trailing twelve months revenue was USD 43.1 bn and net profit USD 13.6 bn, but the latter includes a USD 5.7 bn one-off tax benefit, while EV/EBITDA of 18.8 sits above the company's own three-year average of 16.3. The share looks rather unattractive at the current price: the revenue decline is deepening and the multiple is above its own history.
Key takeaways
— Revenue has fallen for four consecutive quarters, and the decline is deepening: from -4.0% in Q3 to -8.4% in Q4
— Half of the annual profit came from a one-off USD 5.7 bn tax benefit, not from operations
— Handsets dragged QCT down 26%, while automotive grew 89% and delivered its first USD 2 bn quarter
— QCT margin fell to 24% from 29% as rising component costs ate into segment profit
— Net debt rose from USD 5.0 bn on 28 June to USD 15.1 bn on 27 September, with net debt/EBITDA LTM at 1.47
— The 2.1% dividend yield is below the risk-free rate, with USD 3.85 bn paid out over the year
— EV/EBITDA of 18.8 is 15% above the company's own three-year average of 16.3, and the portal model implies -48% to fair value
Attractiveness
Key figures, USD bn
| Metric | Q3 2025 | Q3 2026 | Change |
|---|---|---|---|
| Revenue | 11.3 | 10.3 | -8.4% |
| EBITDA | 3.29 | — | — |
| Operating profit | 2.92 | 1.36 | -53.5% |
| Net profit | -3.12 | 1.25 | to profit |
| Operating cash flow | 4.00 | — | — |
| Capex | 0.41 | — | — |
| EBITDA margin | 29.2% | — | — |
| Net margin | -27.7% | 12.1% | +39.8 pp |
Revenue has fallen for four consecutive quarters, and the decline is deepening: from -4.0% in Q3 to -8.4% in Q4
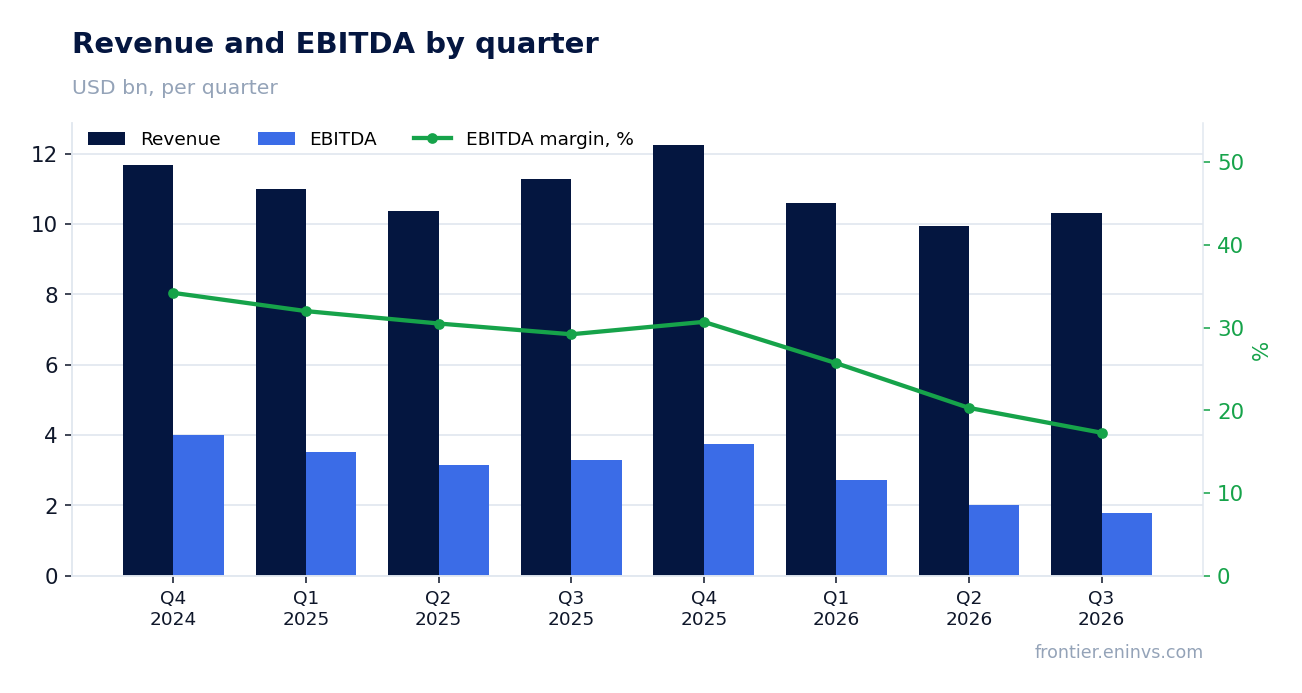
Revenue for the fourth quarter of fiscal 2026 was USD 10.32 bn, down 8.4% year on year. This is the fourth consecutive quarter of decline: the drop was 4.0% in Q3 and 3.5% in Q2. The deceleration is accelerating, and that is the main signal from the report.
The main blow came from handsets: QCT revenue from them fell 26% to USD 5.14 bn. Automotive grew 89% to USD 1.99 bn, exceeding USD 2 bn for the first time in a quarter, while IoT added 4% to USD 1.89 bn. But these two segments were not enough to offset the handset decline.
The QTL licensing business shrank 7% to USD 1.30 bn, and its profit before tax fell 10% to USD 918 m. Full-year revenue was USD 43.1 bn, down 3% year on year. The company is pinning its hopes on non-handset areas: in fiscal 2027 they are projected to grow more than 60%, and data centre revenue is targeted at USD 5 bn.
Half of the annual profit came from a one-off USD 5.7 bn tax benefit, not from operations
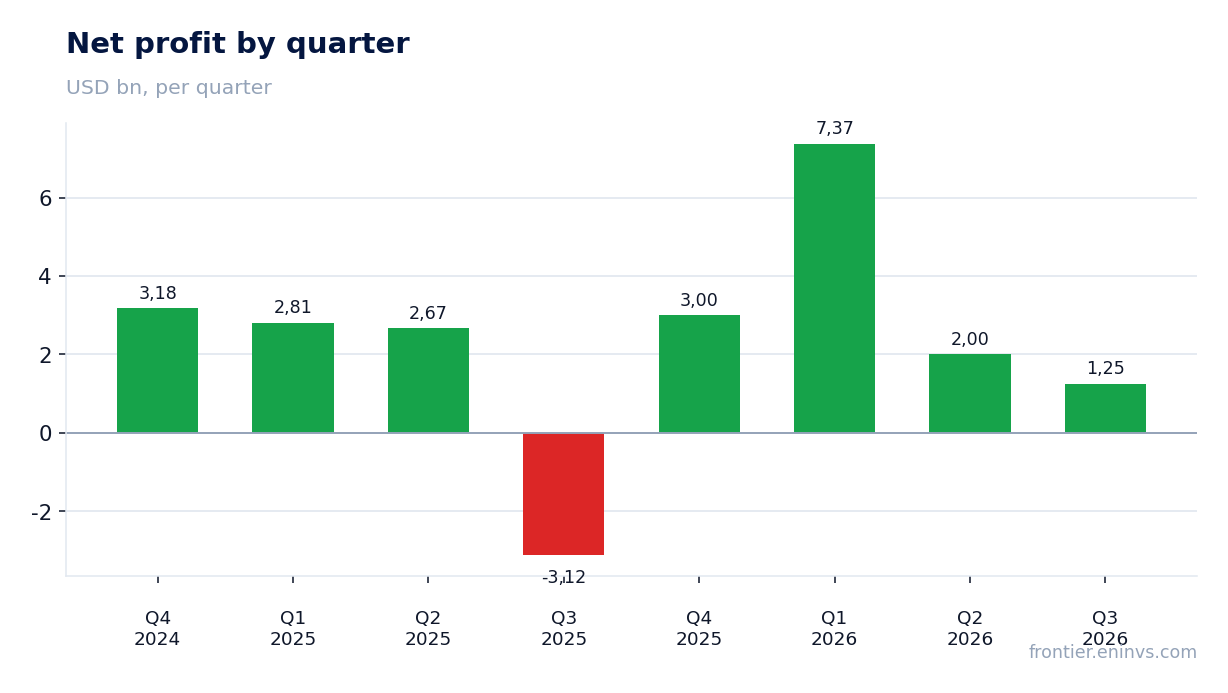
Net profit for the fourth quarter was USD 1.25 bn versus a loss of USD 3.12 bn a year earlier. The net margin was 12.1% against -27.7% a year earlier. But the year-on-year comparison is distorted: in Q4 fiscal 2025 the company recorded a USD 6.09 bn tax expense by creating a valuation allowance.
For the full fiscal 2026 year net profit was USD 13.63 bn, of which USD 5.7 bn came from the release of that allowance. Without it, profit would have been around USD 7.9 bn. Operating profit for the year was USD 8.66 bn, down 30% year on year. The gap between operating and net profit is explained precisely by the tax item.
Operating profit for the fourth quarter was USD 1.36 bn versus USD 2.92 bn a year earlier, a 54% decline. The operating margin fell to 13.1% from 25.9%. This is an operating, not a tax, result, and it shows the real pressure on the business.
Handsets dragged QCT down 26%, while automotive grew 89% and delivered its first USD 2 bn quarter
QCT revenue in the fourth quarter was USD 9.02 bn, down 8% year on year. Within the segment, handsets fell 26% to USD 5.14 bn, automotive grew 89% to USD 1.99 bn, and IoT added 4% to USD 1.89 bn. For the full year, automotive grew 52% to USD 6.0 bn.
QCT profit before tax fell 26% to USD 2.14 bn, and its share of revenue dropped to 24% from 29%. The company explicitly cites broad-based increases in chip input costs – wafers, assembly, testing, memory – and says the benefit of its pricing actions will only show in QCT gross margins in the second half of fiscal 2027.
So the automotive and IoT businesses are growing, but they cannot yet offset the handset decline in either revenue or profit. Data centres, which the company is betting on, are not broken out separately in the reporting, but the USD 5 bn revenue target for fiscal 2027 is reiterated.
QCT margin fell to 24% from 29% as rising component costs ate into segment profit
QCT's profit-before-tax margin fell to 24% from 29% a year earlier. On revenue of USD 9.02 bn, segment profit was USD 2.14 bn. A 5 percentage point decline on an 8% revenue drop means costs are rising faster than revenue.
The company attributes this to higher costs across all components, from wafers to memory and packaging. Its pricing actions, it says, will only start to affect QCT gross margin in the second half of fiscal 2027. Until then, margin pressure will persist.
In the QTL licensing segment the margin remains high at 70% versus 72% a year earlier, but it too is down 2 percentage points. The company's overall operating margin fell to 13.1% from 25.9%, the lowest level in recent quarters.
Net debt rose from USD 5.0 bn on 28 June to USD 15.1 bn on 27 September, with net debt/EBITDA LTM at 1.47
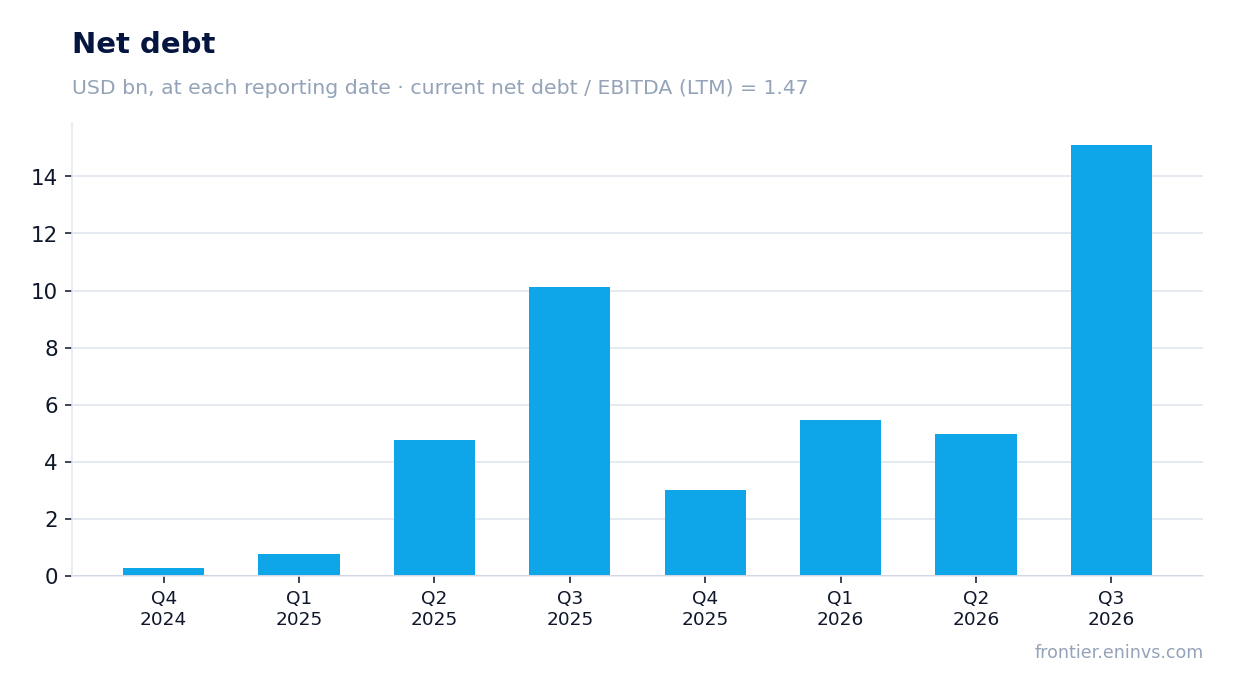
Net debt as of 27 September 2026 was USD 15.1 bn versus USD 5.0 bn on 28 June, an increase of USD 10.1 bn over the quarter. A year earlier, on 28 September 2025, net debt was USD 10.1 bn, so over twelve months it rose by USD 5.0 bn.
The ratio of net debt to trailing-twelve-month EBITDA is 1.47. That is a moderate level, but it has risen along with the debt. Short-term debt on the balance sheet is USD 2.49 bn and long-term debt USD 12.62 bn. Cash and equivalents are USD 4.64 bn and marketable securities USD 3.05 bn.
Operating cash flow over the trailing twelve months was USD 11.15 bn, down from USD 14.01 bn a year earlier. The company spent USD 2.49 bn on capex, USD 7.82 bn on buybacks and USD 3.85 bn on dividends. Total shareholder returns were USD 11.67 bn, exceeding operating cash flow.
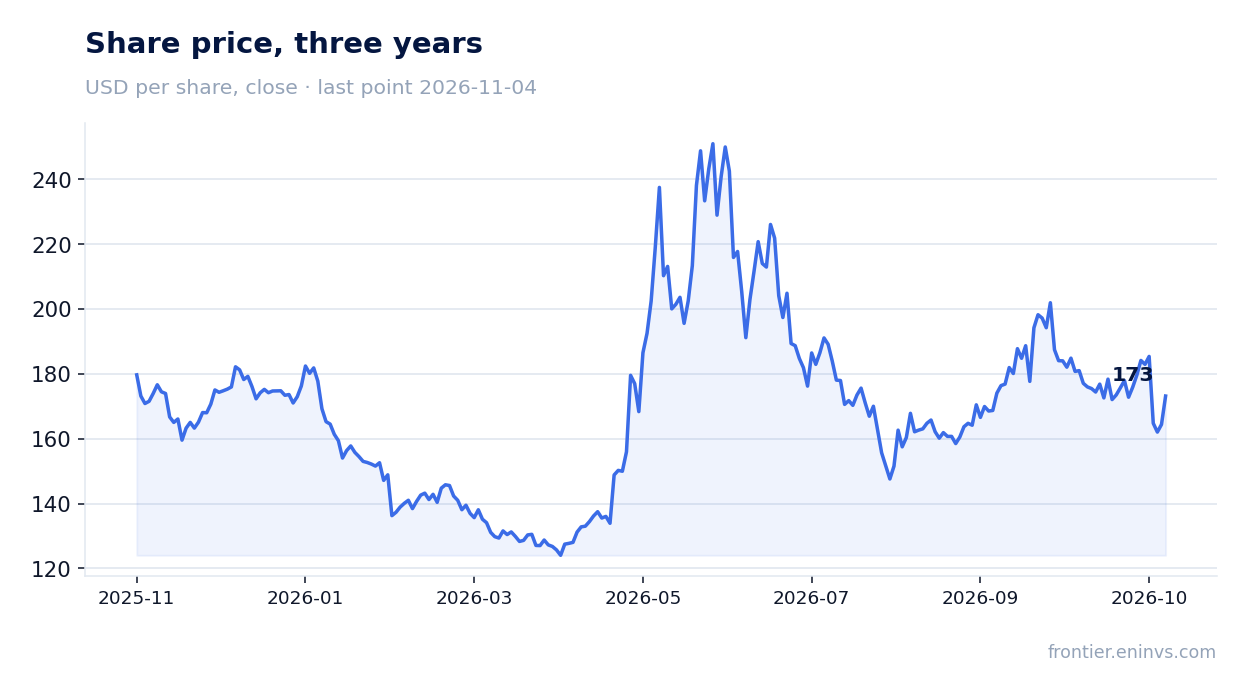
The 2.1% dividend yield is below the risk-free rate, with USD 3.85 bn paid out over the year
For fiscal 2026 the company paid USD 3.85 bn in dividends, or USD 3.62 per share. The latest quarterly dividend was USD 0.92 per share. The trailing-twelve-month dividend yield is 2.1%.
Our estimate for the fiscal 2027 dividend is around USD 3.7–3.8 per share, assuming the current quarterly payout is maintained. It rests on profit adjusted for the one-off tax benefit: excluding it, fiscal 2026 profit was about USD 7.9 bn, and the USD 3.85 bn payout is roughly half of that. That is a sustainable level, but it is sensitive to a further decline in revenue.
A 2.1% yield is below the yield on risk-free instruments and does not offer the investor a meaningful risk premium. A cut is possible if profit falls further, especially if the operating margin continues to decline.
EV/EBITDA of 18.8 is 15% above the company's own three-year average of 16.3, and the portal model implies -48% to fair value
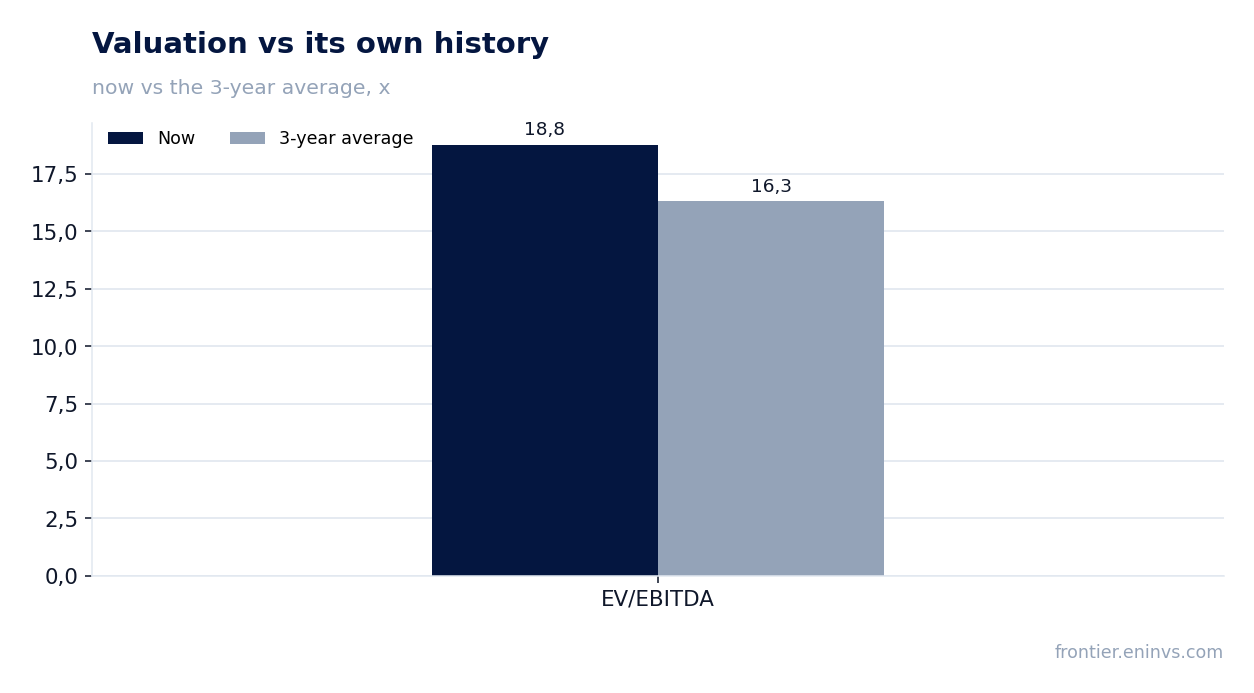
EV/EBITDA over the trailing twelve months is 18.8, 15% above the company's own three-year average of 16.3. The share is more expensive than its own history on this multiple. The trailing P/E is 13.3, but it is distorted by the one-off tax benefit: excluding it, profit would be about USD 7.9 bn and the P/E around 23.
The portal model, which compares EBITDA growth with the target multiple, implies -48% to fair value. This is our own estimate, not a market consensus. It reflects the combination of falling revenue, margin compression and a multiple above its historical level.
Return on equity is 16.5%, which is decent, but it too is supported by the one-off tax benefit. A 2.1% dividend yield does not compensate for the risk of falling profit. At the current price the share looks expensive relative to its own history and fundamentals.
Valuation on the latest reported figures
| Metric | Value |
|---|---|
| Market cap | 182 bn USD |
| P/E (LTM) | 13.3 |
| EV/EBITDA (LTM) | 18.8 |
| P/B | 5.98 |
| Net debt / EBITDA (LTM) | 1.47 |
| Operating cash flow (LTM) | 11.1 bn |
| ROE | 16.5% |
| Dividend yield (12m) | 2.1% |
| EV/EBITDA, 3-year average | 16.3 |
Bottom line
The strong point of the report remains the automotive business, up 89% and reaching USD 2 bn in a quarter for the first time, along with the reiterated USD 5 bn data centre revenue target. But the overall picture is weak: revenue has fallen for four consecutive quarters, the decline is deepening to 8.4%, the operating margin has compressed to 13.1%, and half of the annual profit is a one-off tax benefit. Net debt has risen to USD 15.1 bn, and EV/EBITDA of 18.8 is above the company's own three-year average. The share looks rather unattractive at the current price; a change in the verdict would require stabilisation in handset revenue and a recovery in QCT margin.
Open the company's financial profile QCOM →
See also: market overview · valuation map · stock screeners