RAMBUS INC: record revenue and a 39.7% EBITDA margin rest on product sales, not royalties

On 26 October RAMBUS INC reported third-quarter 2026 results: revenue of $218.3 million, EBITDA of $86.7 million, net profit of $74.6 million. Year on year revenue rose 22.3%, EBITDA 30.8% and net profit 54.1%, and the top-line growth rate accelerated from 20.4% in the second quarter. With EV/EBITDA at 32.5 against its own three-year average of 37.0 and the portal model's upside at +15%, the share looks rather attractive, though the main risk is how much of the record rests on the product segment.
Key takeaways
— Revenue rose 22.3% year on year, and the acceleration came from the product segment's record $114.3 million
— The EBITDA margin rose to 39.7% from 37.1% a year earlier, and it did so while operating expenses grew 10.9%
— Net profit rose 54.1% largely because the tax charge fell to $15.97 million from $20.9 million a year earlier
— Operating cash flow reached a record $102.5 million while capital expenditure stayed modest at $6.6 million
— The company bought back $135.4 million of stock, which cut the cash cushion to $776.9 million
— Fourth-quarter guidance promises revenue of $227–233 million and product revenue of $127–133 million
— EV/EBITDA of 32.5 is below its own three-year average of 37.0, and on the portal's model the share is 15% undervalued
Attractiveness
Key figures, USD bn
| Metric | Q3 2025 | Q3 2026 | Change |
|---|---|---|---|
| Revenue | 0.18 | 0.22 | +22.3% |
| EBITDA | 0.07 | 0.09 | +30.8% |
| Operating profit | 0.06 | 0.08 | +32.2% |
| Net profit | 0.05 | 0.07 | +54.1% |
| Operating cash flow | 0.09 | 0.10 | +15.9% |
| Capex | 0.01 | 0.01 | +11.0% |
| EBITDA margin | 37.1% | 39.7% | +2.6 pp |
| Net margin | 27.1% | 34.2% | +7.1 pp |
Revenue rose 22.3% year on year, and the acceleration came from the product segment's record $114.3 million
Third-quarter 2026 revenue came to $218.3 million against $178.5 million a year earlier, a rise of 22.3%. Against the second quarter the rate accelerated from 20.4%. The company itself calls the quarter a record and notes that the result exceeded its own guidance range of $210–216 million.
The revenue mix explains the growth. Product revenue reached $114.3 million – up 22% year on year and up 15% on the prior quarter. Royalties brought in $77.0 million and contract and other revenue $27.0 million. It was product, not licensing, that drove the acceleration.
In his commentary CEO Luc Seraphin ties demand to the requirements of AI and data-centre systems and speaks of accelerating demand for differentiated solutions. That explains why the product segment is outgrowing royalties, but it also makes revenue more sensitive to chip supply contracts.
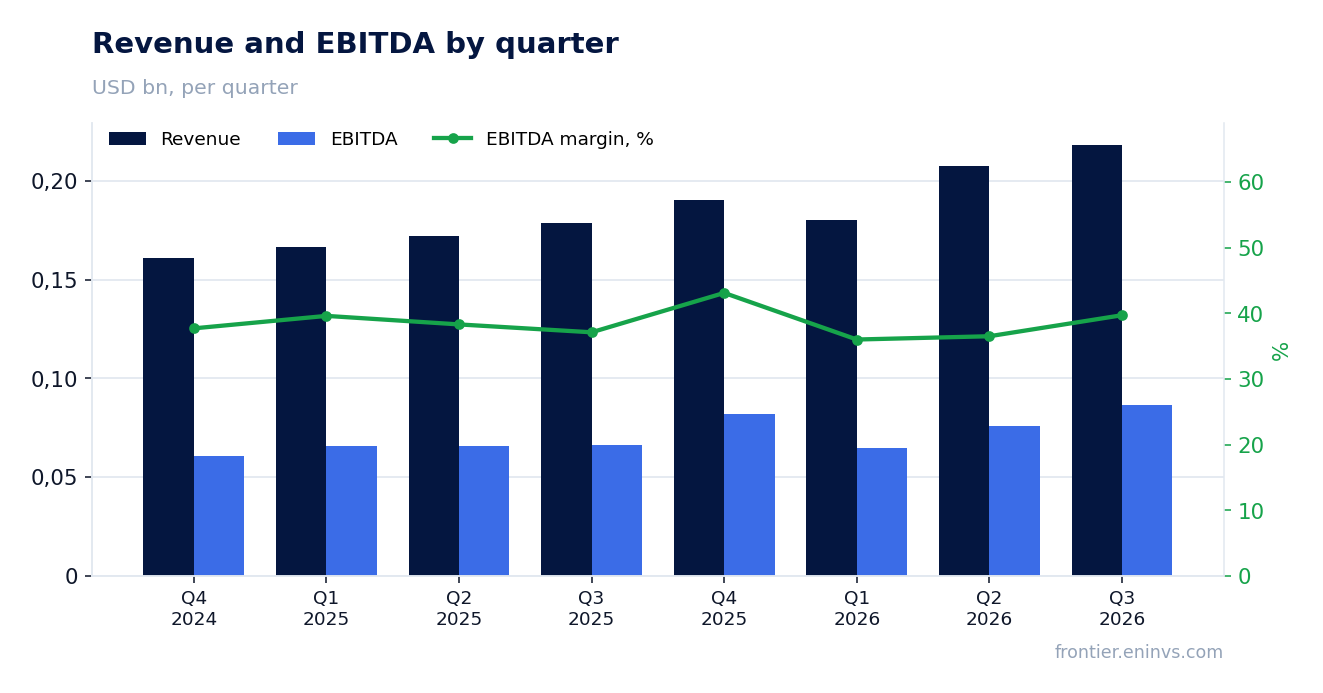
The EBITDA margin rose to 39.7% from 37.1% a year earlier, and it did so while operating expenses grew 10.9%
Quarterly EBITDA came to $86.7 million, up 30.8% year on year, faster than revenue. The margin rose to 39.7% from 37.1% a year earlier. Operating profit reached $83.7 million at a 38% margin against 35%.
Costs grew more slowly than revenue. Operating expenses rose to $87.3 million from $78.7 million, or 10.9%. Within them research spending was almost flat at $49.4 million against $49.5 million, while sales, general and administrative costs rose to $37.7 million from $29.2 million. It was the administrative line, not development, that drove the cost increase.
The margin was also helped by gross profit growing faster than revenue: $170.9 million against $141.9 million. Cost of product revenue rose to $45.5 million from $34.3 million, but its growth lagged that of product revenue.
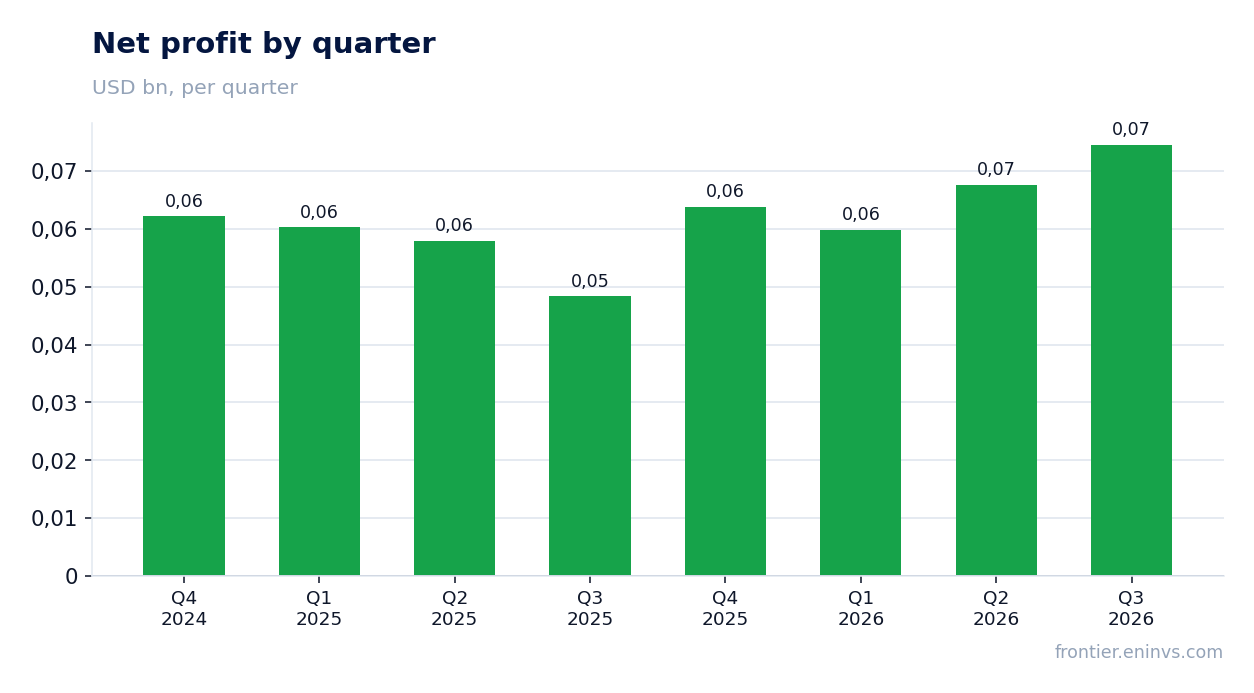
Net profit rose 54.1% largely because the tax charge fell to $15.97 million from $20.9 million a year earlier
Quarterly net profit came to $74.6 million against $48.4 million a year earlier, up 54.1%. The net margin rose to 34.2% from 27.1%. Diluted earnings per share were $0.69 on a GAAP basis and $0.84 on a non-GAAP basis.
Part of the gain came not from operations but from tax. The income tax charge fell to $15.97 million from $20.9 million a year earlier even as pre-tax profit rose to $90.5 million from $69.3 million. The effective rate dropped, and that added more to profit than the same revenue growth would have at the old rate.
There are one-off items in the profit as well. The report shows restructuring charges of $0.2 million and facility closure costs of $0.08 million, plus amortisation of acquired intangibles of $1.2 million. They are excluded from non-GAAP profit but are present in the GAAP result.
Operating cash flow reached a record $102.5 million while capital expenditure stayed modest at $6.6 million
Quarterly operating cash flow came to $102.5 million, which the company calls a record. With capital expenditure of $6.6 million, free flow before buybacks was close to $96 million. Over the trailing twelve months operating cash flow was $263.5 million on revenue of $796.1 million.
The money went mainly into buybacks. The company spent $135.4 million repurchasing stock, which cut the cash cushion – cash, cash equivalents and marketable securities – to $776.9 million, $48.0 million less than at the end of June. The $11.2 million of capital expenditure mentioned in the report covers nine months, not the quarter.
Inventories rose to $87.2 million from $44.1 million at the end of 2025. That may reflect preparation for higher shipments in the fourth quarter, but it also ties up working capital and makes quarterly cash flow sensitive to how quickly inventories turn into revenue.
The company bought back $135.4 million of stock, which cut the cash cushion to $776.9 million
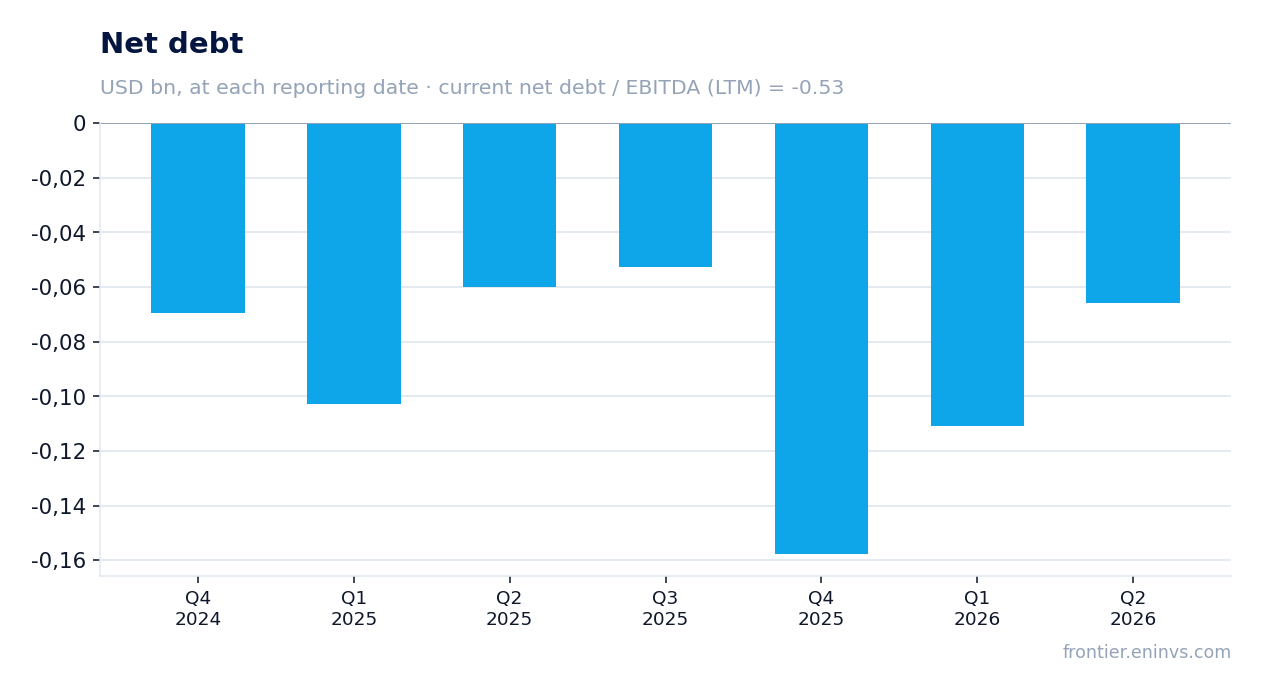
The $135.4 million buyback was the quarter's largest outlay, bigger than the entire net profit. It was funded from operating cash flow and the accumulated cushion rather than debt: net debt at the end of 2025 was negative at minus $157.8 million, meaning cash exceeded liabilities.
The ratio of net debt to trailing-twelve-month EBITDA is minus 0.53. That is a level, not a trend: the data do not allow comparison with a prior value. What matters is that the company is returning capital to shareholders without adding borrowings.
Interest on debt is negligible: the quarterly interest charge was $0.28 million, while interest and other income brought in $7.2 million. The net financial position adds to profit rather than subtracting from it.
Fourth-quarter guidance promises revenue of $227–233 million and product revenue of $127–133 million
Guidance for the fourth quarter of 2026 is revenue of $227–233 million, above the third-quarter result. Product revenue is expected at $127–133 million, royalties at $68–74 million and contract and other revenue at $26–32 million. The company is thus assuming continued product growth.
On earnings, guidance gives diluted earnings per share of $0.68–0.76 on a GAAP basis and $0.84–0.92 on a non-GAAP basis. Operating costs are expected at $143–139 million on a GAAP basis and $124–120 million on a non-GAAP basis. The company itself notes that hitting the range requires new supply and licensing contracts.
Interest and other income is guided at $6.5 million, with a tax rate of 17.5% on a GAAP basis and 16% on a non-GAAP basis. That means part of the third quarter's tax benefit may not repeat in the fourth.
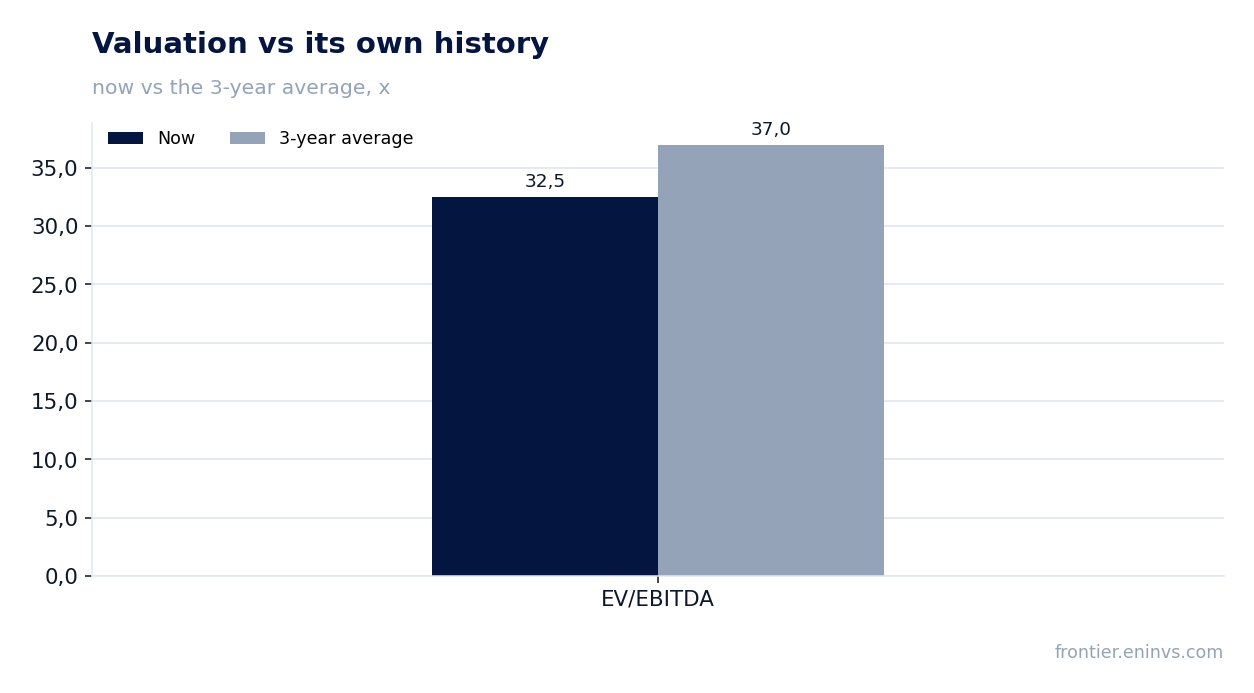
EV/EBITDA of 32.5 is below its own three-year average of 37.0, and on the portal's model the share is 15% undervalued
The trailing-twelve-month EV/EBITDA multiple is 32.5 against its own three-year average of 37.0, or 12% below. On this multiple the share is cheaper than it has been on average over three years. The trailing P/E is 37.1.
On the portal's model the upside to fair value is +15%. That is our own estimate, built on EBITDA growth and a target multiple, not a market consensus. Market capitalisation is $9.87 billion.
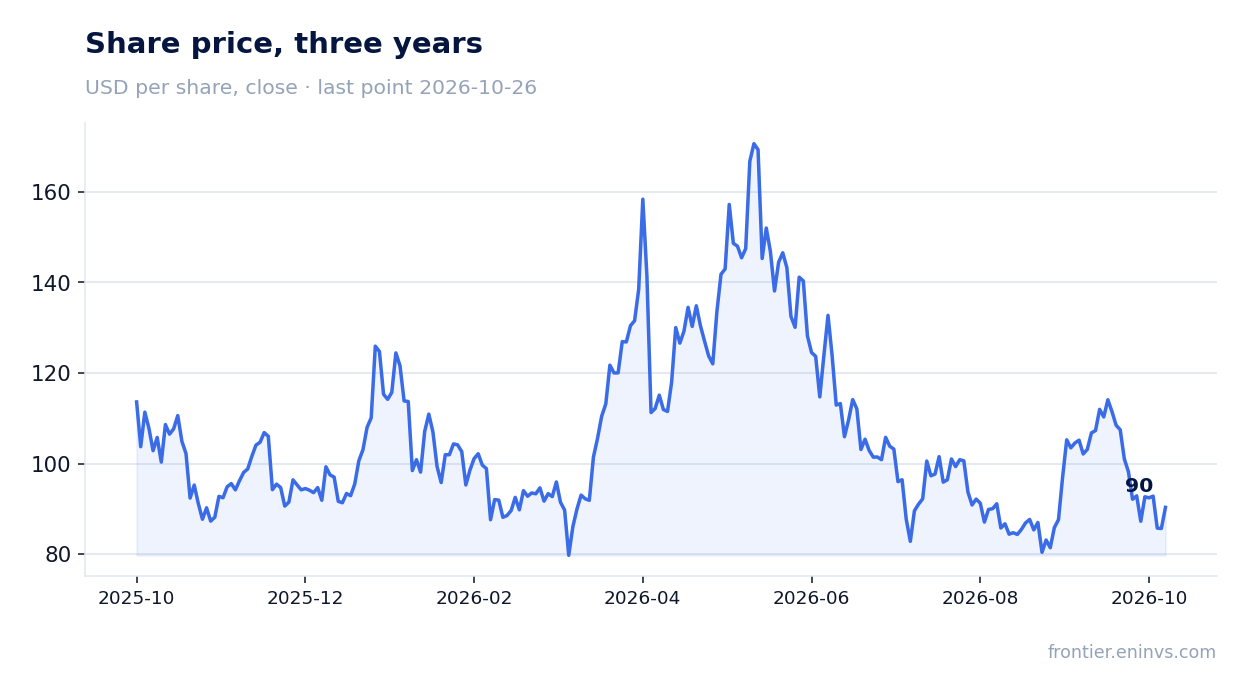
The market reaction was restrained: the share added 5.5% on the release day and the same from the release to 26 October. The price before the release was $85.65. The share is held in the portal's live model strategy 'US AI infrastructure'; that is a fact of membership, not an argument for the valuation.
Valuation on the latest reported figures
| Metric | Value |
|---|---|
| Market cap | 9.87 bn USD |
| P/E (LTM) | 37.1 |
| EV/EBITDA (LTM) | 32.5 |
| P/B | 7.23 |
| Net debt / EBITDA (LTM) | -0.53 |
| Operating cash flow (LTM) | 0.26 bn |
| ROE | 6.9% |
| EV/EBITDA, 3-year average | 37.0 |
Bottom line
The quarter's strength was not only record revenue of $218.3 million but the fact that product drove it, with the margin rising to 39.7% on moderate cost growth. Operating cash flow of $102.5 million and modest capital expenditure of $6.6 million confirm that profit turns into cash. The weak spot is the tax rate: without its decline the 54.1% net profit gain would have been smaller, and for the fourth quarter the company assumes a higher rate. With EV/EBITDA at 32.5 against its own three-year average of 37.0 and +15% upside on the portal's model, the share looks rather attractive; the verdict would change on a miss in product guidance or a return of the multiple to its historical average without earnings growth.
Open the company's financial profile RMBS →
See also: market overview · valuation map · stock screeners