Range Resources: profit up 21.5% while revenue added just 4.8% – the gain comes from costs, not prices
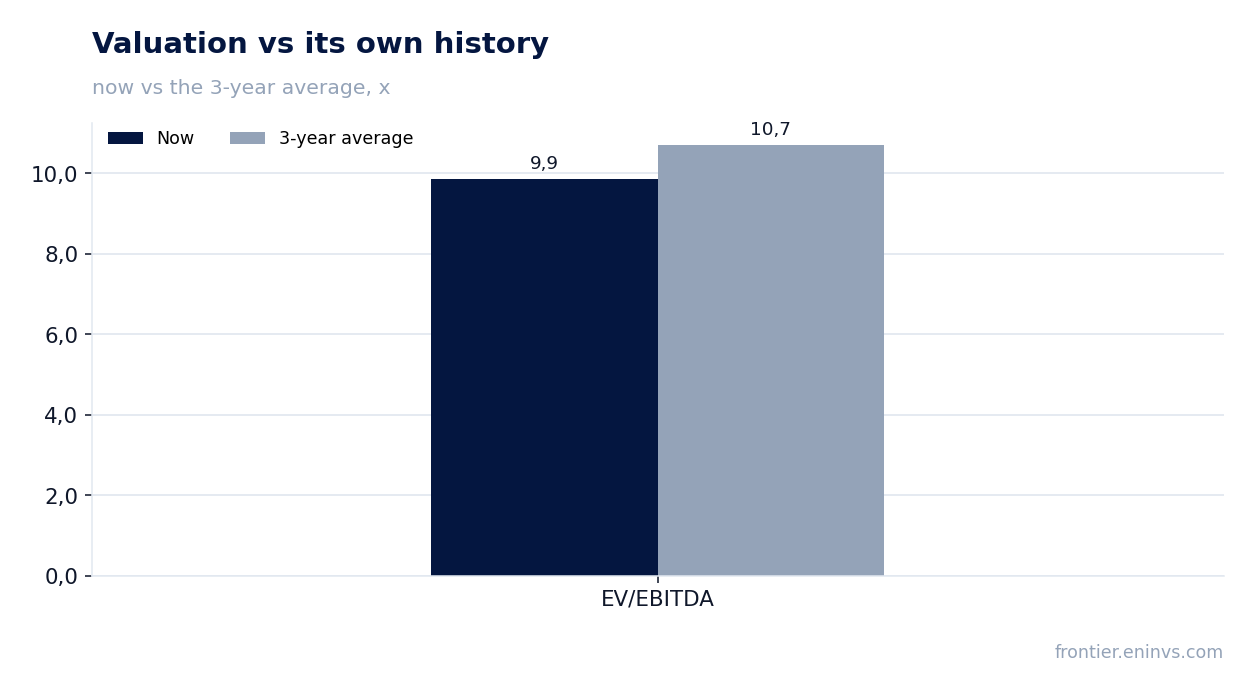
Range Resources Corporation reported third-quarter 2026 results. Revenue came in at USD 784.4 million, up 4.8% year on year, net profit at USD 175.3 million, up 21.5%, and the net margin rose to 22.4% from 19.3% a year earlier. Operating cash flow for the quarter was USD 307.6 million, net debt at end-September stood at USD 780.9 million, or 0.53x LTM EBITDA. The stock trades below its own history on EV/EBITDA (9.9x versus a three-year average of 10.7x), but a 0.69% dividend yield barely compensates for the risk, and the portal's model implies -54% to fair value – so the share looks rather unattractive at the current price.
Key takeaways
— Revenue added 4.8% after an 11.3% drop the previous quarter – there is acceleration, but its scale is modest
— Profit rose 21.5% on revenue up 4.8% – the margin climbed to 22.4% from 19.3%
— Operating cash flow of USD 307.6 million covers profit, but quarterly capex is not disclosed
— Net debt of USD 780.9 million equals 0.53x LTM EBITDA – leverage is moderate
— A 0.69% dividend yield gives the holder little support at the current price
— EV/EBITDA of 9.9x is below its own three-year average of 10.7x – an 8% discount to history
— The portal's model implies -54% to fair value – the market is pricing in higher commodity prices
Attractiveness
Key figures, USD bn
| Metric | Q3 2025 | Q3 2026 | Change |
|---|---|---|---|
| Revenue | 0.75 | 0.78 | +4.8% |
| EBITDA | 0.28 | — | — |
| Operating profit | 0.18 | — | — |
| Net profit | 0.14 | 0.18 | +21.5% |
| Operating cash flow | 0.25 | 0.31 | +24.3% |
| Capex | 0.15 | — | — |
| EBITDA margin | 37.0% | — | — |
| Net margin | 19.3% | 22.4% | +3.1 pp |
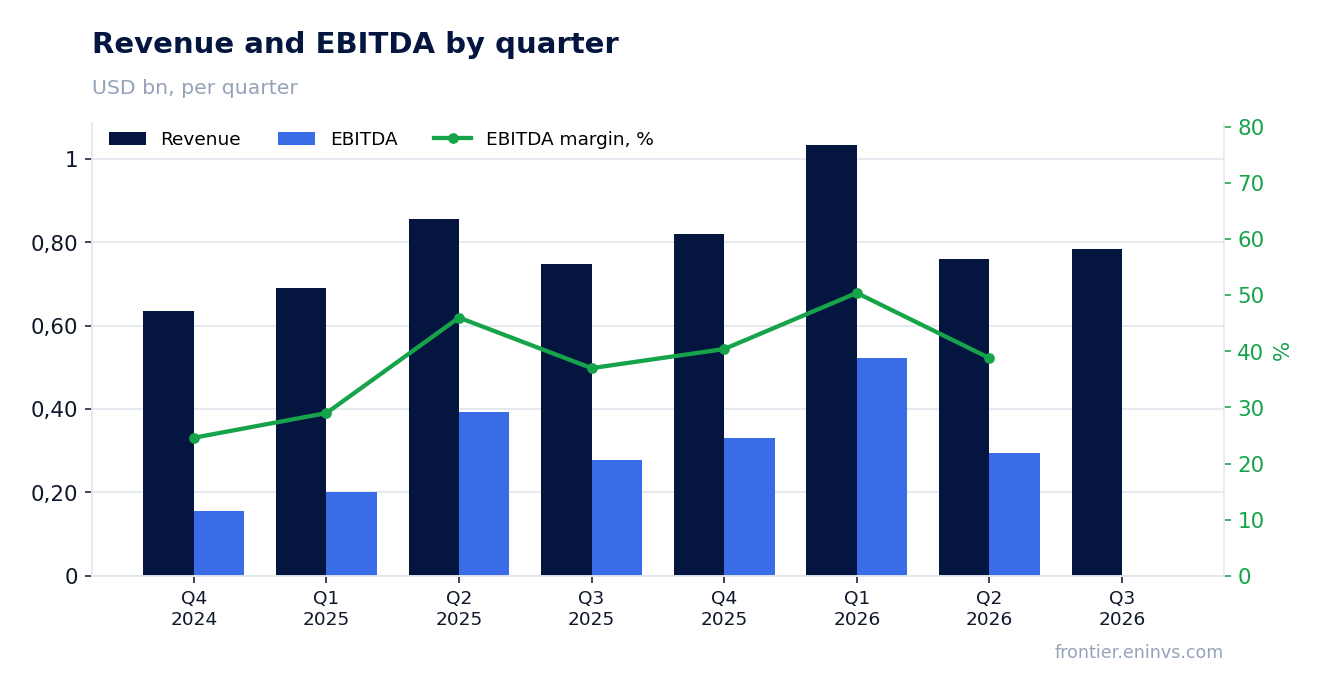
Revenue added 4.8% after an 11.3% drop the previous quarter – there is acceleration, but its scale is modest
In the third quarter of 2026 revenue was USD 784.4 million, up 4.8% year on year. This reverses the second quarter, when revenue fell 11.3% year on year – the trend accelerated, but the gain itself remains small.
A quarter earlier revenue was USD 759.6 million, so sequentially it rose 3.3%. The year-on-year comparison is flattered by a weak base in the third quarter of 2025, when revenue was USD 748.5 million.
The acceleration does not change the fact that the company operates in a narrow band: over the last four quarters revenue ranged from USD 759.6 million to USD 1,034.2 million, and the current level is closer to the bottom. Sustained growth needs a stronger comparison next quarter.
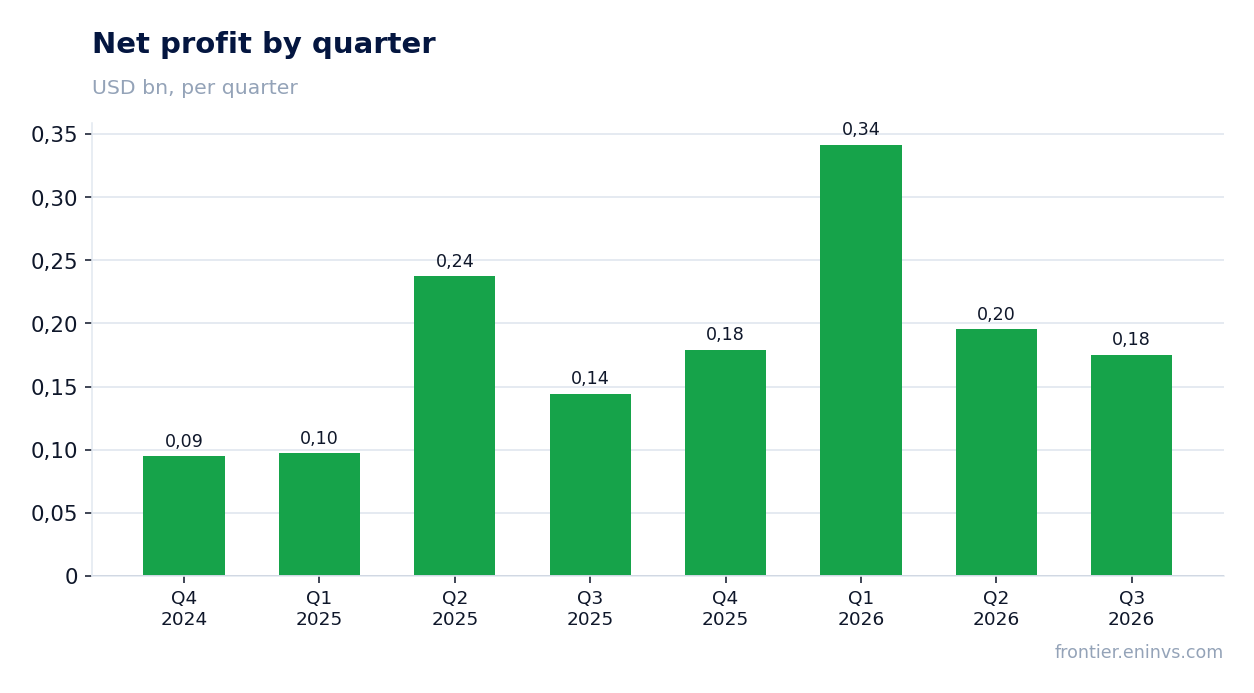
Profit rose 21.5% on revenue up 4.8% – the margin climbed to 22.4% from 19.3%
Net profit for the third quarter of 2026 was USD 175.3 million versus USD 144.3 million a year earlier, up 21.5%. With revenue up 4.8%, such outperformance means the net margin rose to 22.4% from 19.3%.
The gap between profit and revenue growth – about 17 percentage points – shows that most of the gain came not from volumes but from lower costs or one-off items. The report does not break down which cost line fell, so the specific source of savings cannot be named.
Second-quarter 2026 profit was USD 195.3 million, so sequentially it fell 10.2%. Quarterly profit dynamics are uneven, and the current level is below the first-quarter peak of USD 341.6 million.
Operating cash flow of USD 307.6 million covers profit, but quarterly capex is not disclosed
Operating cash flow for the third quarter of 2026 was USD 307.6 million – 1.75x net profit of USD 175.3 million. The excess comes from non-cash charges, primarily depreciation, which is not disclosed as a separate line.
Over the last 12 months operating cash flow was USD 1,419.3 million on revenue of USD 3,400.0 million, meaning about 42% of revenue converts into cash. That is high for the sector, but it also reflects that capex is not deducted from operating cash flow.
Third-quarter 2026 capex is not disclosed in the facts, so free cash flow for the quarter cannot be calculated. In the second quarter capex was USD 181.5 million, in the first USD 158.3 million; if the third quarter is close to those levels, free cash flow stays positive but well below operating cash flow.
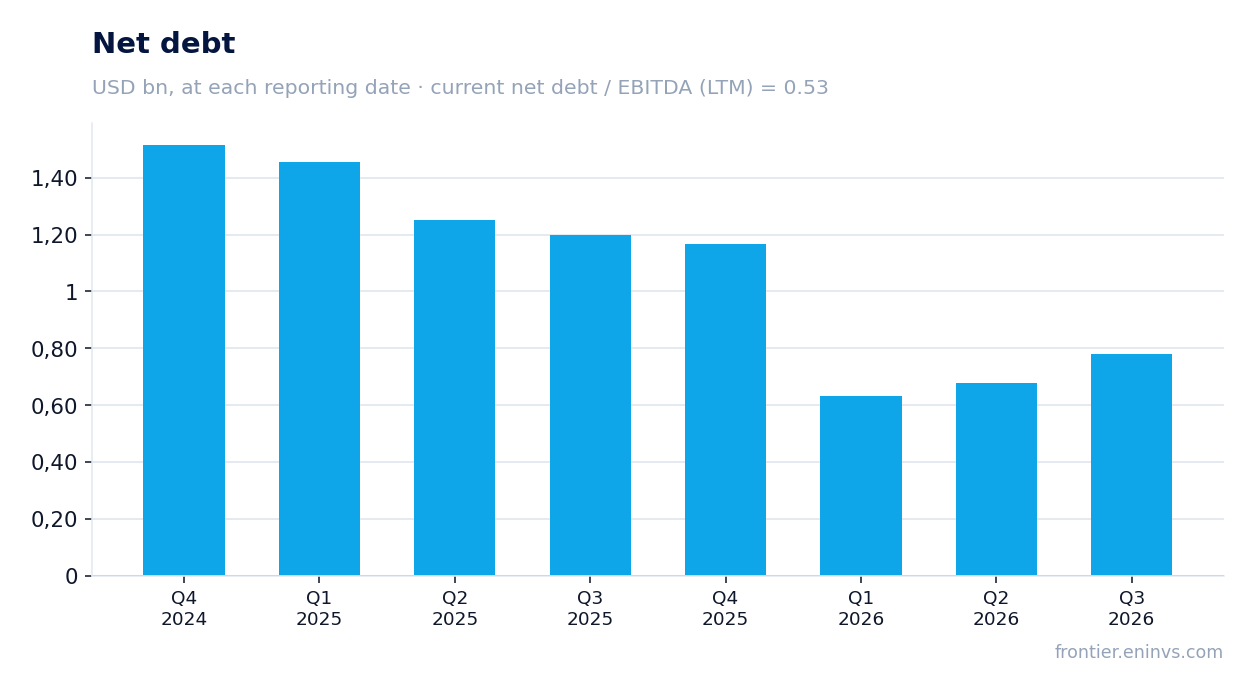
Net debt of USD 780.9 million equals 0.53x LTM EBITDA – leverage is moderate
Net debt at 30 September 2026 was USD 780.9 million versus USD 676.5 million at 30 June 2026 – an increase of USD 0.1 billion over the quarter. A year earlier, at 30 September 2025, net debt was USD 1,198.1 million, so over 12 months it fell by USD 0.4 billion.
The ratio of net debt to LTM EBITDA is 0.53x. That is a moderate level: the company services its debt without strain, and even if EBITDA halved the ratio would stay below 1.1x.
Interest expense is not disclosed in the facts, so the cost of servicing the debt cannot be assessed. But with a market capitalisation of USD 13,275.1 million, net debt is less than 6% of the company's value – debt is not the main risk for a holder.
A 0.69% dividend yield gives the holder little support at the current price
The trailing 12-month dividend yield is 0.69%. With a market capitalisation of USD 13,275.1 million, that corresponds to payouts of about USD 91.6 million a year, roughly 10% of LTM net profit of USD 891.4 million.
Our estimate: if current profit and the payout ratio hold, the 2026 dividend will stay in the same range – a yield of about 0.7%. The payout depends on profit, which was USD 341.6 million in the first quarter but USD 195.3 million and USD 175.3 million in the second and third; if quarterly profit stays near USD 175 million, the annual base would be about USD 700 million, and a USD 91.6 million payout would take about 13% of profit.
A 0.69% yield is well below the key rate and does not compensate for the risk of holding the share. For comparison, an EV/EBITDA of 9.9x implies an EBITDA yield of about 10%, but most of that goes to capex and debt service rather than dividends.
The payout could shrink if profit falls: if LTM EBITDA declines while debt stays at USD 780.9 million, the company may direct free cash flow to debt rather than dividends. Also, if capex rises above USD 181.5 million a quarter, free cash flow will contract.
EV/EBITDA of 9.9x is below its own three-year average of 10.7x – an 8% discount to history
LTM EV/EBITDA is 9.9x. The three-year average for this multiple is 10.7x, so the stock trades 8% below its own history. This is the only comparison the facts allow: there is no sector or peer data in them.
LTM P/E is 14.9x. With net profit of USD 891.4 million and a market capitalisation of USD 13,275.1 million, that implies an earnings yield of about 6.7%, above the 0.69% dividend yield but below the key rate.
The discount to history may reflect market expectations for commodity prices: the portal's model, which reprices EBITDA at current commodity prices, implies -54% to fair value. In other words, the market values the company above what it would be worth at current prices for its output.
The portal's model implies -54% to fair value – the market is pricing in higher commodity prices
According to the portal's model, which reprices EBITDA at current commodity prices and a target EV/EBITDA, the fair value of the share is 54% below the current market price. This is our own estimate, not a market consensus or a target price.
Such a gap means the market is pricing in higher commodity prices than current ones. If commodity prices stay at current levels, the stock has downside; if prices rise, the model will revise upwards.
For a holder this is the main argument against buying at the current price: even with an 8% discount to its own EV/EBITDA history, the stock looks expensive relative to current prices for its output.
Valuation on the latest reported figures
| Metric | Value |
|---|---|
| Market cap | 13.3 bn USD |
| P/E (LTM) | 14.9 |
| EV/EBITDA (LTM) | 9.9 |
| P/B | 3.07 |
| Net debt / EBITDA (LTM) | 0.53 |
| Operating cash flow (LTM) | 1.42 bn |
| ROE | 4.9% |
| Dividend yield (12m) | 0.7% |
| EV/EBITDA, 3-year average | 10.7 |
Bottom line
The quarter's strength was profit: it rose 21.5% on revenue up 4.8%, and the margin climbed to 22.4% from 19.3%. But that growth came from costs, not volumes, and the report does not break down which line delivered the savings – the durability of that source cannot be verified. Debt is moderate: 0.53x LTM EBITDA, and over the year net debt fell from USD 1,198.1 million to USD 780.9 million. A 0.69% dividend yield offers little support, and the portal's model implies -54% to fair value. The verdict is rather unattractive: an 8% discount to its own EV/EBITDA history does not outweigh the risk of falling commodity prices and weak dividend support.
Open the company's financial profile RRC →
See also: market overview · valuation map · stock screeners