SM Energy Company: revenue up 2.7x but profit down 40% – growth paid for with margin

SM Energy Company reported results for the third quarter of 2026. Revenue came in at USD 2,170.0 mn, up 167.4% year on year, EBITDA at USD 1,300.0 mn, and net profit at USD 93.0 mn. At the same time the EBITDA margin fell to 59.9% from 64.9% a year earlier and the net margin to 4.3% from 19.1%, with profit 40.0% below last year's level. The stock trades below its own history on EV/EBITDA (3.4 versus a three-year average of 5.4), but the profit decline and high leverage (1.89 net debt/EBITDA LTM) keep it from being attractive – verdict: rather unattractive.
Key takeaways
— Revenue rose 167.4% but growth decelerated from 215.3% in the second quarter
— EBITDA added 147.0%, yet its margin fell to 59.9% from 64.9%
— Net profit fell 40.0% despite revenue growth – the margin compressed to 4.3%
— Net debt declined to USD 6.2 bn from 6.4 bn at end-June
— Operating cash flow of 1,122.0 mn covered capital expenditure of 711.0 mn
— A dividend yield of 2.35% is modest against the key rate
— EV/EBITDA of 3.4 is below its own three-year average of 5.4
Attractiveness
Key figures, USD bn
| Metric | Q3 2025 | Q3 2026 | Change |
|---|---|---|---|
| Revenue | 0.81 | 2.17 | +167.4% |
| EBITDA | 0.53 | 1.30 | +147.0% |
| Operating profit | 0.20 | 0.24 | +17.4% |
| Net profit | 0.16 | 0.09 | -40.0% |
| Operating cash flow | 0.50 | 1.12 | +122.2% |
| Capex | 0.40 | 0.71 | +75.9% |
| EBITDA margin | 64.9% | 59.9% | -5.0 pp |
| Net margin | 19.1% | 4.3% | -14.8 pp |
Revenue rose 167.4% but growth decelerated from 215.3% in the second quarter
In the third quarter of 2026 revenue reached USD 2,170.0 mn, up 167.4% year on year. That is a strong result, but it is more modest than the 215.3% growth in the second quarter. The deceleration suggests the main growth impulse came in the prior period.
Year-on-year revenue growth remains a multiple, and that is the key feature of the report. Yet the comparison with the previous quarter shows the peak of growth is likely behind. For a holder what matters more is not the fact of multiple growth but how sustainably it converts into profit.
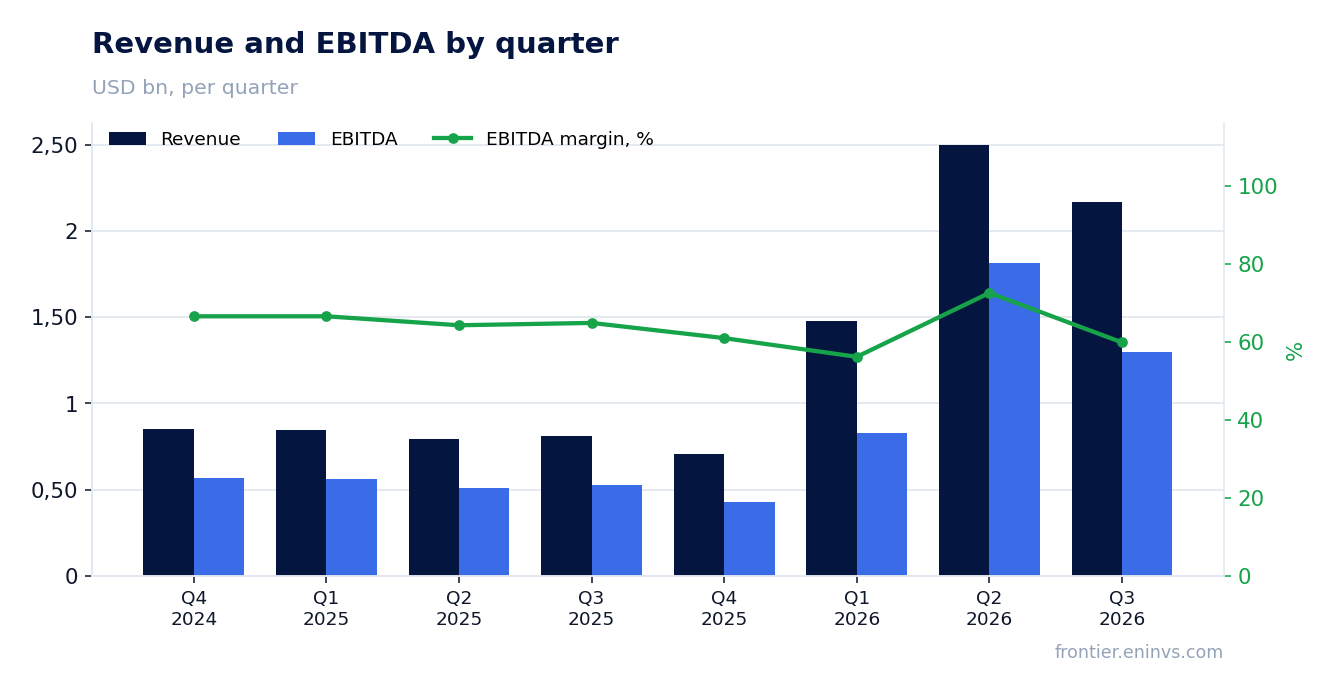
EBITDA added 147.0%, yet its margin fell to 59.9% from 64.9%
EBITDA for the third quarter was USD 1,300.0 mn, up 147.0% year on year. The growth is solid but lags revenue growth, and this is directly reflected in the margin: the EBITDA margin fell to 59.9% from 64.9% a year earlier.
A five-percentage-point margin compression alongside multiple revenue growth means costs are rising faster than income. Operating profit was USD 236.0 mn, noticeably below EBITDA, pointing to substantial costs below that line. It is this cost pressure, not revenue dynamics, that determines the bottom-line result.
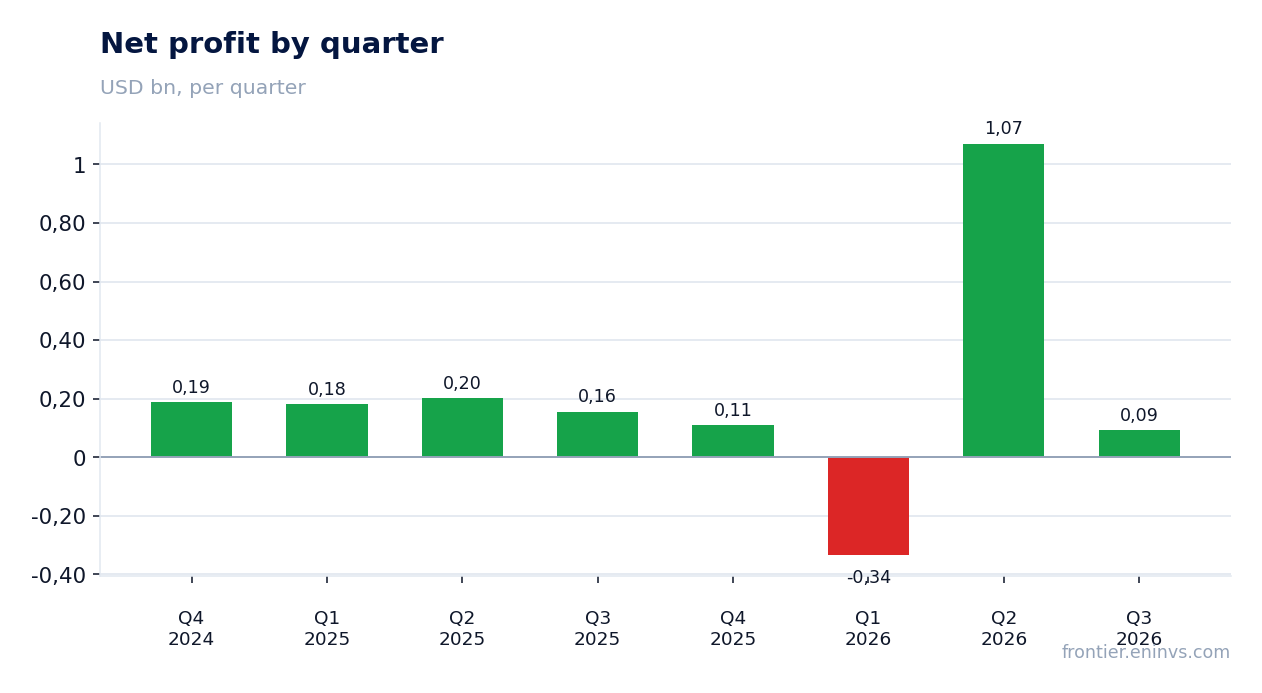
Net profit fell 40.0% despite revenue growth – the margin compressed to 4.3%
Net profit for the third quarter was USD 93.0 mn, 40.0% below the year-earlier level, even as revenue rose 167.4%. The net margin fell to 4.3% from 19.1%. This is the report's central contrast: the company is scaling turnover but earning far less on it.
The gap between EBITDA of 1,300.0 mn and net profit of 93.0 mn is explained by costs below operating profit – primarily interest expense and depreciation. With net debt at USD 6,172.0 mn, leverage remains significant. Over the trailing twelve months net profit was USD 938.2 mn, and the current quarterly result is well below that average.
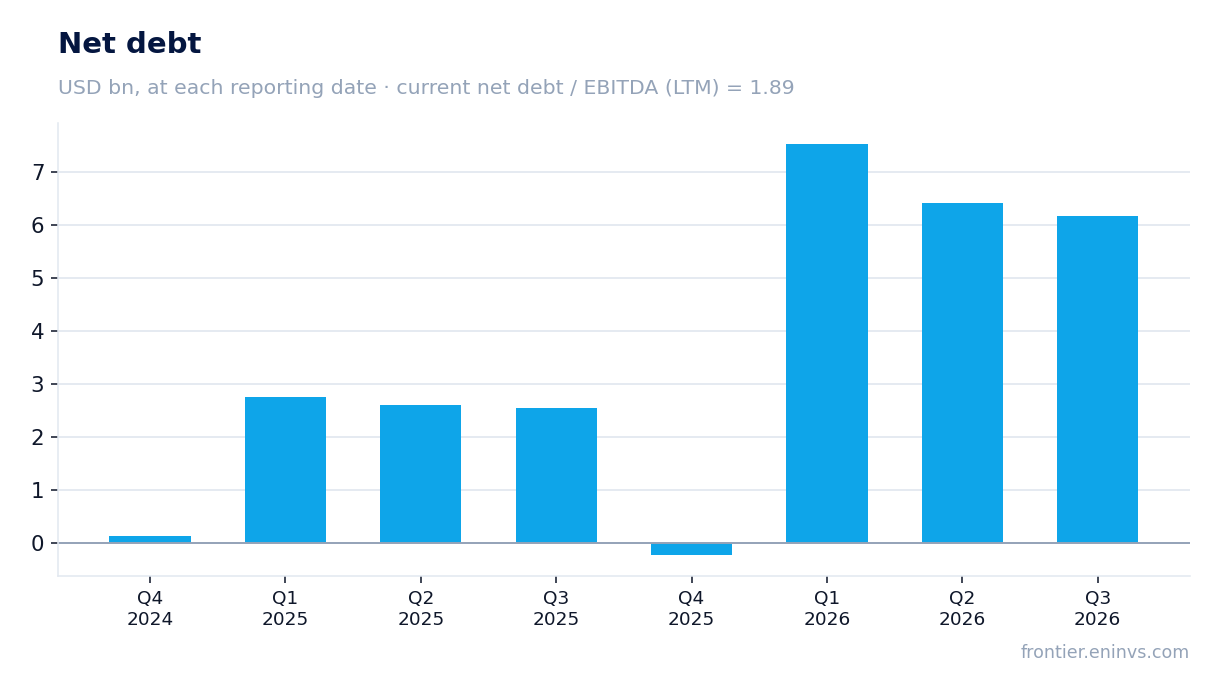
Net debt declined to USD 6.2 bn from 6.4 bn at end-June
Net debt at 30 September 2026 was USD 6,172.0 mn versus USD 6,416.0 mn at 30 June 2026 – a decline of 0.2 bn. A year earlier, at 30 September 2025, net debt was USD 2,550.5 mn, meaning it rose by 3.6 bn over twelve months.
The ratio of net debt to trailing-twelve-month EBITDA is 1.89. That is a moderate level but it requires servicing: interest expense absorbs a substantial part of operating profit of 236.0 mn. The quarterly debt reduction is a positive signal, yet it is small relative to total obligations.
Operating cash flow of 1,122.0 mn covered capital expenditure of 711.0 mn
Operating cash flow for the third quarter was USD 1,122.0 mn, capital expenditure USD 711.0 mn. The 411.0 mn difference remains at the company's disposal after investment, and this is the report's key strength: the business generates real cash.
Over the trailing twelve months operating cash flow was USD 3,316.9 mn. Free cash flow is positive, allowing capital expenditure to be funded without increasing debt. However, most of this flow goes to debt servicing and investment rather than dividends.
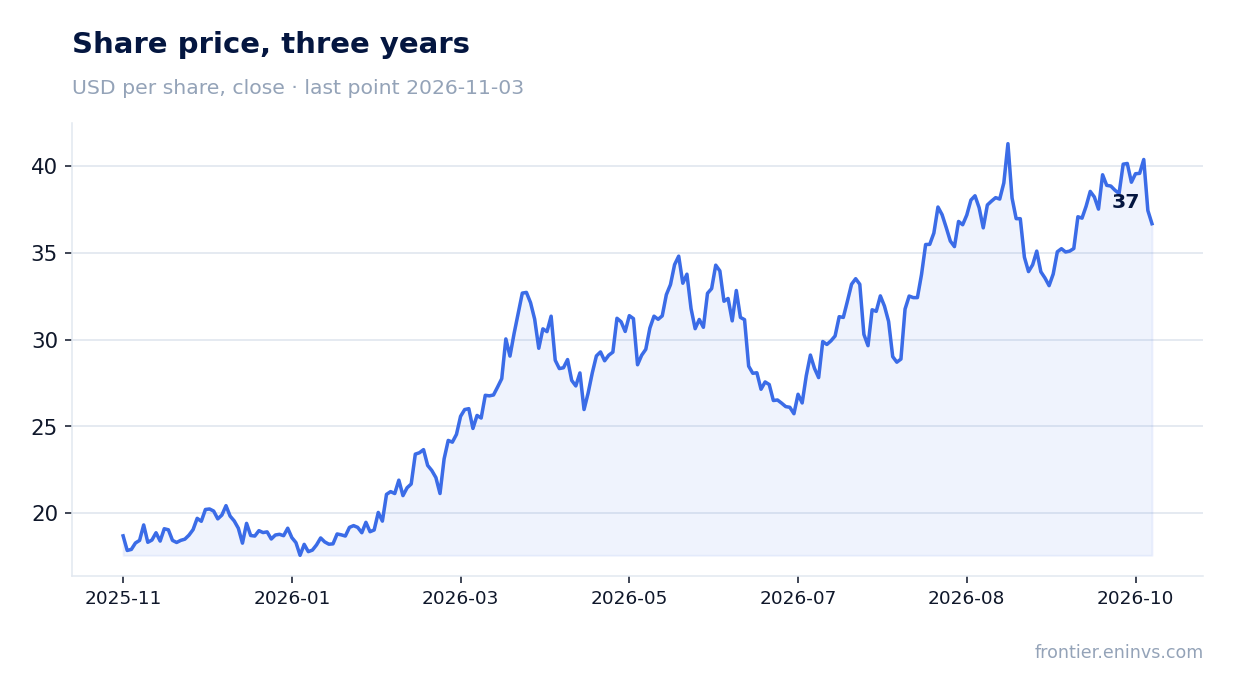
A dividend yield of 2.35% is modest against the key rate
The trailing-twelve-month dividend yield is 2.35%. With a market capitalisation of USD 8,711.3 mn, this is a modest level, especially against the current key rate. Payouts are not the primary means of returning capital for this issuer.
A yield of 2.35% does not compensate for the risk associated with profit volatility. With a net margin of 4.3% and profit of USD 93.0 mn, dividend sustainability depends on the company's ability to maintain cash flow. If profit continues to decline, payouts may be revised.
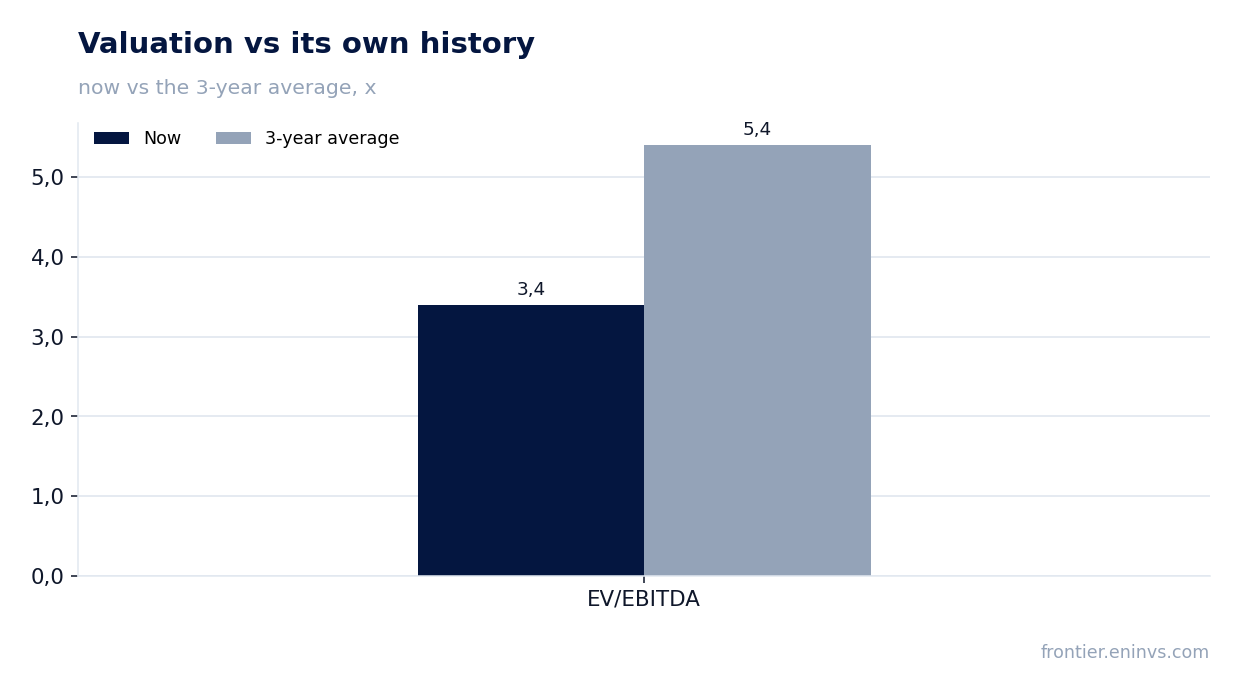
EV/EBITDA of 3.4 is below its own three-year average of 5.4
The trailing-twelve-month EV/EBITDA multiple is 3.4 versus a three-year average of 5.4 – 37% below its own history. On this measure the stock trades cheaper than usual. The LTM P/E is 9.28, which also does not look high.
However, the low multiple reflects not only undervaluation but also risks: falling profit, margin compression and high leverage. On the portal's model the upside to fair value is estimated at -66%, meaning the model sees the stock as overvalued relative to current commodity prices. This is the portal's own calculation, not a market consensus.
Valuation on the latest reported figures
| Metric | Value |
|---|---|
| Market cap | 8.71 bn USD |
| P/E (LTM) | 9.3 |
| EV/EBITDA (LTM) | 3.4 |
| P/B | 1.81 |
| Net debt / EBITDA (LTM) | 1.89 |
| Operating cash flow (LTM) | 3.32 bn |
| ROE | 1.6% |
| Dividend yield (12m) | 2.3% |
| EV/EBITDA, 3-year average | 5.4 |
Bottom line
The report's strength is revenue of USD 2,170.0 mn and operating cash flow of 1,122.0 mn, which covers capital expenditure of 711.0 mn. The weakness is profit: 93.0 mn, down 40.0%, with a margin of 4.3%. The EV/EBITDA multiple of 3.4 is below its own three-year average of 5.4, but this reflects risks rather than undervaluation. A dividend yield of 2.35% does not compensate for profit volatility. Verdict: rather unattractive – the stock is cheap by its own history, but weak profit and leverage outweigh that.
Open the company's financial profile SM →
See also: market overview · valuation map · stock screeners