Super Micro Computer, Inc.: revenue nearly quadrupled, yet free cash flow is negative again

On 20 October Super Micro Computer, Inc. released preliminary results for the first quarter of fiscal 2027, ended 30 September 2026. Revenue came in at USD 19,945.8 mn against 5,017.8 mn a year earlier (+297.5%), EBITDA at 2,227.5 mn (+1046.1%) and net profit at 1,594.2 mn (+847.3%). The EBITDA margin rose to 11.2% from 3.9% and the net margin to 8.0% from 3.4%. Operating cash flow for the quarter was nevertheless negative at minus 434.0 mn, and net debt stood at 6.0 bn on 30 September 2026. The share looks attractive: EV/EBITDA LTM of 5.5 is more than four times below its own three-year average of 25.8, and the portal's model puts the upside to fair value at +7%.
Key takeaways
— Revenue rose 297.5% to USD 19,945.8 mn, and the company itself attributes this to increased demand for AI platforms
— The EBITDA margin climbed to 11.2% from 3.9% on customer and product mix, not on cost cuts
— Net profit of 1,594.2 mn rose 847.3%, yet operating cash flow for the quarter stayed negative at minus 434.0 mn
— Net debt rose over the year from 1.0 bn to 6.0 bn dollars, and net debt to LTM EBITDA stands at 1.23
— EV/EBITDA LTM of 5.5 against its own three-year average of 25.8 – the share is 79% cheaper than its history
— On the portal's model the upside to fair value is +7%, and the stock sits in the live US AI infrastructure strategy
Attractiveness
Key figures, USD bn
| Metric | Q3 2025 | Q3 2026 | Change |
|---|---|---|---|
| Revenue | 5.02 | 19.9 | +297.5% |
| EBITDA | 0.19 | 2.23 | +1046.1% |
| Operating profit | 0.18 | 2.06 | +1032.7% |
| Net profit | 0.17 | 1.59 | +847.3% |
| Operating cash flow | -0.92 | -0.43 | — |
| Capex | 0.03 | 0.04 | +28.8% |
| EBITDA margin | 3.9% | 11.2% | +7.3 pp |
| Net margin | 3.4% | 8.0% | +4.6 pp |
Revenue rose 297.5% to USD 19,945.8 mn, and the company itself attributes this to increased demand for AI platforms
Revenue for the first quarter of fiscal 2027 came to USD 19,945.8 mn against 5,017.8 mn a year earlier. The company's release attributes the growth to increased demand for AI platforms. This is not a one-off line: quarter on quarter revenue also rose, from 11,119.8 mn in the second quarter of fiscal 2026.
Year-on-year growth is accelerating: in the first quarter of fiscal 2026 it was 297.5%, while in the fourth quarter of fiscal 2026 it was 93.2%. The preliminary revenue range the company had guided to was 14.5–15.5 bn dollars, and the actual result is above the top of that range. Demand proved stronger than management's own expectations.
What matters for the share is not the absolute figure but durability: the company itself warns that as it targets larger customers, the customer base becomes more concentrated and revenue less predictable. That risk has not materialised yet, but it is what determines whether the pace holds in coming quarters.
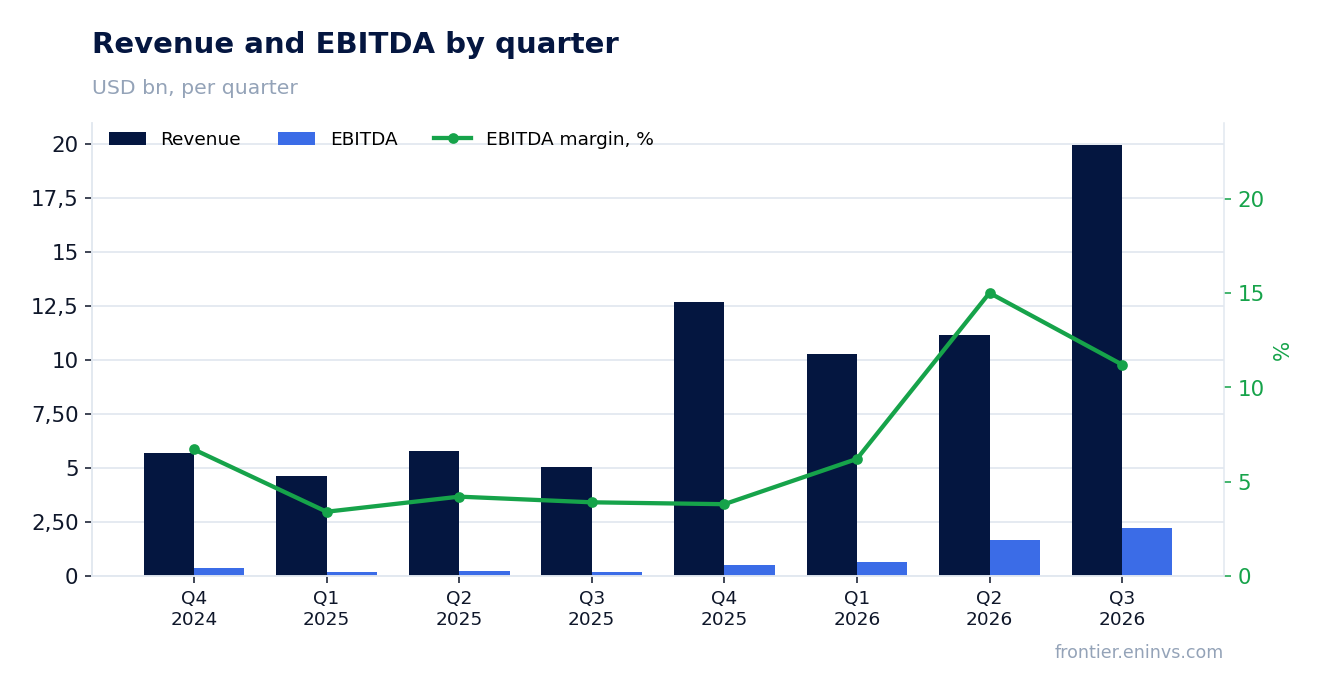
The EBITDA margin climbed to 11.2% from 3.9% on customer and product mix, not on cost cuts
EBITDA for the quarter was USD 2,227.5 mn, a margin of 11.2% against 3.9% a year earlier. The release attributes the gross margin improvement to customer and product mix. Preliminary gross margin is 12.0–12.5% against the earlier guidance of 10.4–10.8%.
Net profit rose 847.3% to 1,594.2 mn, with a net margin of 8.0% against 3.4%. Operating profit was 2,064.5 mn. The gap between EBITDA and operating profit is small, so most of the improvement comes from gross margin rather than from financial lines.
The 7.3 percentage point year-on-year margin gain is the main argument that revenue growth was not bought with discounts. But the company names mix as the cause rather than a structural cost reduction, so margin durability depends on whether the favourable customer and product combination persists.
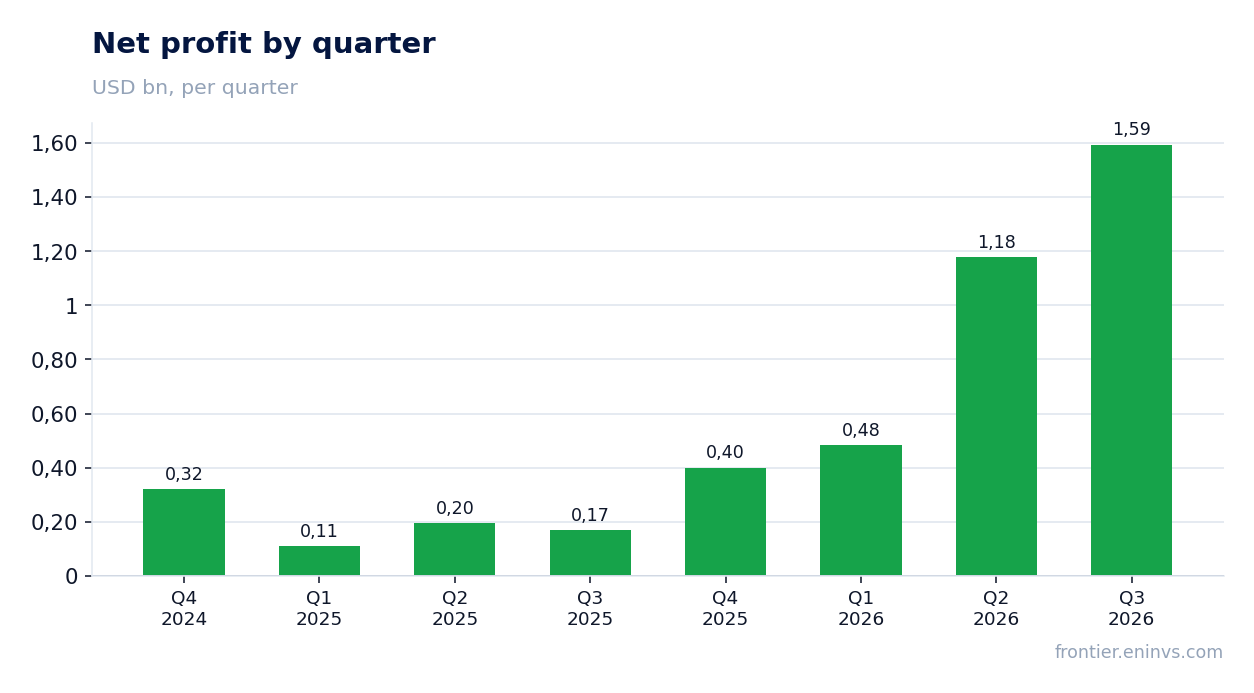
Net profit of 1,594.2 mn rose 847.3%, yet operating cash flow for the quarter stayed negative at minus 434.0 mn
Operating cash flow for the quarter was minus USD 434.0 mn against net profit of 1,594.2 mn. Capital expenditure was small at 41.6 mn. The gap between profit and cash means working capital is absorbing the result: revenue growth of this scale pulls inventories and receivables up.
Over the trailing twelve months operating cash flow is also negative at minus 6,326.4 mn, against revenue of 54,000.0 mn and net profit of 3,656.4 mn. This is not a single quarter but a consequence of the growth model: the company funds working capital faster than it collects.
For a holder this is the central question of the report. Profit is there and the margin rose, but it is not turning into cash, and that is why net debt is rising. As long as revenue growth continues the gap will repeat; its narrowing would be the first sign that the model has become self-funding.
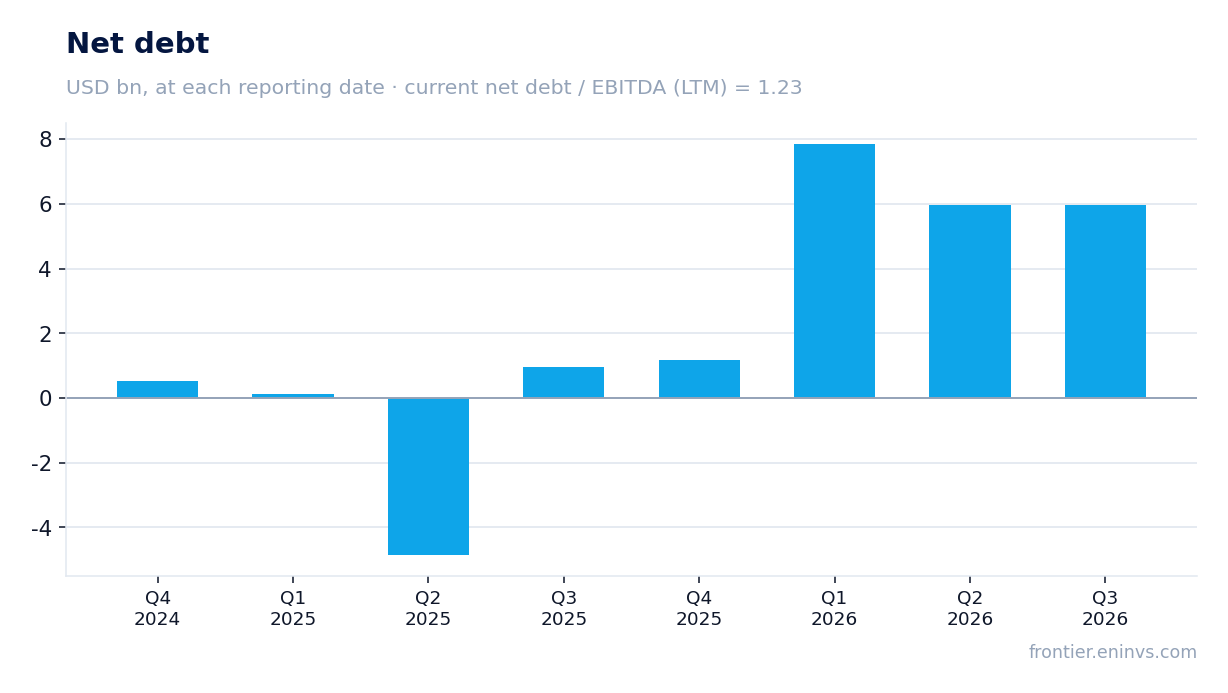
Net debt rose over the year from 1.0 bn to 6.0 bn dollars, and net debt to LTM EBITDA stands at 1.23
Net debt on 30 September 2026 was USD 6.0 bn against 1.0 bn on 30 September 2025, a rise of 5.0 bn over twelve months. Over the last quarter the level did not change: it was the same 6.0 bn on 30 June 2026. So debt rose over the year but stabilised in the last three months.
Net debt to trailing twelve-month EBITDA is 1.23. That is a moderate level for a company growing at this pace and funding working capital with debt. The prior value of this ratio is not in the facts, so no direction of leverage can be claimed – only the current level can be stated.
The link is clear: negative operating cash flow over twelve months (–6,326.4 mn) is the source of the debt increase. With LTM EBITDA at 4,854.8 mn, debt service does not look threatening, but further borrowing while the cash flow stays negative would make the ratio less comfortable.
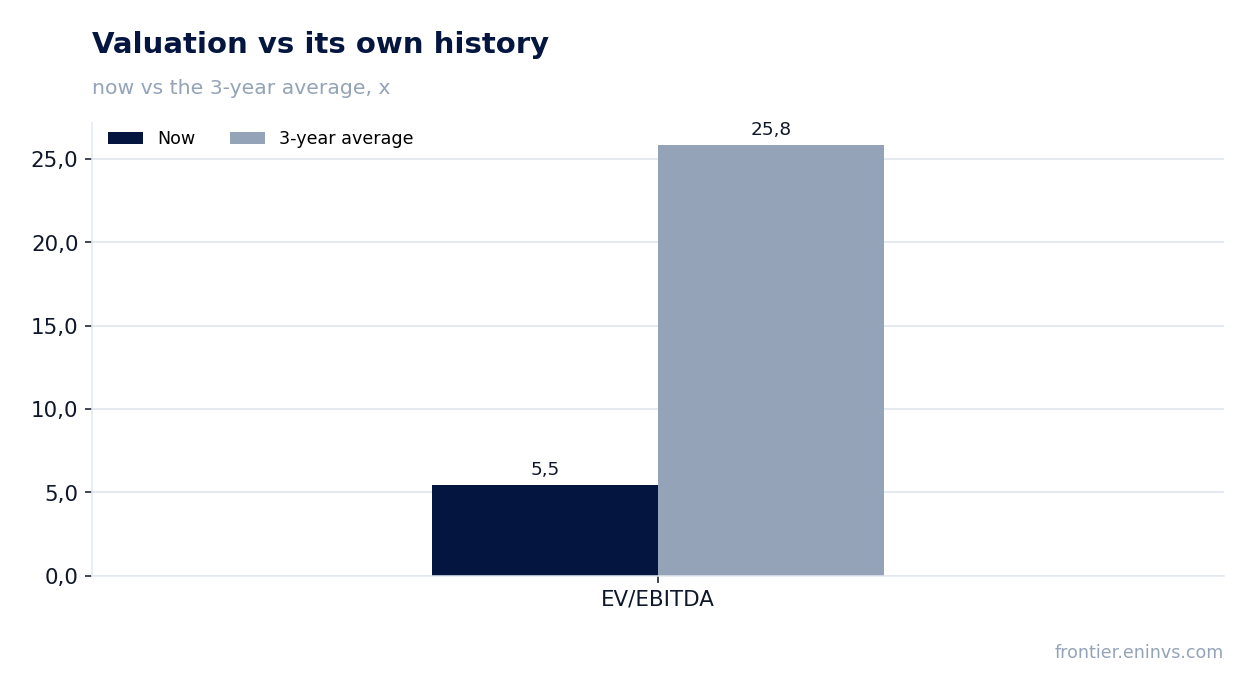
EV/EBITDA LTM of 5.5 against its own three-year average of 25.8 – the share is 79% cheaper than its history
EV/EBITDA over the trailing twelve months is 5.5 against its own three-year average of 25.8, i.e. 79% below. P/E LTM is 5.64. Market capitalisation is USD 20,622.1 mn. On this multiple the share sits below its history, not above it.
The reason for the gap is EBITDA growth: over twelve months it reached 4,854.8 mn, and the multiple's denominator grew faster than the price. Return on equity is 41.7%, confirming that profit on capital is high while the market pays little for it.
On the portal's model the upside to fair value is +7%. That is our own estimate, not a market consensus and not a target price. It rests on EBITDA growth and a target multiple, and its modest size says most of the re-rating has already happened.
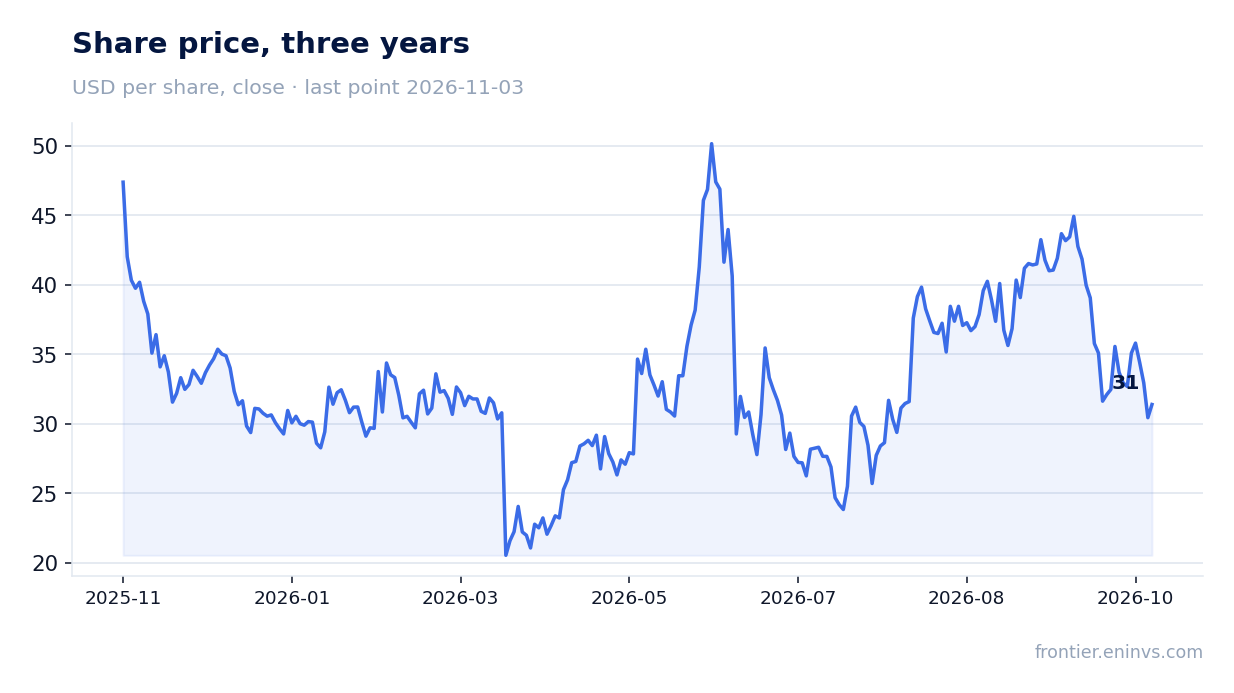
On the portal's model the upside to fair value is +7%, and the stock sits in the live US AI infrastructure strategy
The share is held in a live model strategy on the portal, US AI infrastructure. That is a membership fact, not an argument for the verdict: selection into the strategy follows its own screen and does not replace an assessment of the stock.
The close before the release was USD 32.1; on the release day the share added 1.2%, and from the release to 3 November 2026 it lost 2.2%. The reaction was restrained: the market took the strong operating numbers in but did not re-rate the stock upward.
What to watch in the next report: whether gross margin holds in the 12.0–12.5% range, whether the gap between profit and cash narrows, and whether net debt stops rising. Any of these turning positive would strengthen the case for the current valuation; the reverse would weaken it.
Valuation on the latest reported figures
| Metric | Value |
|---|---|
| Market cap | 20.6 bn USD |
| P/E (LTM) | 5.6 |
| EV/EBITDA (LTM) | 5.5 |
| P/B | 1.42 |
| Net debt / EBITDA (LTM) | 1.23 |
| Operating cash flow (LTM) | -6.33 bn |
| ROE | 41.7% |
| EV/EBITDA, 3-year average | 25.8 |
Bottom line
The strong side of the report is operational: revenue rose 297.5% to 19,945.8 mn, the EBITDA margin climbed to 11.2%, and net profit reached 1,594.2 mn. The weak side is cash: operating flow for the quarter was minus 434.0 mn, minus 6,326.4 mn over twelve months, and net debt rose over the year from 1.0 bn to 6.0 bn. EV/EBITDA of 5.5 against its own three-year average of 25.8 says the market no longer pays the old price for growth. The verdict is attractive: the valuation is below its history, the margin is rising, and leverage at 1.23 times EBITDA remains moderate. The holder's question is no longer profit but when growth starts turning into cash.
Open the company's financial profile SMCI →
See also: market overview · valuation map · stock screeners