S&P Global: revenue fell 5.4% but profit rose 5.4% on a one-off disposal gain

On 27 October S&P Global reported third-quarter 2026 results. Revenue came in at $3,678 million, down 5.4% year over year, operating profit reached $1,956 million, and net profit was $1,240 million, up 5.4% on the same quarter a year earlier. Profit growth against falling revenue is explained by a one-off $200 million disposal gain in the Energy segment and a lower share count after buybacks. At the current price the stock looks neutral: strong cash flow and buybacks are offset by the revenue decline and the absence of a discount to its own valuation history.
Key takeaways
— Revenue fell 5.4% after growing 10.4% a quarter earlier – a sharp deceleration that needs explaining
— A one-off $200 million disposal gain in Energy delivered almost all of the operating profit increase
— Margin rose to 53.2% from 45.2%, but without the one-off gain it would have been noticeably lower
— Net profit rose 5.4% despite falling revenue – helped by the one-off gain and a lower share count
— Debt rose to $11,467 million at end-2025, while free cash flow for nine months was $3,568 million
— The company repurchased more than $4 billion of shares year-to-date and expects more than $7 billion for all of 2026
— The EV/EBITDA multiple of 24.1x matches its three-year average – there is no discount to its own history
Attractiveness
Key figures, USD bn
| Metric | Q3 2025 | Q3 2026 | Change |
|---|---|---|---|
| Revenue | 3.89 | 3.68 | -5.4% |
| EBITDA | 1.96 | — | — |
| Operating profit | 1.68 | 1.96 | +16.8% |
| Net profit | 1.18 | 1.24 | +5.4% |
| Operating cash flow | 1.50 | — | — |
| Capex | 0.04 | — | — |
| EBITDA margin | 50.5% | — | — |
| Net margin | 30.2% | 33.7% | +3.5 pp |
Revenue fell 5.4% after growing 10.4% a quarter earlier – a sharp deceleration that needs explaining
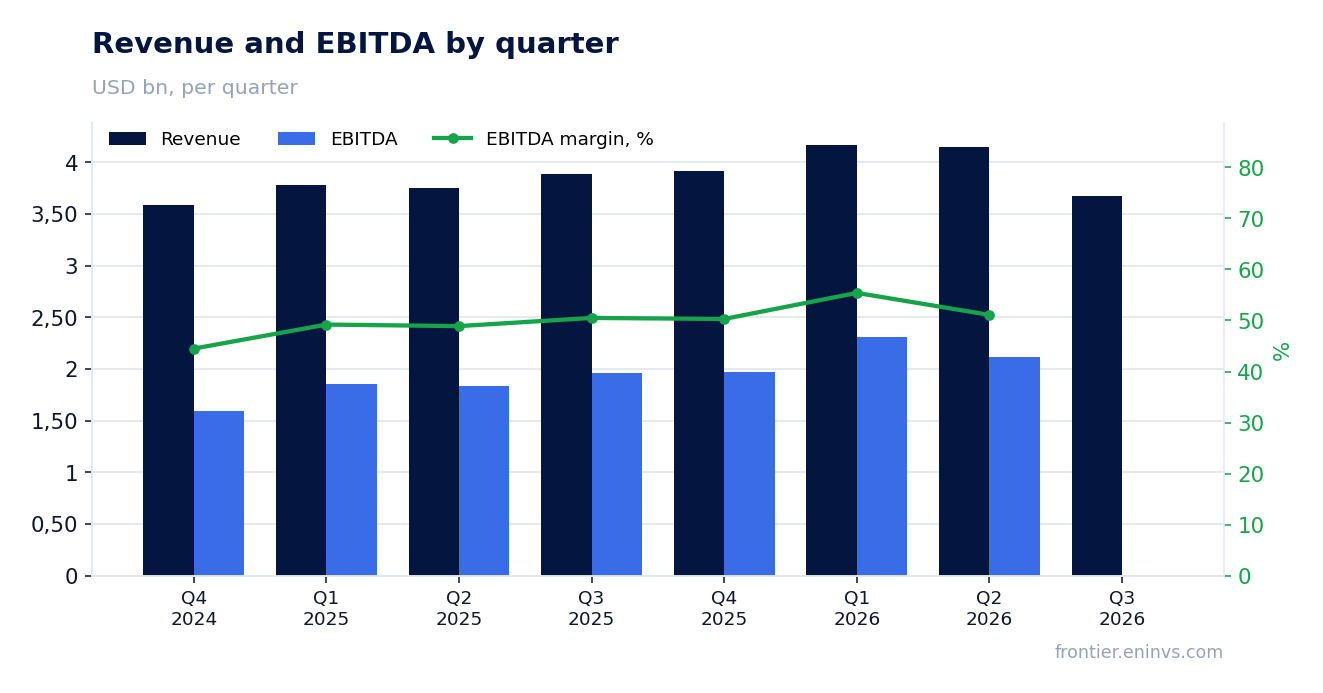
In the third quarter of 2026 S&P Global's revenue was $3,678 million, 5.4% less than a year earlier. This is a notable reversal: in the second quarter revenue grew 10.4%, and in the first quarter also 10.4%. The deceleration was sharp, and the report does not explain it by seasonality or one-off factors.
The segment picture is mixed. Ratings brought in $1,271 million (+2% year over year), Indices – $554 million (+20%), Energy – $645 million (+6%), Market Intelligence – $1,263 million (+7%). The segments grew in aggregate, but total revenue fell because of $55 million of inter-segment eliminations and, likely, reclassification: Mobility has been treated as a discontinued operation since 1 July 2026, and all prior periods have been recast.
It is the recast of prior periods that explains the gap between segment growth and the fall in total revenue. The report states that third-quarter 2025 revenue was recast on a continuing-operations basis, and the comparison is against that recast base. The 5.4% decline therefore reflects the effect of the Mobility spin-off rather than an organic contraction of the business.
For an investor this means current revenue cannot be compared directly with last year's without adjusting for the Mobility spin-off. The company estimates organic constant-currency growth at 7.5–8.5% for all of 2026, and that estimate looks a more reliable guide than the quarterly comparison.
A one-off $200 million disposal gain in Energy delivered almost all of the operating profit increase
Operating profit in the third quarter of 2026 was $1,956 million against $1,556 million a year earlier, up 26%. However, the report explicitly states that the Energy segment includes a one-off disposal gain of $200 million. Without it, operating profit would have grown by roughly 13%, not 26%.
This one-off gain explains why profit is growing while revenue falls. In the Energy segment operating profit rose 88% to $469 million, and almost all of that increase came from the asset sale. Growth in other segments was more modest: Ratings +2%, Indices +24%, Market Intelligence +19%.
Adjusted operating profit, which excludes one-off items, rose 8% to $1,969 million. That is a fairer measure of business dynamics, and it is well below the 26% growth in reported profit. The gap between reported and adjusted profit is the contribution of one-off factors that will not repeat next quarter.
Margin rose to 53.2% from 45.2%, but without the one-off gain it would have been noticeably lower
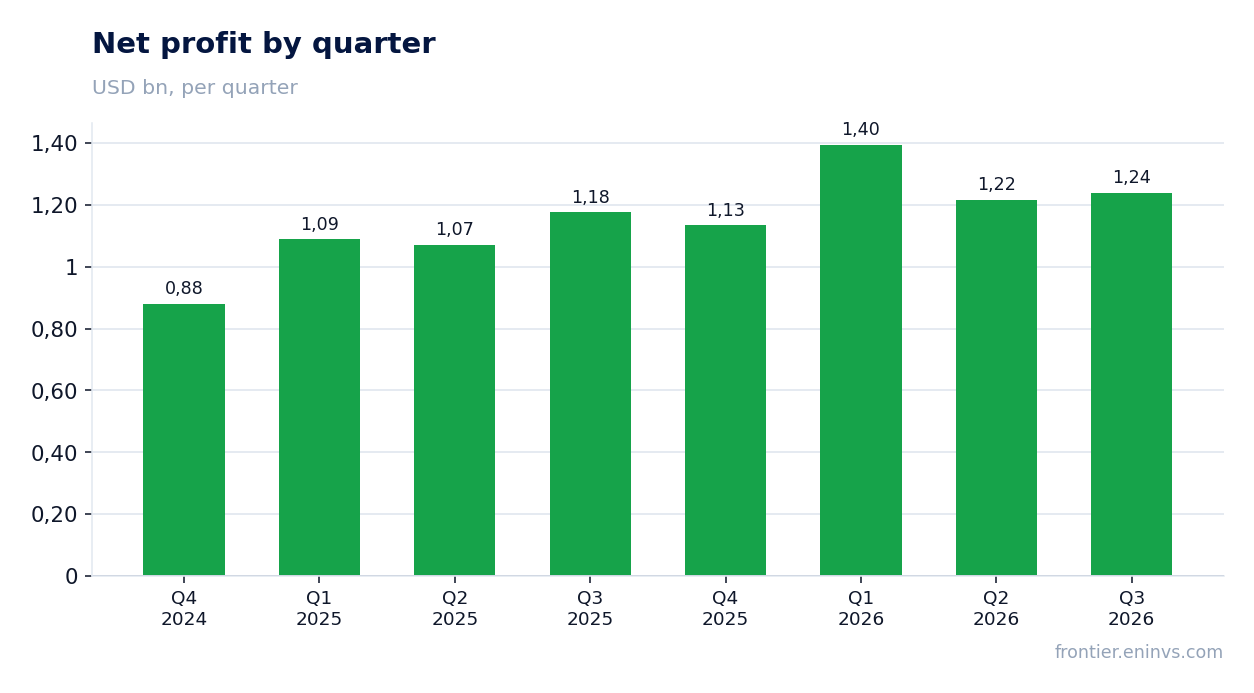
Operating margin in the third quarter of 2026 was 53.2% against 45.2% a year earlier – an increase of 800 basis points. However, the report states that this increase was driven primarily by the one-off disposal gain rather than by improved operating efficiency.
Adjusted operating margin rose by only 60 basis points to 53.5%. That is a modest improvement, and it reflects the real dynamics of expenses. Expenses rose 2% to $1,922 million while revenue fell 5.4%. In other words, expenses grew faster than revenue, and without the one-off gain the margin would not have risen so much.
Net margin in the third quarter was 33.7% against 30.2% a year earlier. That increase was also partly driven by the one-off gain and by a lower share count after buybacks. Without the one-off gain, net margin would have been closer to 30%, i.e. at last year's level.
Net profit rose 5.4% despite falling revenue – helped by the one-off gain and a lower share count
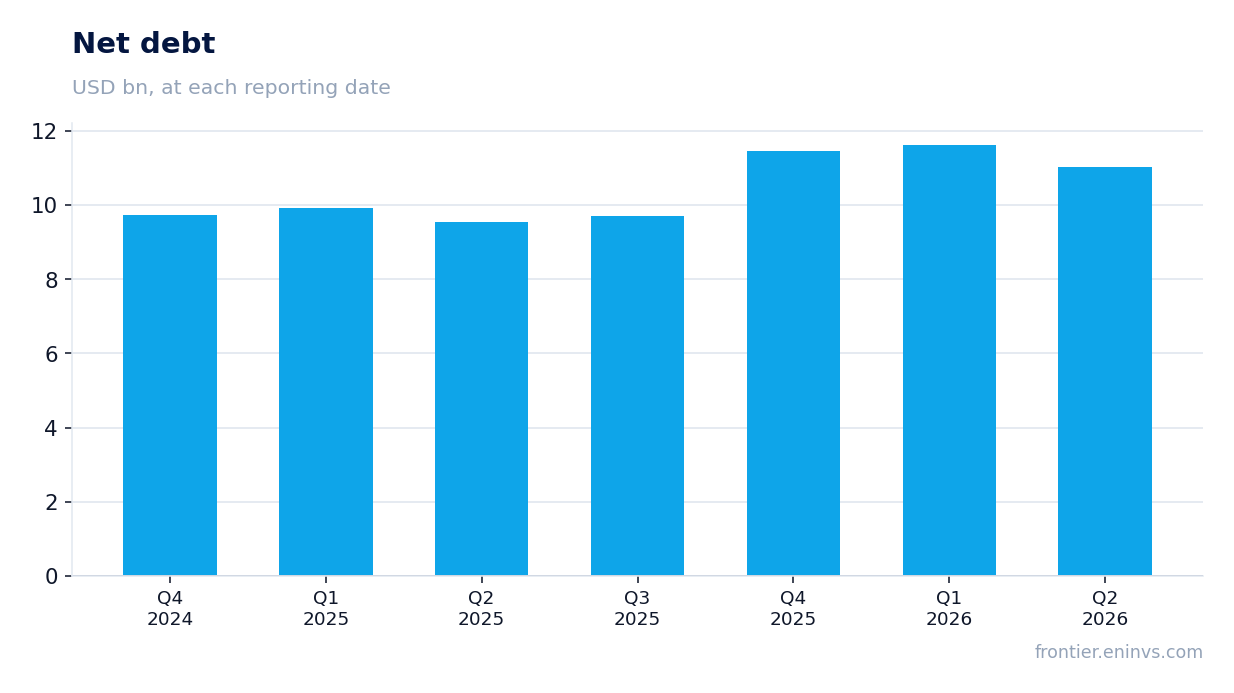
Net profit attributable to S&P Global shareholders in the third quarter of 2026 was $1,240 million against $1,176 million a year earlier, up 5.4%. This happened while revenue fell 5.4%, meaning profit grew faster than revenue thanks to the one-off gain and a lower share count.
The number of shares outstanding fell from 303.4 million to 289.9 million over the year – by 4.5%. The company repurchased $2.6 billion of shares in the third quarter and more than $4 billion year-to-date. This supports earnings per share: diluted earnings rose 26% to $4.45, while net profit rose only 5.4%.
Adjusted diluted earnings per share rose 9% to $4.58. That is a more sustainable measure, and it reflects 4% growth in adjusted profit and a 4% reduction in the share count. In other words, half of the earnings-per-share growth came from buybacks rather than organic growth.
Debt rose to $11,467 million at end-2025, while free cash flow for nine months was $3,568 million
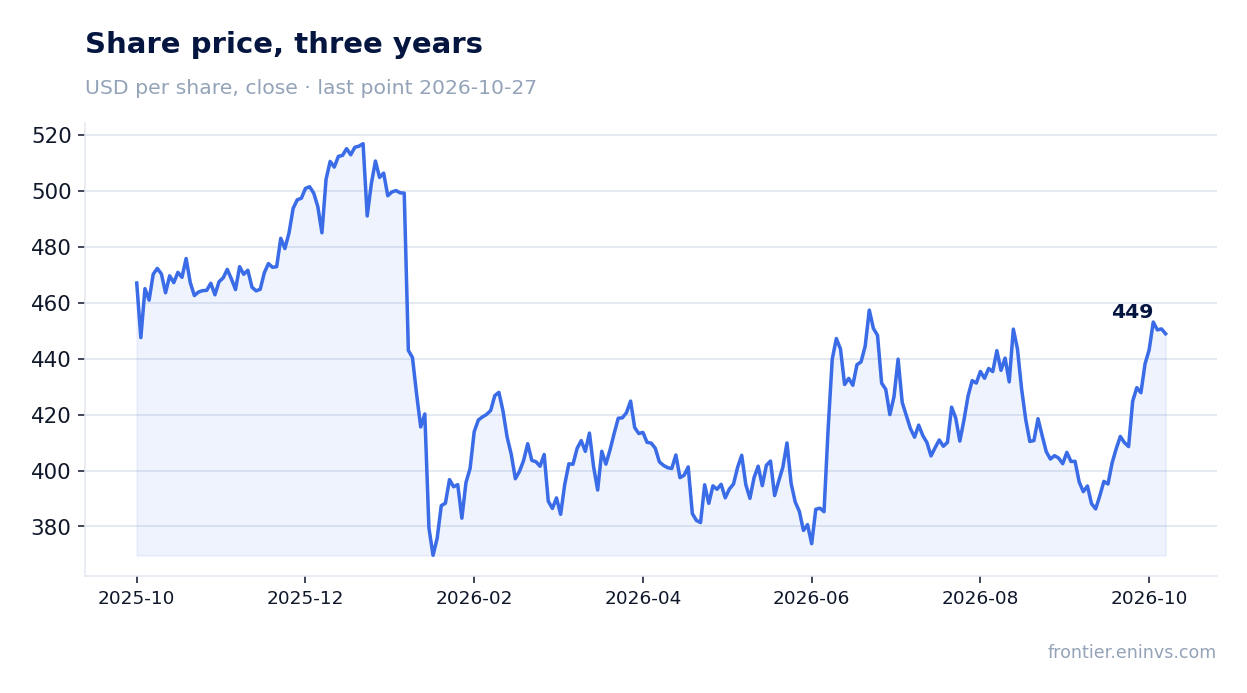
Net debt at end-2025 was $11,467 million, against $9,732 million at end-2024. The increase came mainly in the fourth quarter of 2025, when the company raised debt. Net debt at end-Q3 2026 is not disclosed in the report.
Free cash flow for the nine months of 2026 was $3,568 million – operating cash flow from continuing operations of $3,661 million minus capital expenditure of $93 million. That is a solid flow, covering $856 million of dividends and $4,100 million of buybacks. However, buybacks are funded not only by cash flow but also by debt.
Interest expense rose 10% to $87 million for the quarter. That is small relative to operating profit, but rising debt and interest expense limit flexibility. The company expects interest expense of $380–390 million for all of 2026.
The company repurchased more than $4 billion of shares year-to-date and expects more than $7 billion for all of 2026
S&P Global repurchased $4,100 million of shares in the nine months of 2026 and $2,600 million in the third quarter. The company confirmed its intention to buy back more than $7 billion for all of 2026. This is a large programme that supports earnings per share and signals management confidence.
However, buybacks are partly funded by debt: free cash flow of $3,568 million is less than the $4,100 million spent on buybacks. The gap is covered by asset sales and borrowings. This means the sustainability of buybacks depends on maintaining cash flow.
The dividend yield is 0.83% – modest. The company pays a quarterly dividend of $0.97 per share. At that yield, the main return of capital comes through buybacks rather than dividends.
The EV/EBITDA multiple of 24.1x matches its three-year average – there is no discount to its own history
The current EV/EBITDA multiple is 24.1x, almost exactly matching the three-year average of 24.05x. This means the stock is valued by the market just as it has been on average over the past three years, with no discount to its own history.
The P/E for the trailing twelve months is 30.6x. At the same time, trailing twelve-month profit of $4,471 million includes one-off gains that inflate the base. Without one-off gains, P/E would be higher, meaning the stock looks more expensive than the reported multiple suggests.
On the portal's model, the upside to fair value is estimated at +5%. That is a modest upside that does not create a margin of safety. For a stock with falling revenue and one-off gains in profit, such upside looks insufficient for a positive assessment.
Valuation on the latest reported figures
| Metric | Value |
|---|---|
| Market cap | 137 bn USD |
| P/E (LTM) | 30.6 |
| P/B | 4.40 |
| ROE | 6.4% |
| Dividend yield (12m) | 0.8% |
Bottom line
The strong side of the report remains cash flow: $3,568 million of free cash flow for nine months and more than $4 billion of buybacks. However, 5.4% profit growth against a 5.4% revenue decline is driven by the $200 million one-off gain and a lower share count, not by organic growth. Adjusted operating profit rose only 8%, which is a fairer measure of dynamics. The EV/EBITDA multiple of 24.1x matches its three-year average, and the portal model's upside is only +5%. At the current price the stock looks neutral: strong cash flow and buybacks are offset by the revenue decline and the absence of a discount to its own history.
Open the company's financial profile SPGI →
See also: market overview · valuation map · stock screeners