AT&T INC.: revenue accelerated to +5.3%, but profit nearly vanished under $3.4bn of impairments

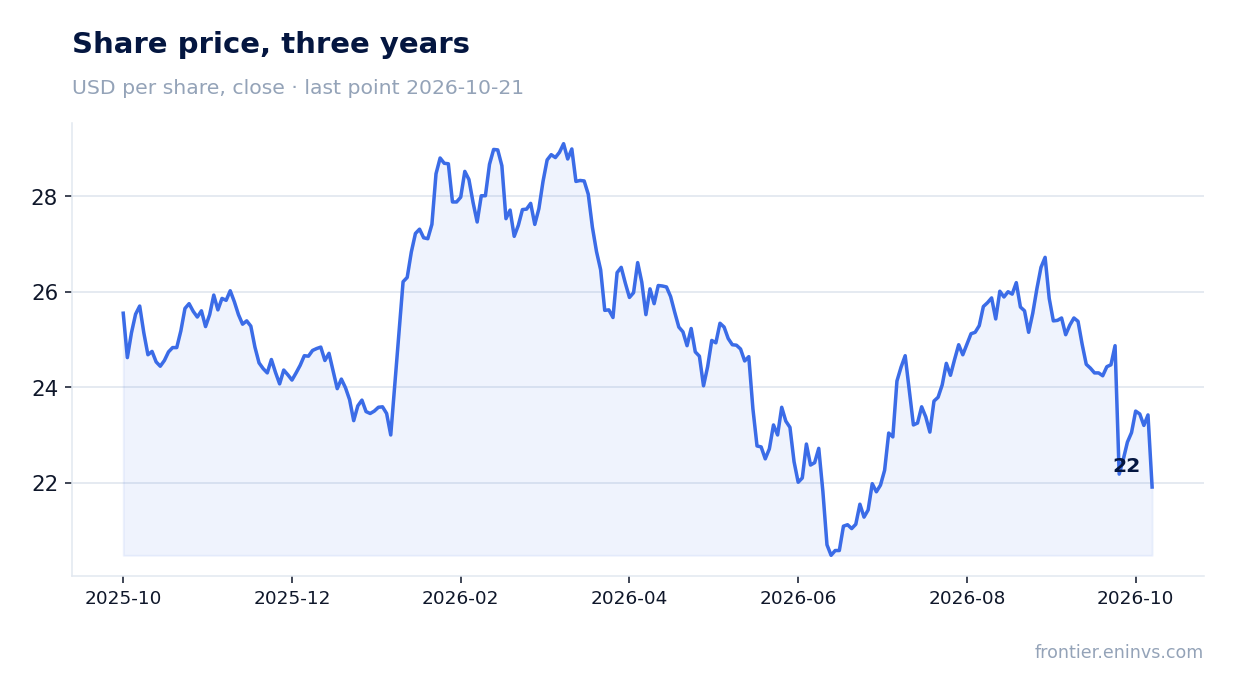
On 21 October AT&T INC. released its third-quarter 2026 results. Revenue rose 5.3% year on year to $32,322m, EBITDA fell 20.7% to $9,073m and net profit dropped 90.4% to $891m – almost all of it consumed by $3,372m of impairments and restructuring charges. The stock fell 6.4% after the release, and at EV/EBITDA of 7.0 against its own three-year average of 7.2 the share looks neutral: operating momentum is strong, but one-off charges and $148.9bn of net debt leave little room for optimism.
Key takeaways
— Revenue accelerated to +5.3% year on year, driven by Advanced Connectivity growing 7.2%
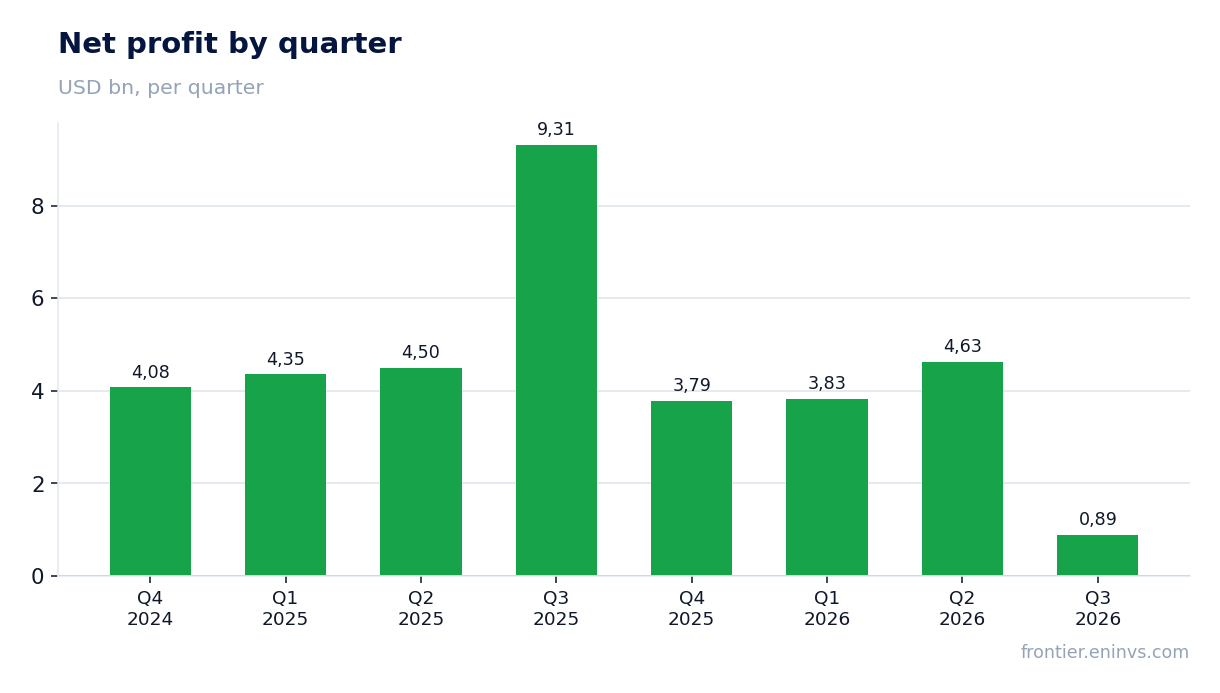
— Profit was almost wiped out by $3,372m of one-off impairments and restructuring
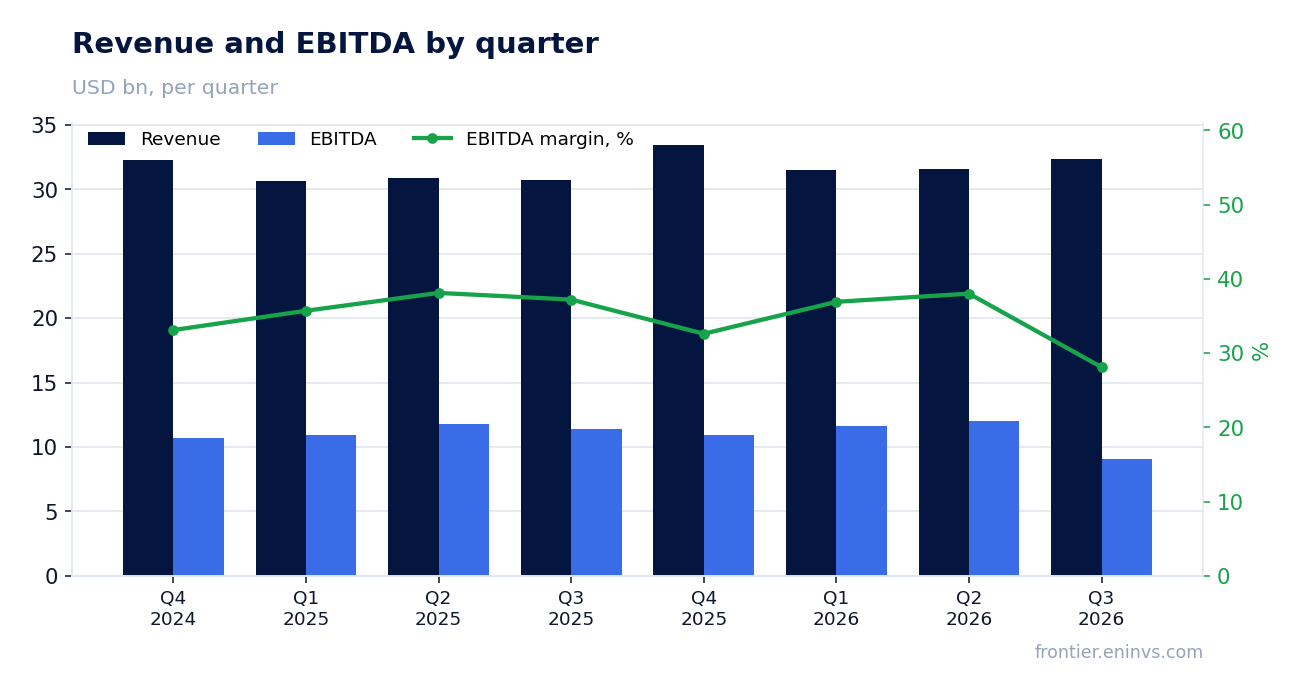
— EBITDA margin compressed to 28.1% from 37.2% a year earlier on the same one-off items
— Free cash flow for the quarter remained solid at $5,458m after capex
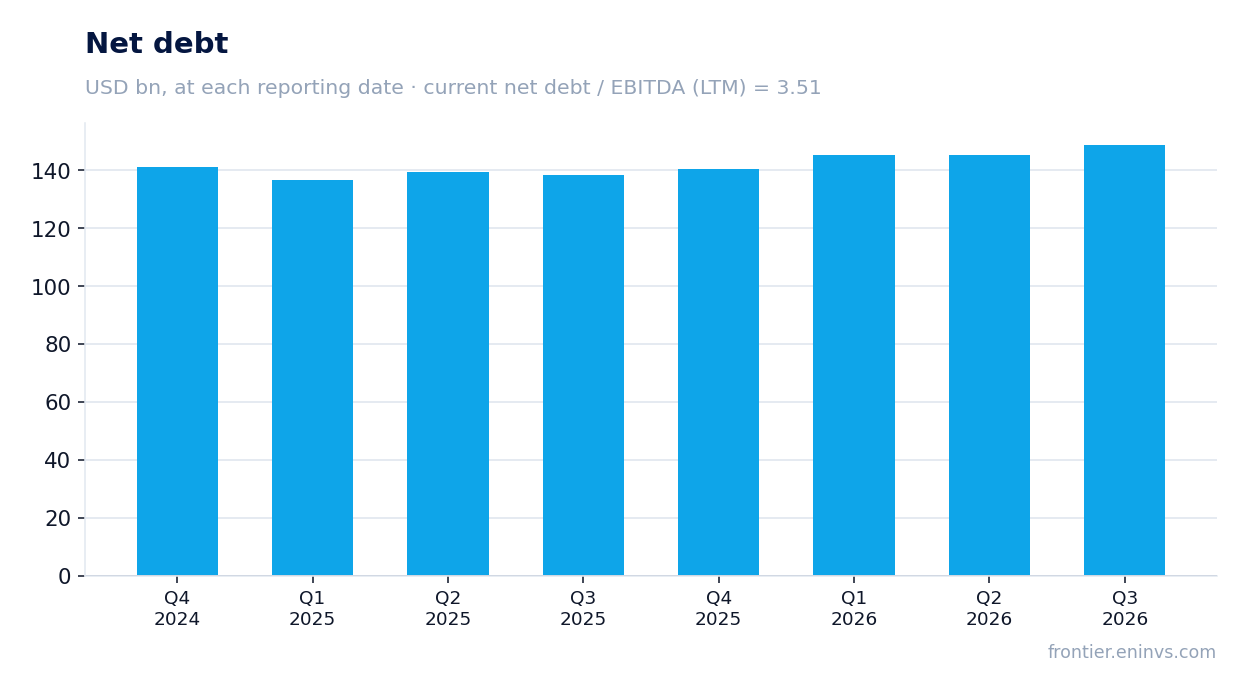
— Net debt rose to $148.9bn, with net debt/EBITDA LTM at 3.51
— Dividend yield of 5.08% on a quarterly payout of $0.2775 per share
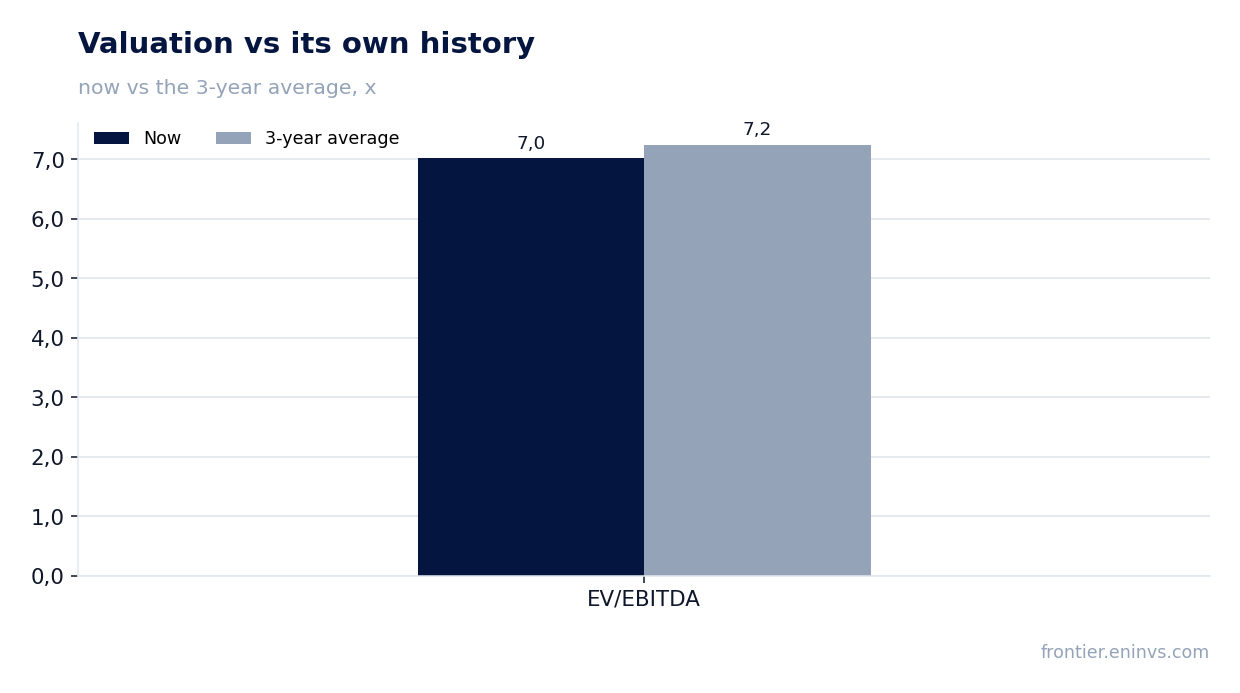
— Valuation at 7.0 EV/EBITDA LTM is essentially in line with the three-year average of 7.2
Attractiveness
Key figures, USD bn
| Metric | Q3 2025 | Q3 2026 | Change |
|---|---|---|---|
| Revenue | 30.7 | 32.3 | +5.3% |
| EBITDA | 11.4 | 9.07 | -20.7% |
| Operating profit | 6.12 | 4.09 | -33.1% |
| Net profit | 9.31 | 0.89 | -90.4% |
| Operating cash flow | 10.2 | 10.5 | +3.6% |
| Capex | 4.89 | 5.06 | +3.6% |
| EBITDA margin | 37.2% | 28.1% | -9.1 pp |
| Net margin | 30.3% | 2.8% | -27.5 pp |
Revenue accelerated to +5.3% year on year, driven by Advanced Connectivity growing 7.2%
Revenue in the third quarter of 2026 was $32,322m, up 5.3% year on year. This is a clear acceleration from the second quarter, when growth was 2.3%. The main contribution came from Advanced Connectivity: segment revenue rose 7.2% to $29,481m.
Within the segment, wireless service added 5.0% to $17,764m, while advanced home internet grew 23.4% to $2,975m. The business segment grew 3.3% to $6,433m and for the first time in a while posted operating income of $288m versus a $215m loss a year earlier.
The Legacy segment continued to shrink – down 24.5% to $1,519m – but its share of revenue is small. Latin America grew 13.2% to $1,240m, though the company has agreed to sell the business and classifies it as held for sale.
Profit was almost wiped out by $3,372m of one-off impairments and restructuring
Net income attributable to AT&T was just $891m versus $9,314m a year earlier – a 90.4% decline. The main reason is the $3,372m 'Asset impairments and abandonments and restructuring' line, which was absent a year ago.
In addition, last year's quarter included a significant other income of $6,254m related to investment revaluation, whereas this quarter it was only $590m. This comparison effect also weighs on the year-on-year profit dynamics.
Operating income fell 33.1% to $4,095m, but excluding one-off charges it would have been substantially higher. Net margin dropped to 2.8% from 30.3% a year earlier.
EBITDA margin compressed to 28.1% from 37.2% a year earlier on the same one-off items
EBITDA in the third quarter was $9,073m, down 20.7% year on year. EBITDA margin fell to 28.1% from 37.2%. The margin decline is almost entirely explained by the $3,372m of impairments and restructuring charges that hit operating expenses.
Excluding this item, EBITDA would have been around $12,445m and the margin around 38.5%, above last year's level. Thus, the operating efficiency of the business did not deteriorate but improved, yet the reported figure does not show it.
Note that in Advanced Connectivity the operating margin rose to 25.9% from 23.3%, and the business segment achieved positive profitability for the first time. This confirms that the underlying business is doing better than the consolidated statements suggest.
Free cash flow for the quarter remained solid at $5,458m after capex
Operating cash flow in the third quarter was $10,519m, capital expenditures were $5,061m. Free cash flow thus amounted to $5,458m, which covers dividend payments.
For the nine months of 2026, capital expenditures rose 11.2% to $15,638m, driven by fibre network expansion and infrastructure build-out. The company also spent $25,677m on acquisitions, including $22,842m on spectrum.
Cash flow remains the key source of dividend funding and debt reduction. Despite the rise in debt, the company retains the ability to generate free cash.
Net debt rose to $148.9bn, with net debt/EBITDA LTM at 3.51
Net debt as of 30 September 2026 was $148,860m. Since 30 June it rose by $3.5bn from $145.3bn, and over twelve months by $10.6bn from $138.2bn on 30 September 2025. The increase is linked to spectrum acquisitions and share buybacks.
The ratio of net debt to EBITDA for the last twelve months is 3.51. This is a moderate level for a telecom company, but it limits financial flexibility.
Interest expense rose 16.4% to $1,979m, reflecting higher debt and rates. Debt servicing remains a significant burden on profit.
Dividend yield of 5.08% on a quarterly payout of $0.2775 per share
The company pays a quarterly dividend of $0.2775 per share, equivalent to $1.11 annually. At the pre-release share price of $23.42, the dividend yield is 5.08%.
Payments are covered by free cash flow: $5,458m for the quarter, while dividends for nine months were $5,923m. The company remains committed to the dividend, but rising debt and capital expenditures could limit future increases.
The 5.08% yield looks attractive against current rates, but the risk is that if cash flow deteriorates, the company may slow dividend growth.
Valuation at 7.0 EV/EBITDA LTM is essentially in line with the three-year average of 7.2
EV/EBITDA for the last twelve months is 7.0, which is 3% below the three-year average of 7.2. This is in line with the historical range, and the share looks neither overvalued nor undervalued relative to its own history.
P/E LTM is 11.96, reflecting low profit due to one-off charges. On the portal's model, the upside of the share to fair value is estimated at -73%, indicating a substantial preponderance of risks.
After the release the share fell 6.4% to $21.92, which may make the valuation slightly more attractive, but fundamental risks remain.
Valuation on the latest reported figures
| Metric | Value |
|---|---|
| Market cap | 157 bn USD |
| P/E (LTM) | 12.0 |
| EV/EBITDA (LTM) | 7.0 |
| P/B | 1.24 |
| Net debt / EBITDA (LTM) | 3.51 |
| Operating cash flow (LTM) | 40.3 bn |
| ROE | 1.0% |
| Dividend yield (12m) | 5.1% |
| EV/EBITDA, 3-year average | 7.2 |
Bottom line
The strong side of the report is revenue acceleration to 5.3% and growth in Advanced Connectivity, as well as solid free cash flow. The weak side is $3,372m of one-off impairments that wiped out profit and a rise in debt to $148.9bn. Valuation at 7.0 EV/EBITDA is essentially in line with the historical average, while the portal model points to -73% upside. Verdict – neutral: operating momentum is good, but one-off factors and debt burden do not provide sufficient grounds for a positive view.
Open the company's financial profile T →
See also: market overview · valuation map · stock screeners