Talen Energy Corporation: revenue doubled, but profit fell by a third and debt stands at 20.9x LTM EBITDA
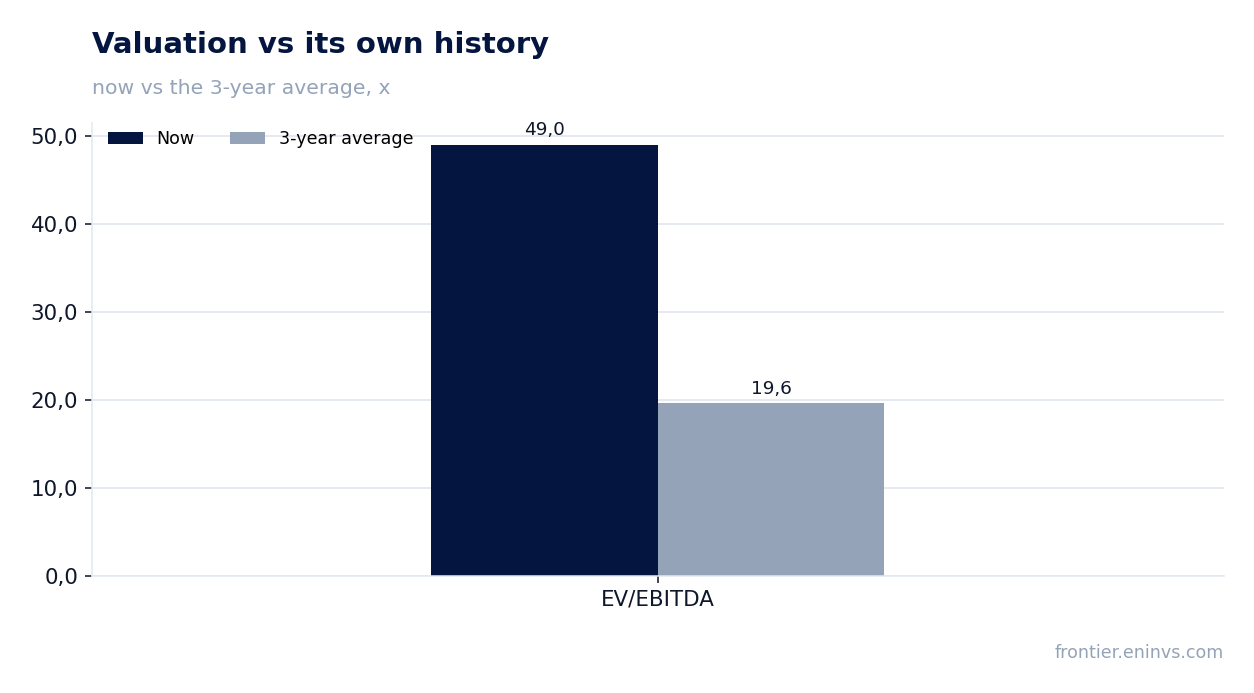
On 3 November Talen Energy Corporation reported results for the third quarter of 2026. Revenue rose 104.8% year on year to USD 1,663.0 million, EBITDA added 27.2% to USD 412.0 million, while net profit fell 33.3% to USD 138.0 million. Revenue growth accelerated from 41.9% in the second quarter, but the margin compressed, and net debt stood at USD 9,257.0 million at 30 September 2026, or 20.94x trailing-twelve-month EBITDA. With an EV/EBITDA LTM of 49.0 against its own three-year average of 19.6, the share looks expensive, hence the verdict is neutral.
Key takeaways
— Revenue rose 104.8% to USD 1,663.0 million in the third quarter, accelerating from 41.9% in the second quarter
— EBITDA added 27.2% to USD 412.0 million, but its margin fell to 24.8% from 39.9% a year earlier
— Net profit declined 33.3% to USD 138.0 million, with the margin compressing to 8.3% from 25.5%
— Operating cash flow for the quarter was USD 463.0 million against capital expenditure of USD 167.0 million
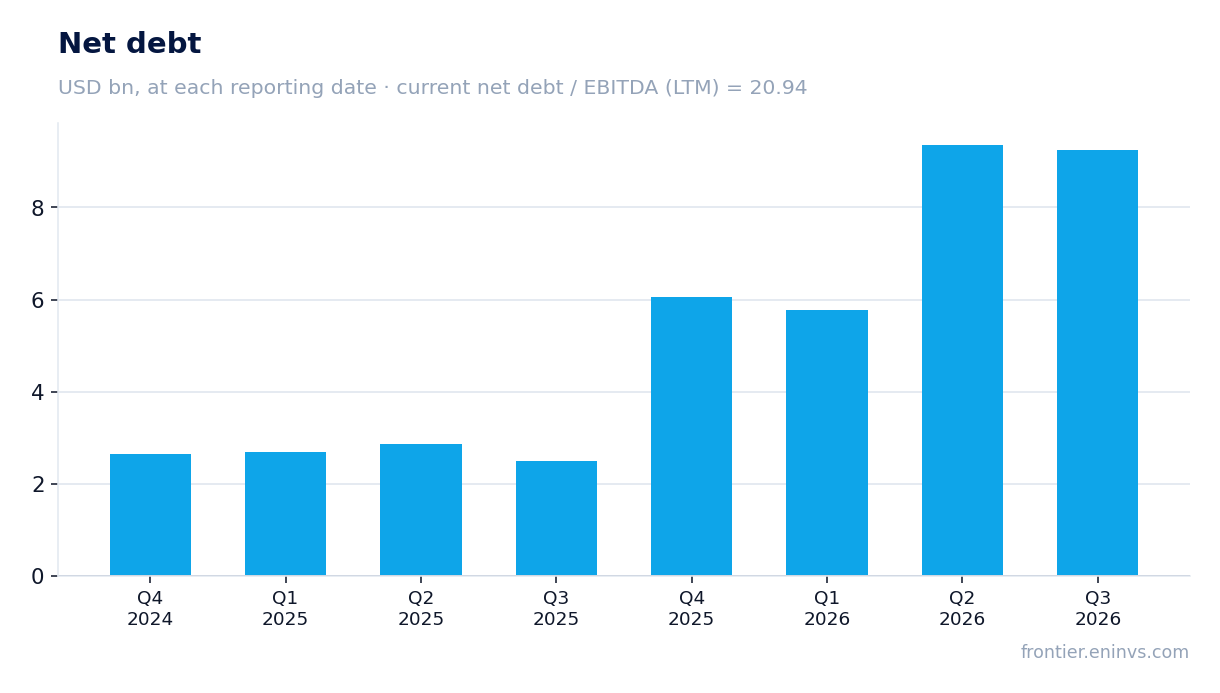
— Net debt stood at USD 9,257.0 million at 30 September 2026, or 20.94x trailing-twelve-month EBITDA
— EV/EBITDA LTM of 49.0 against its own three-year average of 19.6 makes the share 150% more expensive than its history
Attractiveness
Key figures, USD bn
| Metric | Q3 2025 | Q3 2026 | Change |
|---|---|---|---|
| Revenue | 0.81 | 1.66 | +104.8% |
| EBITDA | 0.32 | 0.41 | +27.2% |
| Operating profit | 0.26 | 0.26 | -3.0% |
| Net profit | 0.21 | 0.14 | -33.3% |
| Operating cash flow | 0.49 | 0.46 | -5.3% |
| Capex | 0.02 | 0.17 | +695.2% |
| EBITDA margin | 39.9% | 24.8% | -15.1 pp |
| Net margin | 25.5% | 8.3% | -17.2 pp |
Revenue rose 104.8% to USD 1,663.0 million in the third quarter, accelerating from 41.9% in the second quarter
Revenue for the third quarter of 2026 was USD 1,663.0 million, double the USD 812.0 million a year earlier. Growth accelerated: it was 41.9% in the second quarter and 104.8% now. This is the fastest pace since the first quarter, when revenue grew 189.5%.
The acceleration rests on a low base in the third quarter of 2025, but sequential growth is also visible: revenue rose by USD 769.0 million against the second quarter. The company does not disclose in the supplied materials which segment made the main contribution, so we limit ourselves to stating that growth is broad and manifold.
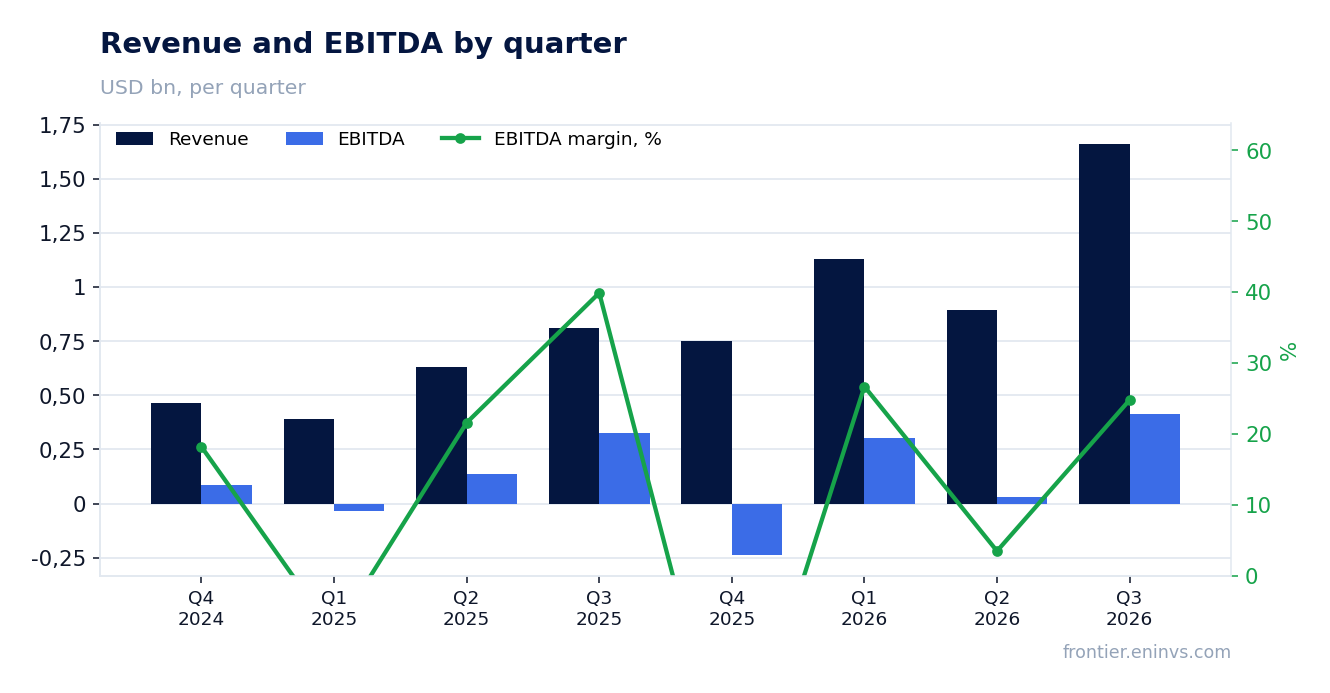
EBITDA added 27.2% to USD 412.0 million, but its margin fell to 24.8% from 39.9% a year earlier
EBITDA for the third quarter of 2026 was USD 412.0 million against USD 324.0 million a year earlier, up 27.2%. That is several times slower than revenue growth, so the margin compressed to 24.8% from 39.9% in the third quarter of 2025.
Operating profit was USD 255.0 million, meaning depreciation and other non-cash items accounted for USD 157.0 million. With revenue doubling, costs are rising faster – otherwise the margin would not have fallen by 15.1 percentage points. The supplied materials do not break down cost lines, so the specific cause of the compression cannot be named.
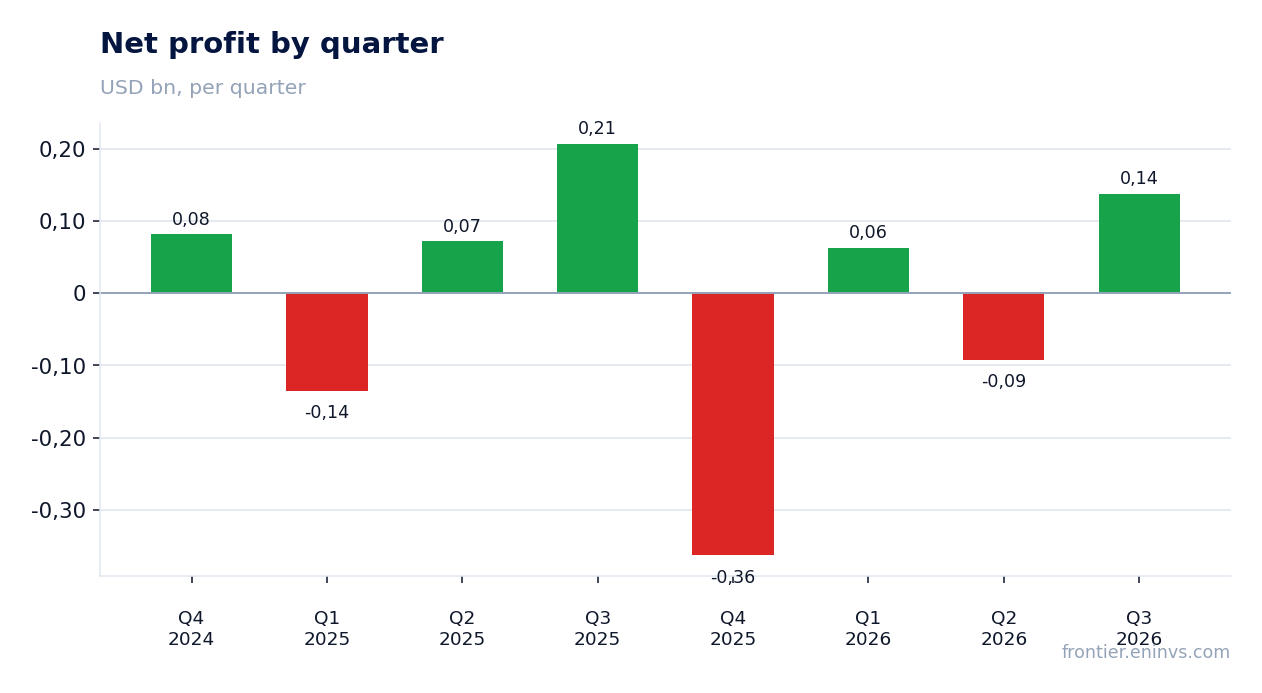
Net profit declined 33.3% to USD 138.0 million, with the margin compressing to 8.3% from 25.5%
Net profit for the third quarter of 2026 was USD 138.0 million against USD 207.0 million a year earlier, down 33.3%. The net margin fell to 8.3% from 25.5%.
The gap between operating profit of USD 255.0 million and net profit of USD 138.0 million – USD 117.0 million – is interest and taxes. With net debt of USD 9,257.0 million, the interest burden is significant and consumes a growing share of the operating result. Profit is falling while revenue grows precisely because of this gap.
Operating cash flow for the quarter was USD 463.0 million against capital expenditure of USD 167.0 million
Operating cash flow for the third quarter of 2026 was USD 463.0 million, with capital expenditure of USD 167.0 million. Free cash flow after capex is about USD 296.0 million, which covers interest expense but leaves little room to reduce debt.
Over the trailing twelve months operating cash flow was USD 770.0 million. Against net debt of USD 9,257.0 million, that is enough only to service obligations, not to cut them quickly. Capital expenditure for the quarter rose to USD 167.0 million from USD 21.0 million a year earlier – the investment programme has accelerated.
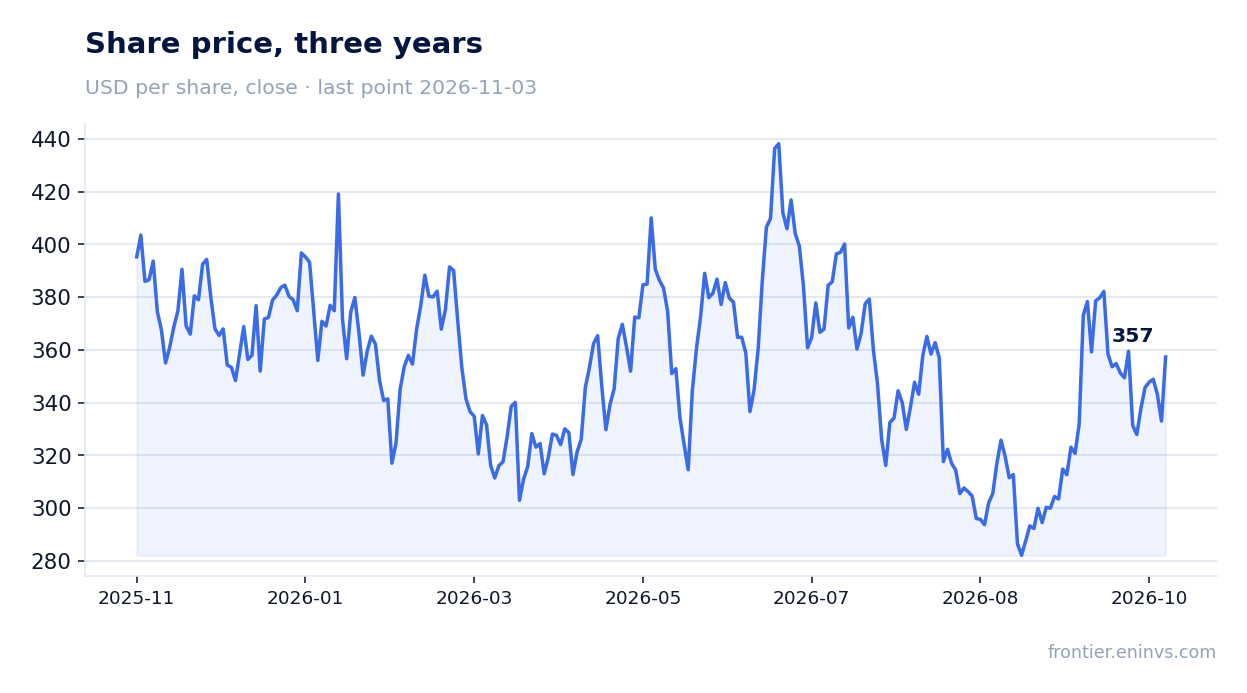
Net debt stood at USD 9,257.0 million at 30 September 2026, or 20.94x trailing-twelve-month EBITDA
Net debt at 30 September 2026 was USD 9,257.0 million. Against 30 June 2026 it declined from USD 9,364.0 million to USD 9,257.0 million, a change of USD 107.0 million. Over the year it rose: at 30 September 2025 it was USD 2,489.0 million, a change of plus USD 6,768.0 million.
The ratio of net debt to trailing-twelve-month EBITDA is 20.94x. At this level interest expense becomes the main constraint on profit. The USD 107.0 million debt reduction over the quarter against operating cash flow of USD 463.0 million means most of the flow goes to interest and investment rather than repayment.
EV/EBITDA LTM of 49.0 against its own three-year average of 19.6 makes the share 150% more expensive than its history
The EV/EBITDA multiple for the trailing twelve months is 49.0 against its own three-year average of 19.6. The share trades 150% above its history on this multiple. Market capitalisation is USD 15.5 billion against net debt of USD 9.3 billion.
The high multiple is explained by the low trailing-twelve-month EBITDA base of USD 442.0 million. If quarterly EBITDA of USD 412.0 million is sustained, the annual figure will be materially higher and the multiple will normalise. But for now the market is paying for future growth, not current profit.
Valuation on the latest reported figures
| Metric | Value |
|---|---|
| Market cap | 15.5 bn USD |
| EV/EBITDA (LTM) | 49.0 |
| P/B | 14.22 |
| Net debt / EBITDA (LTM) | 20.94 |
| Operating cash flow (LTM) | 0.77 bn |
| ROE | 11.5% |
| EV/EBITDA, 3-year average | 19.6 |
Bottom line
The strong side of the report is revenue: USD 1,663.0 million and acceleration to 104.8% from 41.9% in the second quarter. The weak side is profit: net profit fell 33.3% to USD 138.0 million, the margin compressed to 8.3%, and EBITDA grew only 27.2%. Debt of USD 9,257.0 million, or 20.94x trailing-twelve-month EBITDA, remains the main constraint. The EV/EBITDA LTM multiple of 49.0 against a three-year average of 19.6 shows the market has already priced in a strong profit recovery. The verdict is neutral: revenue growth is real, but profit and debt prevent the share from being called attractive at the current level.
Open the company's financial profile TLN →
See also: market overview · valuation map · stock screeners