THERMO FISHER SCIENTIFIC INC.: revenue up 9.1%, but profit lags on one-off charges and rising interest
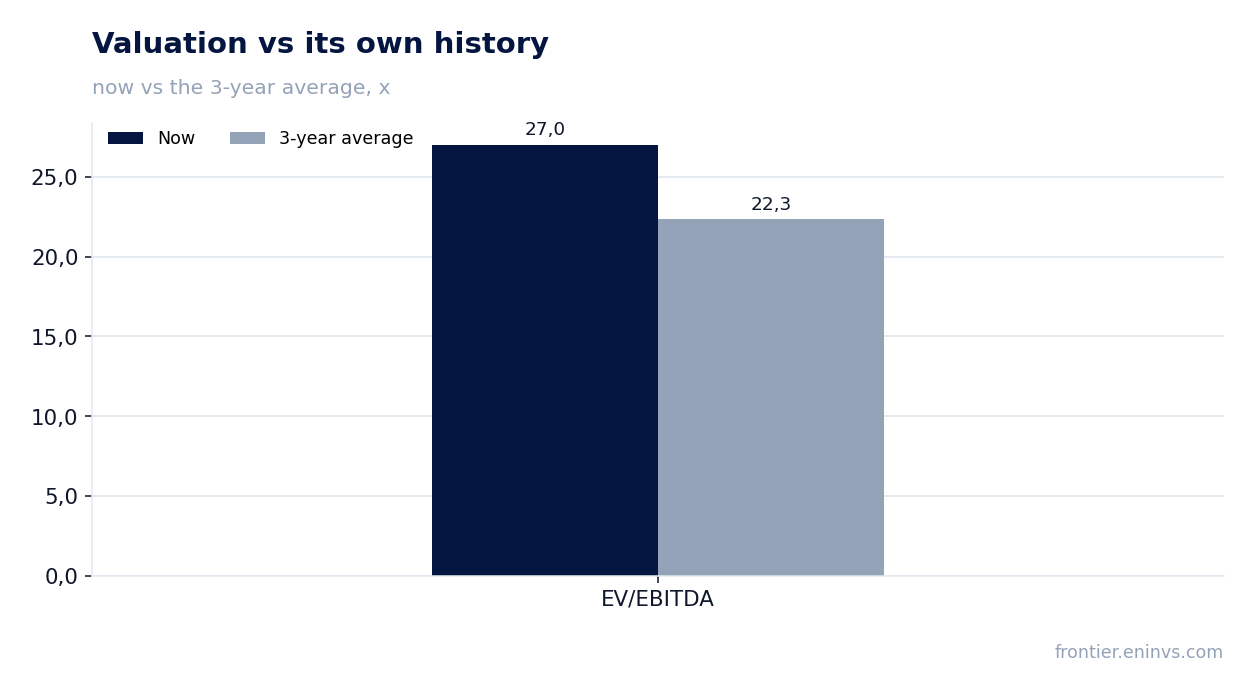
On 21 October THERMO FISHER SCIENTIFIC INC. reported results for the third quarter of 2026. Revenue rose 9.1% year on year to USD 12,137 million, operating profit reached USD 2,263 million and net profit USD 1,721 million (+6.5%). Revenue growth decelerated from +10.5% in the second quarter, while the net margin slipped to 14.2% from 14.5% a year earlier. The share trades above its own history on EV/EBITDA (27.0 versus a three-year average of 22.3), and at the current price the stock looks neutral: strong operating momentum is offset by a rich valuation and one-off items in profit.
Key takeaways
— Revenue rose 9.1% year on year, but organic growth was only 6% – the rest came from acquisitions
— Operating margin improved to 18.6% from 17.4% as cost of revenues fell as a share of sales
— Net profit grew 6.5%, lagging operating profit on higher interest expense and one-off charges
— Adjusted EPS rose 15% – the gap with GAAP is driven by amortisation and restructuring
— Free cash flow for nine months rose to USD 4,618 million, though quarterly capex remains high
— Leverage at 2.87x LTM EBITDA is moderate, but interest is consuming a growing share of profit
— The share trades at EV/EBITDA of 27.0 – 21% above its own three-year average
Attractiveness
Key figures, USD bn
| Metric | Q3 2025 | Q3 2026 | Change |
|---|---|---|---|
| Revenue | 11.1 | 12.1 | +9.1% |
| EBITDA | 2.60 | — | — |
| Operating profit | 1.94 | 2.26 | +16.6% |
| Net profit | 1.62 | 1.72 | +6.5% |
| Operating cash flow | 2.24 | 2.55 | +13.9% |
| Capex | 0.40 | — | — |
| EBITDA margin | 23.4% | — | — |
| Net margin | 14.5% | 14.2% | -0.3 pp |
Revenue rose 9.1% year on year, but organic growth was only 6% – the rest came from acquisitions
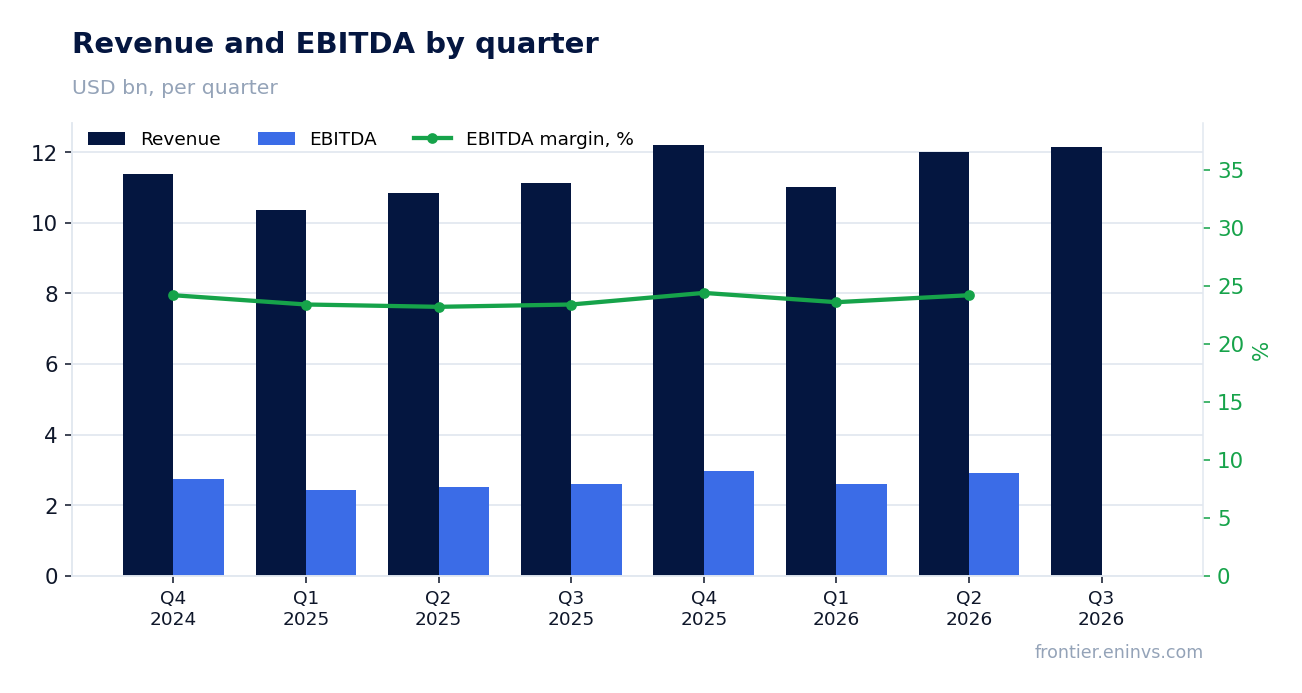
Revenue for the third quarter of 2026 was USD 12,137 million, up 9.1% from a year earlier (USD 11,122 million). Growth decelerated from 10.5% in the second quarter. Organic growth, per the release, was 6%, acquisitions/divestitures added 3% and currency translation 0%.
Laboratory Products and Biopharma Services was the main contributor: USD 6,863 million, or 56.5% of consolidated revenue, versus USD 5,970 million a year earlier. Life Sciences Solutions rose to USD 2,719 million and Analytical Instruments to USD 2,002 million. Specialty Diagnostics declined to USD 1,098 million from USD 1,174 million.
The deceleration from 10.5% to 9.1% is a meaningful signal. The company sustains double-digit growth only through deals, while organic momentum remains moderate. Further acceleration would require either a new acquisition cycle or a pickup in organic growth, which the release does not show.
Operating margin improved to 18.6% from 17.4% as cost of revenues fell as a share of sales
Operating profit for the third quarter of 2026 was USD 2,263 million versus USD 1,941 million a year earlier, up 17%. The operating margin rose to 18.6% from 17.4%. The main driver was a lower cost of revenues share: 57.2% of revenue versus 58.2% a year earlier.
Adjusted operating margin, per the release, reached 24.5% versus 23.3%. The gap between GAAP and adjusted margin is driven by amortisation of acquired intangibles (USD 519 million) and restructuring charges (USD 199 million). These are non-cash items but reflect real integration costs.
Margin improvement alongside decelerating revenue is a good sign: the company is offsetting slower growth with efficiency gains. Whether this improvement holds depends on how long the cost-of-revenue benefit lasts and whether expenses revert.
Net profit grew 6.5%, lagging operating profit on higher interest expense and one-off charges
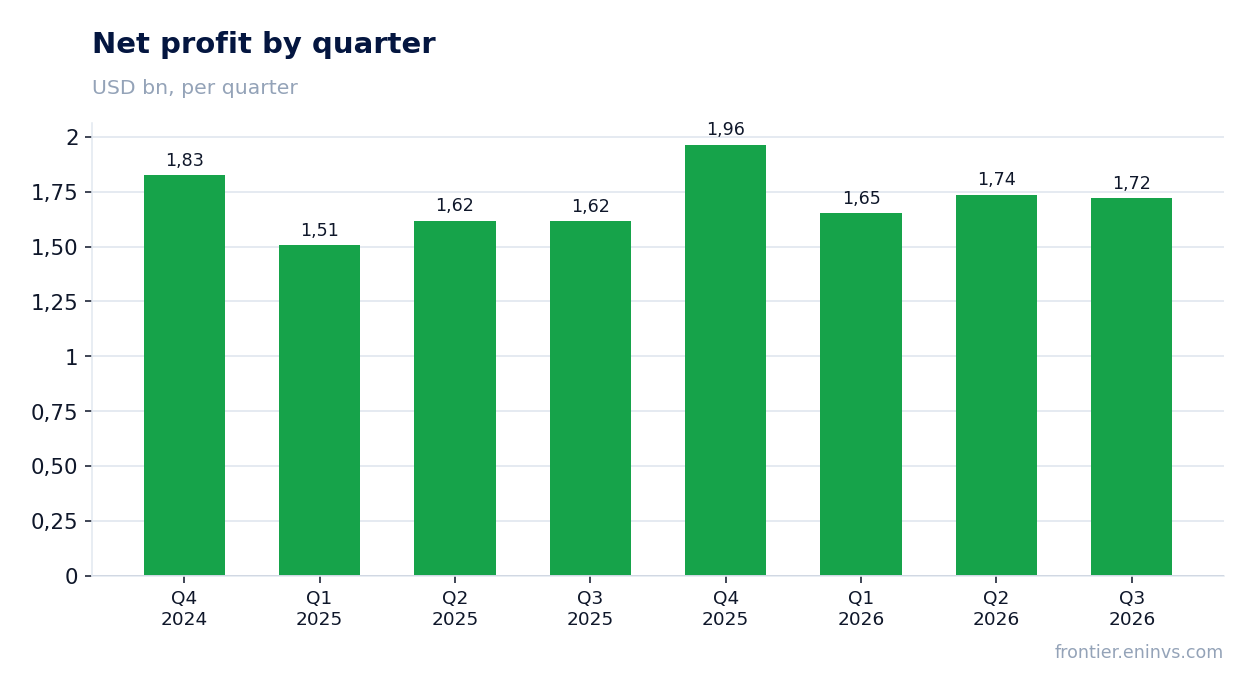
Net profit attributable to shareholders for the third quarter of 2026 was USD 1,721 million versus USD 1,616 million a year earlier, up 6.5%. That is markedly slower than operating profit (+17%). The net margin slipped to 14.2% from 14.5%.
The gap is explained by two factors. Interest expense rose to USD 417 million from USD 347 million a year earlier, absorbing part of the operating improvement. In addition, the quarter included one-off items: a USD 244 million held-for-sale loss and a USD 72 million gain on the sale of a business. These ran through restructuring and are excluded from adjusted profit.
Adjusted EPS rose 15% to USD 6.68, while the GAAP figure added 9% to USD 4.64. The USD 2.04 per-share gap is amortisation, restructuring and one-off charges. Investors should note that adjusted profit excludes real economic costs, but it better reflects operating momentum.
Adjusted EPS rose 15% – the gap with GAAP is driven by amortisation and restructuring
Adjusted EPS for the third quarter of 2026 was USD 6.68 versus USD 5.79 a year earlier, up 15%. The GAAP figure rose 9% to USD 4.64. The USD 2.04 per-share gap is made up of amortisation of acquired intangibles (USD 1.40), restructuring charges (USD 0.54) and tax adjustments.
Amortisation of acquired intangibles is the largest component of the gap. It reflects the cost of past deals and is non-cash, but its size grows with acquisitions. Restructuring of USD 199 million includes the USD 244 million held-for-sale loss and the USD 72 million gain on the sale of a business.
Adjusted profit growth of 15% against revenue growth of 9.1% shows the company is improving profitability. Whether this holds depends on how long the cost-of-revenue benefit lasts and whether expenses revert.
Free cash flow for nine months rose to USD 4,618 million, though quarterly capex remains high
Operating cash flow for the third quarter of 2026 was USD 2,551 million versus USD 2,239 million a year earlier. Free cash flow for nine months reached USD 4,618 million versus USD 3,319 million a year earlier. Quarterly capex was USD 437 million, above USD 404 million a year earlier.
Free cash flow growth of 39% for nine months is a strong result that confirms the company's ability to generate cash. However, quarterly capex remains high, and for nine months it was USD 1,263 million. The company also spent USD 8,877 million on acquisitions, which explains the rise in debt.
Free cash flow covers dividends and buybacks. Over nine months the company repurchased USD 4,000 million of shares and paid USD 511 million in dividends. This shows the company is returning capital to shareholders, but partly funded by new debt.
Leverage at 2.87x LTM EBITDA is moderate, but interest is consuming a growing share of profit
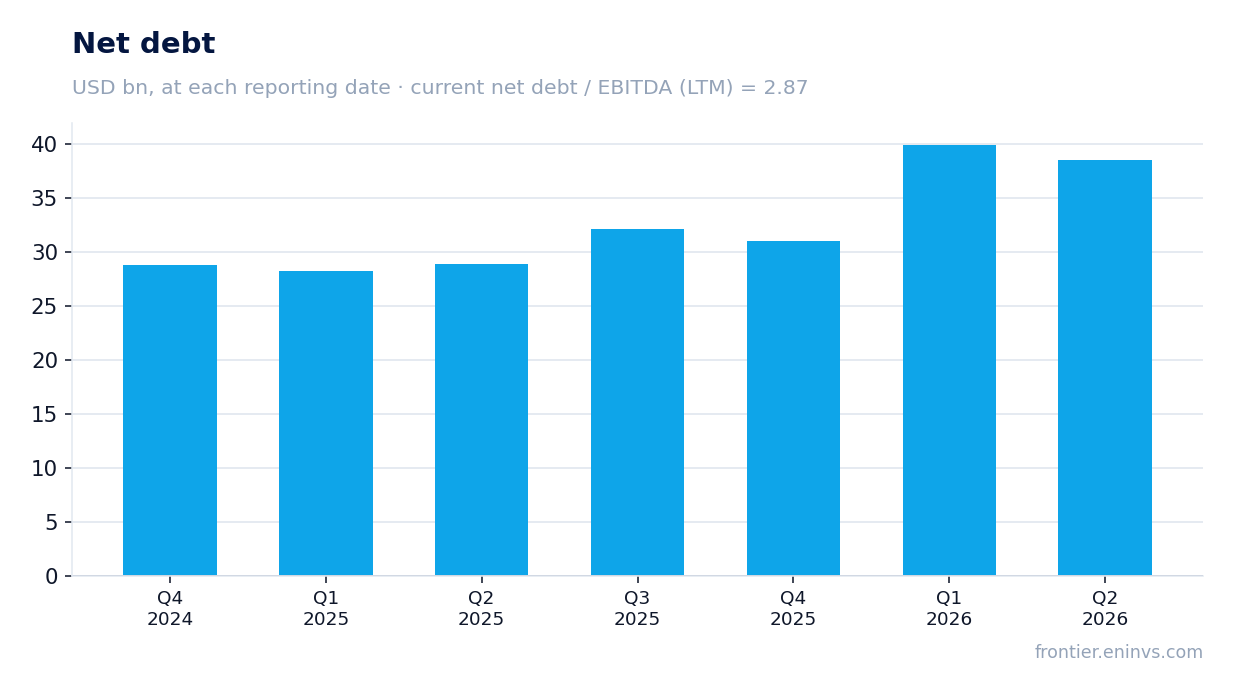
Net debt at the latest annual balance sheet was USD 31,003 million, equivalent to 2.87x LTM EBITDA. That is a moderate level for a company with this cash flow. However, debt has risen: over nine months the company raised USD 5,238 million of new debt and spent USD 8,877 million on acquisitions.
Interest expense for the third quarter rose to USD 417 million from USD 347 million a year earlier. Interest income was USD 252 million. Net interest expense is growing faster than operating profit, pressuring the net margin. The 2.87x net debt/EBITDA is a level, not a direction: the facts do not include an earlier value, so it cannot be said whether leverage rose or fell.
To sustain growth the company can keep making acquisitions, but that will increase debt and interest expense. If rates stay high, pressure on net profit will persist.
The share trades at EV/EBITDA of 27.0 – 21% above its own three-year average
EV/EBITDA for the last twelve months is 27.0 versus a three-year average of 22.3. That is 21% above its own history. P/E LTM is 36.9. Market capitalisation is USD 261,105 million. On the portal's model, the upside to fair value is +9%.
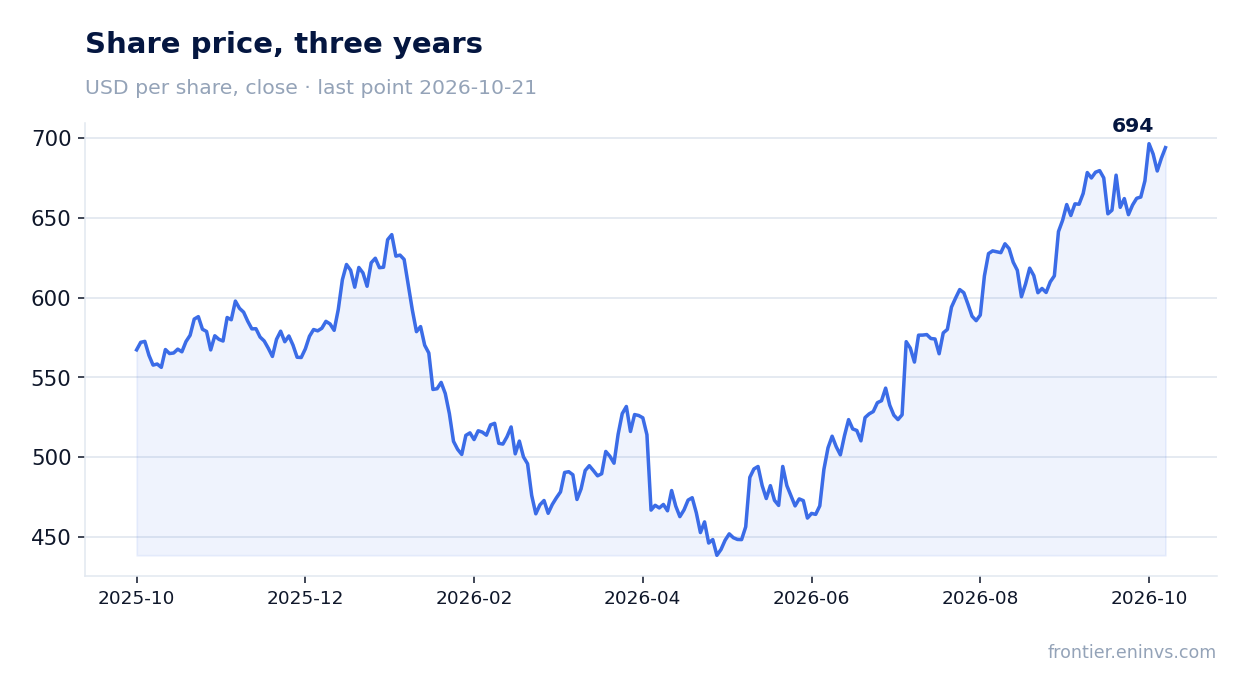
A rich valuation means the market is already pricing in continued growth. Yet revenue is decelerating and the net margin is slipping. If growth continues, the multiple can stay high, but further expansion needs either faster profit growth or lower rates.
Dividend yield for the last twelve months is only 0.27%. The company prefers buybacks: over nine months it repurchased USD 4,000 million of shares. That supports the share price but gives the investor little current income.
Valuation on the latest reported figures
| Metric | Value |
|---|---|
| Market cap | 261 bn USD |
| P/E (LTM) | 36.9 |
| EV/EBITDA (LTM) | 27.0 |
| P/B | 4.89 |
| Net debt / EBITDA (LTM) | 2.87 |
| Operating cash flow (LTM) | 9.32 bn |
| ROE | 4.3% |
| Dividend yield (12m) | 0.3% |
| EV/EBITDA, 3-year average | 22.3 |
Bottom line
The strong part of the report is the operating margin rising to 18.6% from 17.4% and free cash flow for nine months reaching USD 4,618 million. The weak part is net profit growing only 6.5% on interest expense and one-off charges, with revenue decelerating. The share trades 21% above its own history on EV/EBITDA, and at the current price it looks neutral: the portal model's upside is +9%, but much of it is already priced in. A better verdict would require either sustained organic growth or lower leverage.
Open the company's financial profile TMO →
See also: market overview · valuation map · stock screeners