T-Mobile US, Inc.: profit up 27.3% while net debt fell by USD 35.6 bn in the quarter

On 28 October T-Mobile US, Inc. reported results for the third quarter of 2026. Revenue came in at USD 23,584.0 mn (+7.4% YoY), EBITDA at USD 9,113.0 mn (+14.8%), net profit at USD 3,455.0 mn (+27.3%), while net debt shrank to USD 723.0 mn on 30 September from USD 36.3 bn on 30 June. The stock trades at 5.0x EV/EBITDA against its own three-year average of 10.9, and at that level the share looks attractive.
Key takeaways
— Revenue grew 7.4% YoY, with the pace roughly unchanged from 7.9% a quarter earlier
— EBITDA rose 14.8% and the margin climbed to 38.6% from 36.2% a year earlier
— Net profit added 27.3%, lifting the margin to 14.6% from 12.4% a year earlier
— Free cash flow for the quarter reached USD 5,071.0 mn after USD 2,270.0 mn of capex
— Net debt shrank to USD 723.0 mn from USD 36.3 bn on 30 June – down USD 35.6 bn in the quarter
— The dividend yields 2.76% and is comfortably covered by profit
— The 5.0x EV/EBITDA multiple sits 55% below its own three-year average of 10.9, and the portal model implies 36% upside
Attractiveness
Key figures, USD bn
| Metric | Q3 2025 | Q3 2026 | Change |
|---|---|---|---|
| Revenue | 22.0 | 23.6 | +7.4% |
| EBITDA | 7.94 | 9.11 | +14.8% |
| Operating profit | 4.53 | 5.66 | +25.0% |
| Net profit | 2.71 | 3.46 | +27.3% |
| Operating cash flow | 7.46 | 7.34 | -1.6% |
| Capex | 2.64 | 2.27 | -14.0% |
| EBITDA margin | 36.2% | 38.6% | +2.4 pp |
| Net margin | 12.4% | 14.6% | +2.2 pp |
Revenue grew 7.4% YoY, with the pace roughly unchanged from 7.9% a quarter earlier
Revenue for the third quarter of 2026 came in at USD 23,584.0 mn, up 7.4% from a year earlier. A quarter earlier growth was 7.9%, so the pace is roughly unchanged: the company has held the same speed for two consecutive quarters.
For comparison, revenue grew 11.3% in Q4 2025 and 10.6% in Q1 2026. The slowdown into the summer reflects a high base from last year rather than weakening demand: the absolute revenue level in Q3 2026 is the highest of the last four quarters.
The resilience of the pace matters for valuation: at 5.0x EV/EBITDA the market is pricing in either a growth stall or margin compression. Neither is visible in the report.
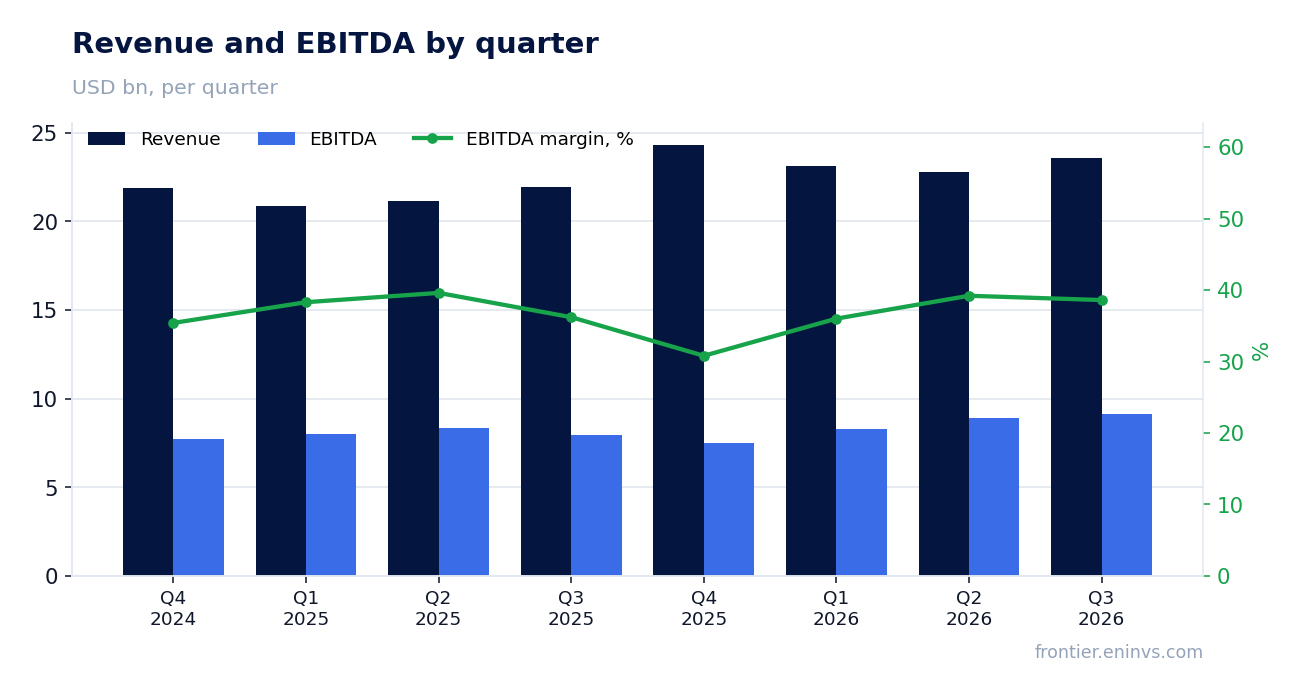
EBITDA rose 14.8% and the margin climbed to 38.6% from 36.2% a year earlier
EBITDA for Q3 2026 reached USD 9,113.0 mn, 14.8% above the year-earlier level. That is nearly twice the revenue growth rate, so the margin rose to 38.6% from 36.2% in Q3 2025.
Operating profit increased to USD 5,661.0 mn from USD 4,530.0 mn a year earlier – up 25.0%. The gap between EBITDA and operating profit growth means depreciation grew more slowly than revenue, and items below the operating line did not erode the improvement.
A 38.6% margin is a strong result for a telecom, and it was achieved on revenue growth of just 7.4%. That suggests the company is earning more from each dollar of revenue rather than simply scaling up.
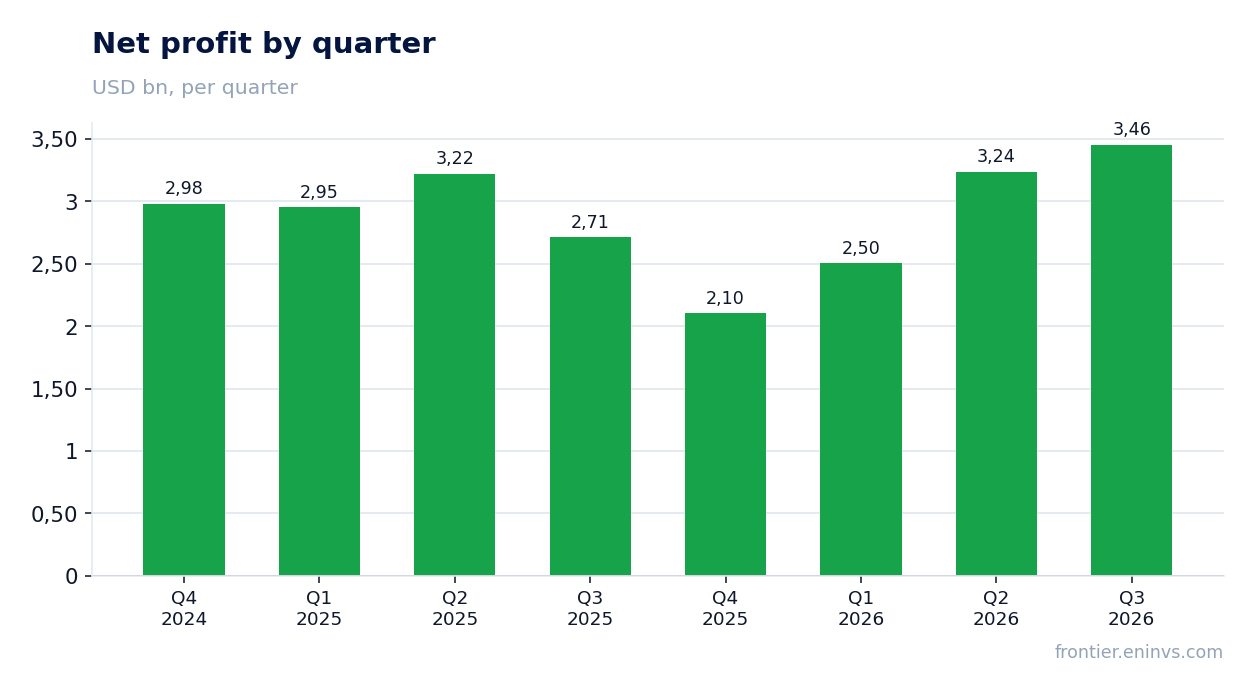
Net profit added 27.3%, lifting the margin to 14.6% from 12.4% a year earlier
Net profit for Q3 2026 came to USD 3,455.0 mn, 27.3% above the year-earlier figure. The net margin rose to 14.6% from 12.4% in Q3 2025.
Profit growing faster than EBITDA reflects interest expense and taxes not rising proportionally. Net debt at quarter-end was just USD 723.0 mn, so the interest burden is minimal.
Trailing twelve-month profit was USD 11,301.0 mn. Against a market capitalisation of USD 167,489.8 mn that gives a P/E of 14.8 – a moderate valuation for a company growing profit at a double-digit pace.
Free cash flow for the quarter reached USD 5,071.0 mn after USD 2,270.0 mn of capex
Operating cash flow for Q3 2026 was USD 7,341.0 mn, with capital expenditure of USD 2,270.0 mn. Free cash flow – the difference between the two – is USD 5,071.0 mn.
Capex fell from USD 2,639.0 mn a year earlier even as revenue grew. That means the company is spending less to maintain and upgrade its network while revenue rises – a rare combination for a telecom.
Over the trailing twelve months operating cash flow was USD 28,717.0 mn. That comfortably covers the dividend and further debt reduction.
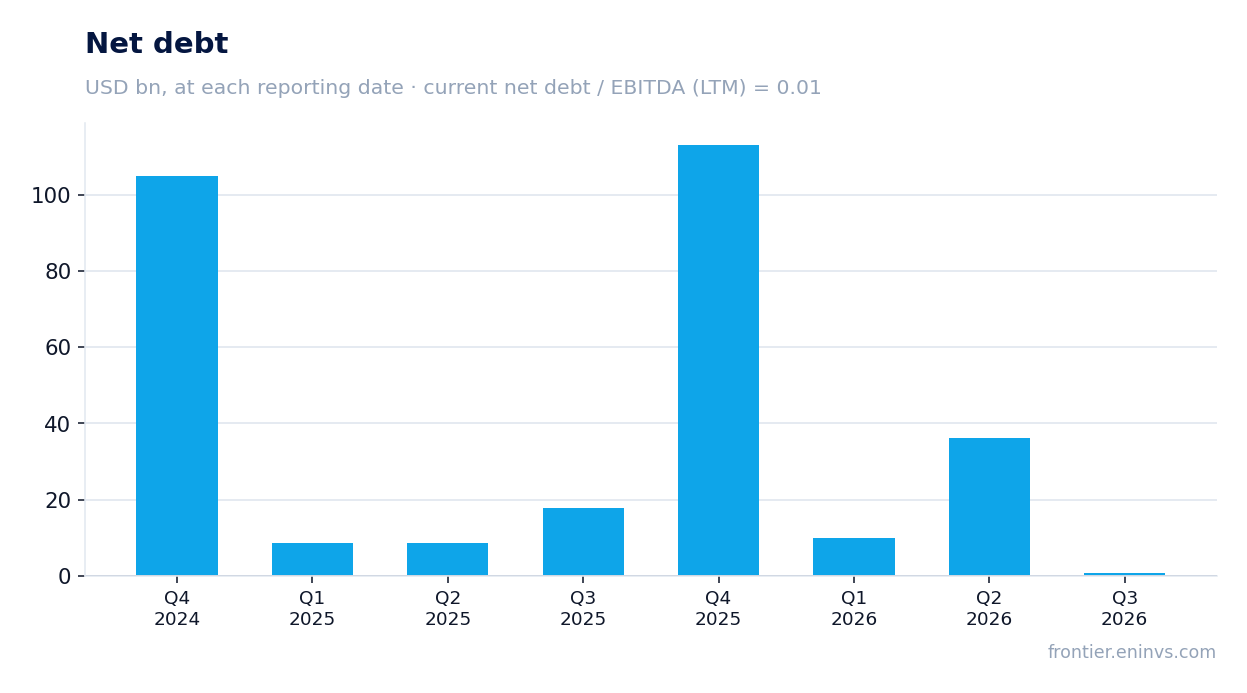
Net debt shrank to USD 723.0 mn from USD 36.3 bn on 30 June – down USD 35.6 bn in the quarter
Net debt on 30 September 2026 was USD 723.0 mn against USD 36.3 bn on 30 June 2026 – a reduction of USD 35.6 bn in the quarter. A year earlier, on 30 September 2025, the figure was USD 17.8 bn, so over 12 months debt fell by USD 17.0 bn.
The ratio of net debt to trailing twelve-month EBITDA is 0.01. That is effectively no leverage: the company could repay all of its net debt from one month of EBITDA.
Such debt reduction while maintaining dividends and capex was made possible by strong free cash flow. For the shareholder this means interest expense and refinancing risk have practically disappeared.
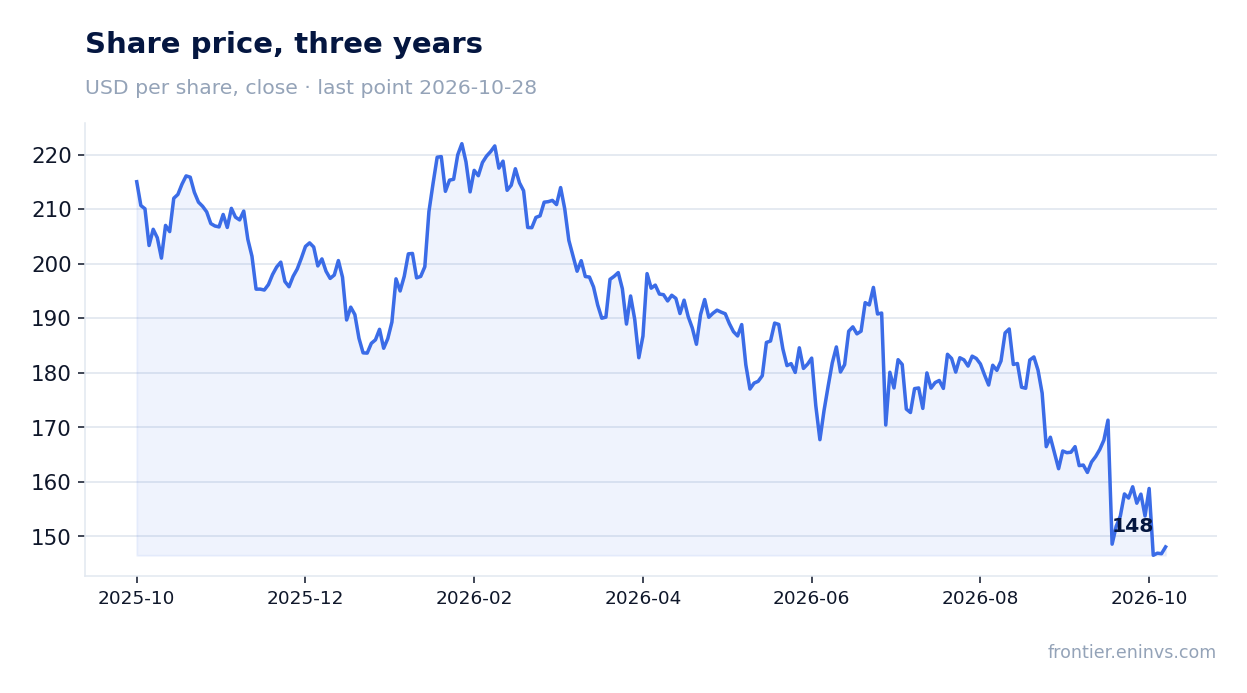
The dividend yields 2.76% and is comfortably covered by profit
The trailing twelve-month dividend yield is 2.76%. With trailing twelve-month net profit of USD 11,301.0 mn and a market capitalisation of USD 167,489.8 mn, the payout is covered by profit with a wide margin.
Our estimate for the current year's dividend assumes the current yield is maintained: at a share price of USD 146.83 and a yield of 2.76%, the annual dividend is about USD 4.05 per share. This estimate rests on profit and free cash flow, not on one-off items.
A 2.76% yield is modest against the risk-free rate, but it is backed by stable profit and low debt. Only a sharp fall in free cash flow could reduce the payout, and no such fall is visible in the report.
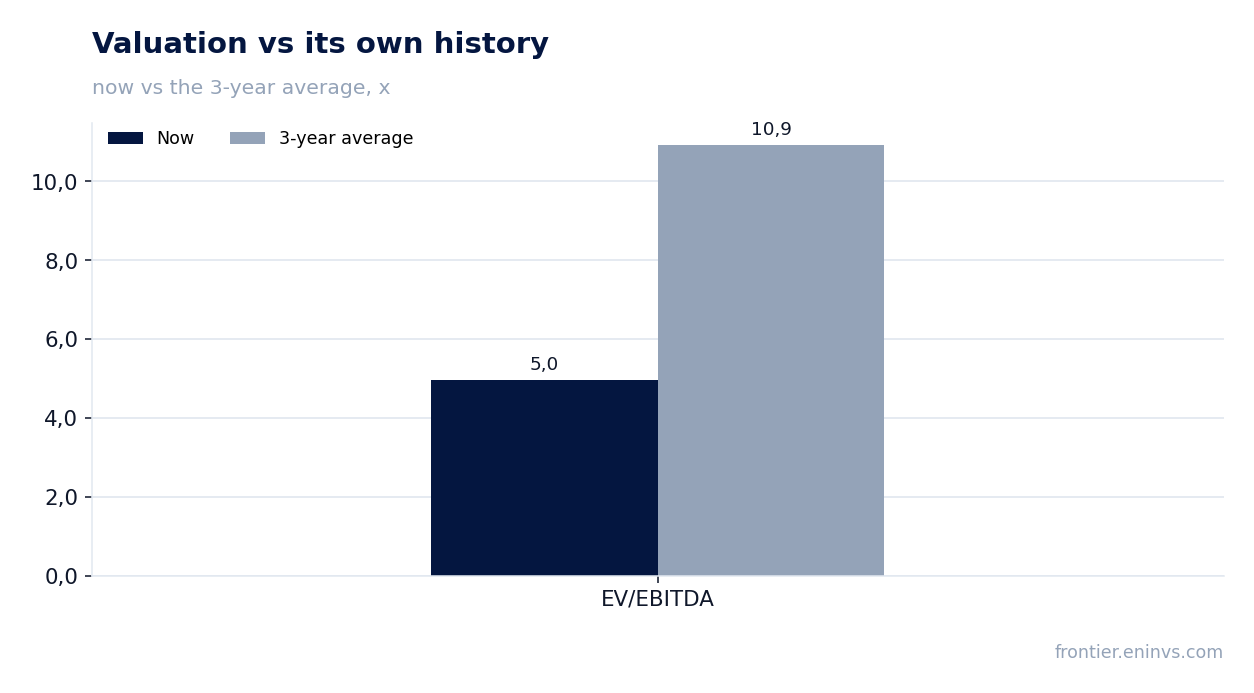
The 5.0x EV/EBITDA multiple sits 55% below its own three-year average of 10.9, and the portal model implies 36% upside
Trailing twelve-month EV/EBITDA is 5.0x against its own three-year average of 10.9x. The stock trades 55% below its own history on this multiple – the strongest argument for the valuation.
The trailing twelve-month P/E is 14.8, which also does not look expensive for a company growing profit 27.3% in the quarter. Return on equity is 24.6%, confirming the quality of the business.
On the portal's model the fair value of the share is 36% above the current price. The model rests on EBITDA growth and a target multiple, and at current growth and margin that upside looks achievable.
Valuation on the latest reported figures
| Metric | Value |
|---|---|
| Market cap | 167 bn USD |
| P/E (LTM) | 14.8 |
| EV/EBITDA (LTM) | 5.0 |
| P/B | 2.83 |
| Net debt / EBITDA (LTM) | 0.01 |
| Operating cash flow (LTM) | 28.7 bn |
| ROE | 24.6% |
| Dividend yield (12m) | 2.8% |
| EV/EBITDA, 3-year average | 10.9 |
Bottom line
The strong side of the report is profit growth of 27.3% at a 14.6% margin and virtually no debt: USD 723.0 mn of net debt against USD 9,113.0 mn of quarterly EBITDA. Free cash flow of USD 5,071.0 mn covers the dividend and further debt reduction. The weak spot is the slowdown in revenue to 7.4%, but it is offset by margin expansion. The key question for a holder is whether the 38.6% margin holds as growth slows. At 5.0x EV/EBITDA against its own average of 10.9 and 36% upside on the portal model, the share looks attractive.
Open the company's financial profile TMUS →
See also: market overview · valuation map · stock screeners