Tesla, Inc.: revenue stalled and net profit fell 42.7% – EBITDA growth rests on costs, not sales

On 25 October Tesla, Inc. reported results for the third quarter of 2026. Revenue came in at USD 28,046.0 mn, down 0.2% year on year, EBITDA rose 31.1% to USD 3,900.0 mn, while net profit fell 42.7% to USD 787.0 mn. Operating profit declined to USD 718.0 mn, and the gap with EBITDA shows that the EBITDA gain came from the cost structure rather than from sales. At an EV/EBITDA of 95.2 – below its own three-year average of 111.8 – the share looks rather attractive, but weak revenue and falling net profit keep it from being unambiguously cheap.
Key takeaways
— Revenue did not grow in Q3 2026 – down 0.2% year on year after plus 25.5% in Q2, a deceleration
— EBITDA added 31.1% even as operating profit fell to USD 718.0 mn – the gap between them is the source of the gain
— Net profit fell 42.7% to USD 787.0 mn, and its margin dropped from 4.9% to 2.8%
— EBITDA margin rose from 10.6% to 13.9%, but with revenue flat this is a cost effect, not scale
— Operating cash flow of USD 6,263.0 mn is almost equal to last year's USD 6,238.0 mn and covers capital expenditure
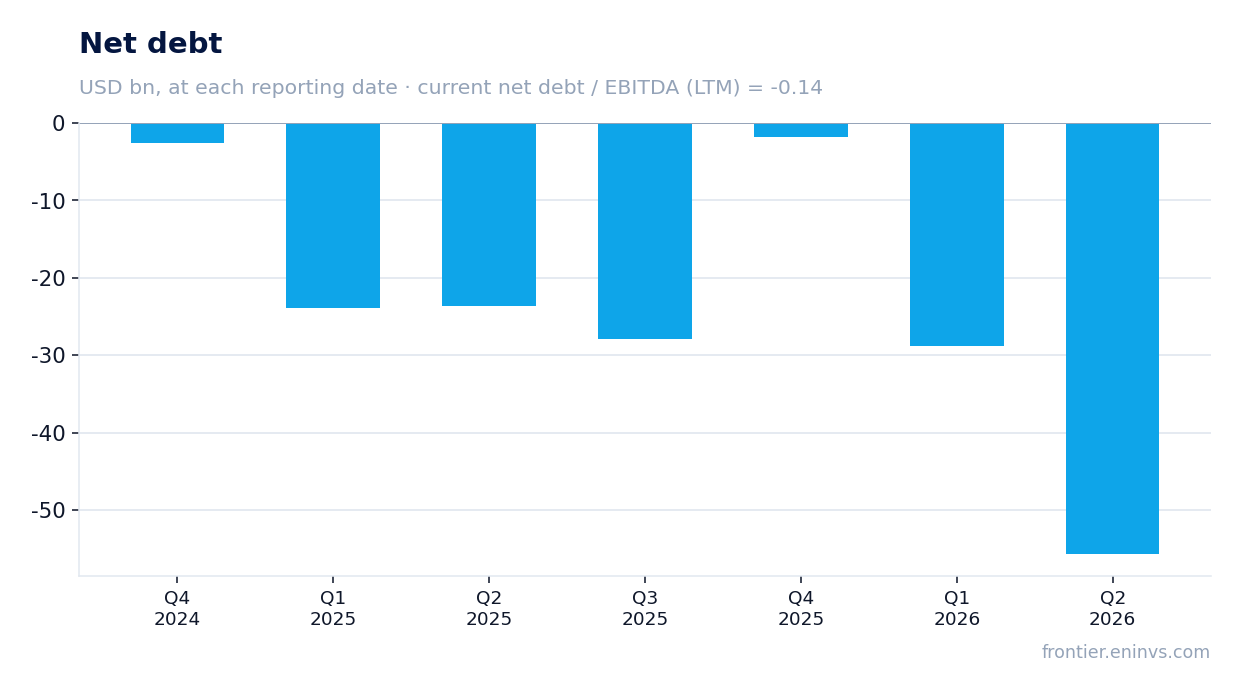
— Leverage is negative: net debt to LTM EBITDA stands at -0.14
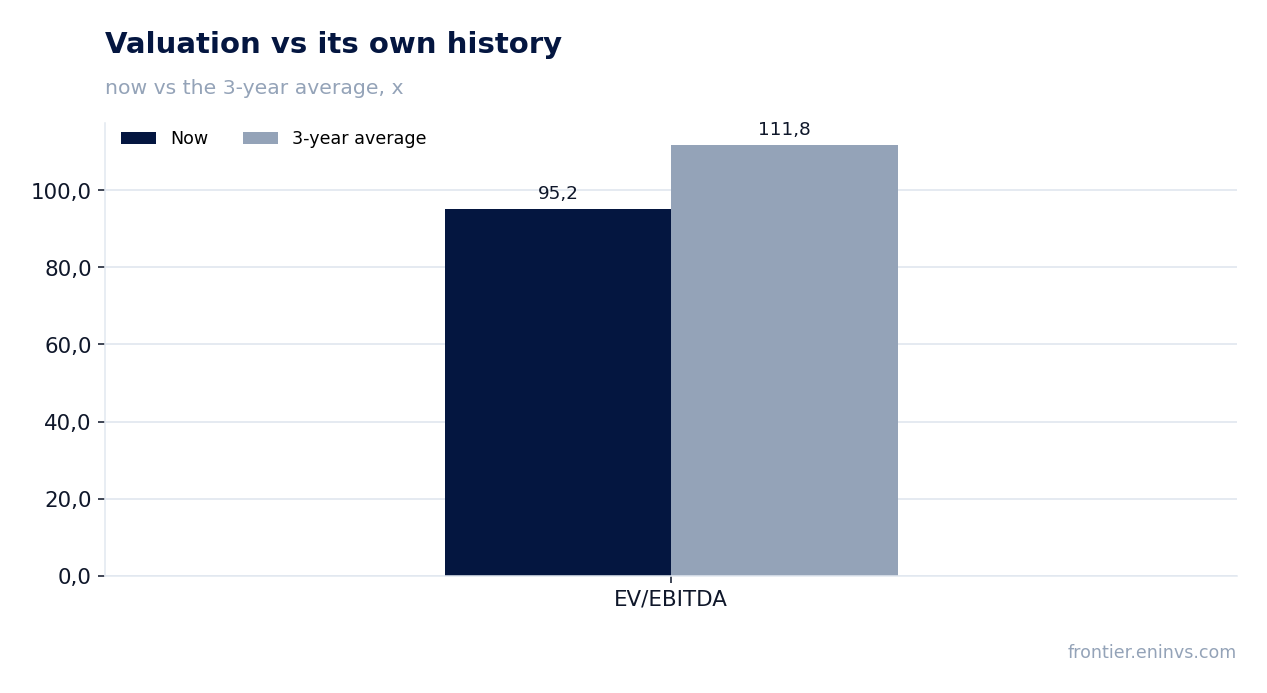
— EV/EBITDA of 95.2 is 15% below its own three-year average of 111.8, and the portal model puts the upside to fair value at +7%
Attractiveness
Key figures, USD bn
| Metric | Q3 2025 | Q3 2026 | Change |
|---|---|---|---|
| Revenue | 28.1 | 28.0 | -0.2% |
| EBITDA | 2.97 | 3.90 | +31.1% |
| Operating profit | 1.62 | 0.72 | -55.8% |
| Net profit | 1.37 | 0.79 | -42.7% |
| Operating cash flow | 6.24 | 6.26 | +0.4% |
| Capex | 2.25 | — | — |
| EBITDA margin | 10.6% | 13.9% | +3.3 pp |
| Net margin | 4.9% | 2.8% | -2.1 pp |
Revenue did not grow in Q3 2026 – down 0.2% year on year after plus 25.5% in Q2, a deceleration
Q3 2026 revenue came to USD 28,046.0 mn, down 0.2% from the same quarter a year earlier. In Q2 2026 growth was 25.5%, so the dynamic slowed sharply: quarter on quarter sales barely moved – USD 28,236.0 mn in Q2 versus USD 28,046.0 mn in Q3.
Over the last twelve months revenue reached USD 103,600.0 mn, a level the company has already shown, and the current quarter did not lift it. For the valuation this is the main constraint: with revenue flat, profit growth can only come from costs or one-off items.
The year-on-year comparison shows the quarter is not a collapse – revenue a year earlier was USD 28,095.0 mn, so the difference is minimal. But there is no growth either, and that is what the market paid for in previous quarters when revenue added double digits.
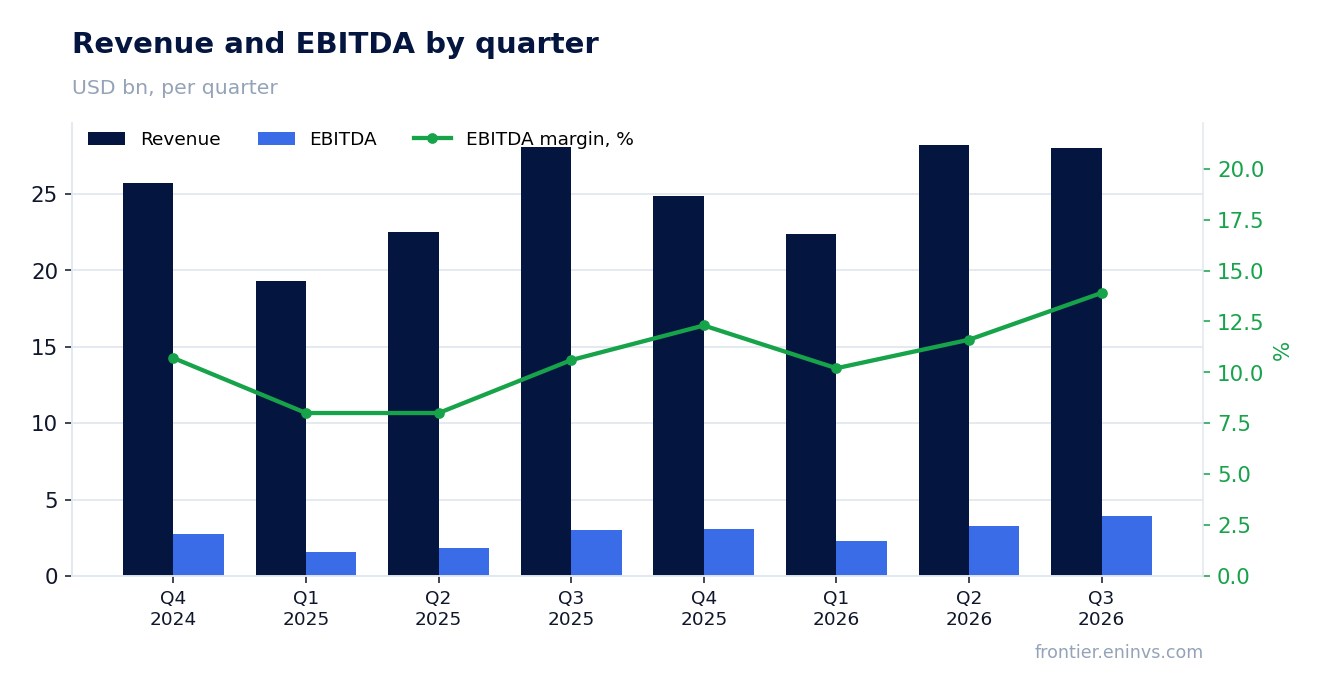
EBITDA added 31.1% even as operating profit fell to USD 718.0 mn – the gap between them is the source of the gain
Q3 2026 EBITDA came to USD 3,900.0 mn versus USD 2,974.0 mn a year earlier, up 31.1%. Operating profit for the same quarter was USD 718.0 mn, well below last year's USD 1,624.0 mn. The gap between EBITDA and operating profit of USD 3,182.0 mn is depreciation and other non-cash items, and it explains why EBITDA rises while operating profit falls.
EBITDA margin rose from 10.6% to 13.9%. With revenue flat, such a margin gain means the company spends less relative to sales rather than earning more on volume. That distinction matters: cost savings give a one-off effect, scale gives a lasting one.
Operating profit of USD 718.0 mn is what remains after all operating costs, and its decline alongside EBITDA growth says the core business has become less profitable. For a shareholder this means the EBITDA improvement will not necessarily turn into a profit improvement.
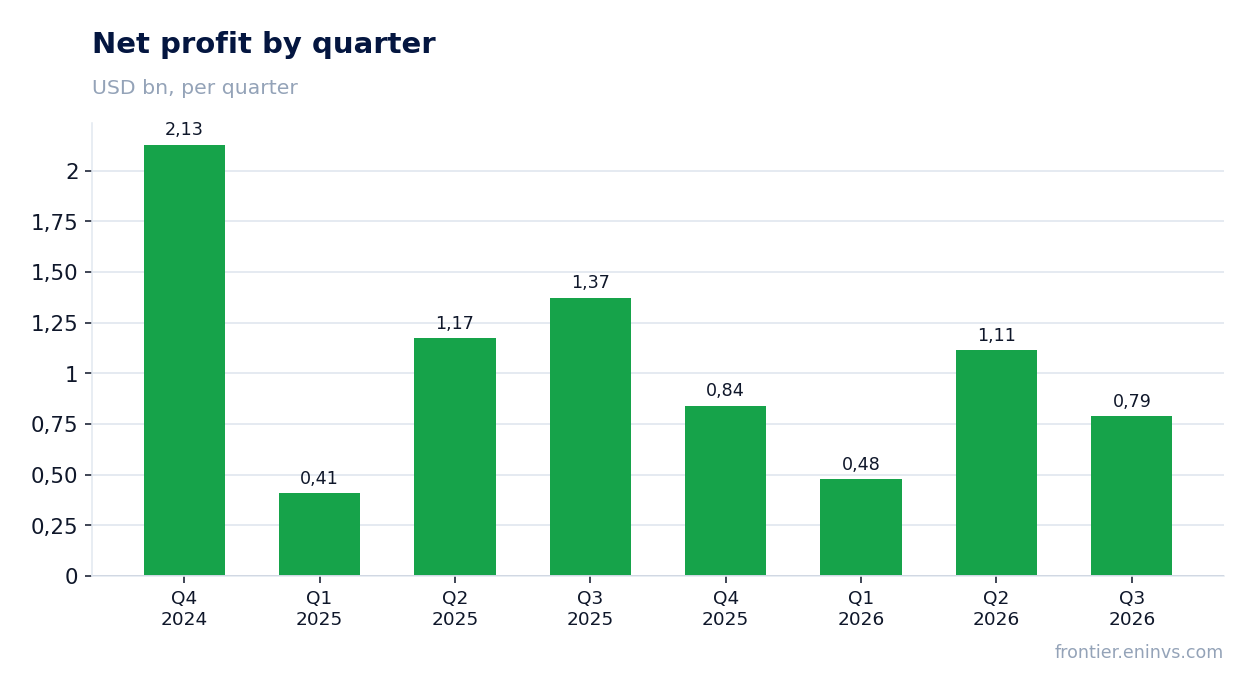
Net profit fell 42.7% to USD 787.0 mn, and its margin dropped from 4.9% to 2.8%
Q3 2026 net profit was USD 787.0 mn versus USD 1,373.0 mn a year earlier, a fall of 42.7%. Net margin dropped from 4.9% to 2.8%. With revenue flat and EBITDA rising, the fall in net profit means additional costs appeared below the operating line, or operating profit fell by more than non-cash items compensated.
Over the last twelve months net profit reached USD 3,218.0 mn, a modest level against revenue of USD 103,600.0 mn – an LTM margin of about 3.1%. For a company with a market capitalisation of USD 1,246,269.1 mn, that profit gives a P/E LTM of 387.3, meaning the market pays very highly for earnings.
The gap between EBITDA of USD 3,900.0 mn and net profit of USD 787.0 mn is depreciation, interest and taxes. With negative net debt, interest costs should not be heavy, so most of the gap comes from depreciation and taxes. That makes profit sensitive to accounting policy and asset utilisation.
EBITDA margin rose from 10.6% to 13.9%, but with revenue flat this is a cost effect, not scale
Q3 2026 EBITDA margin was 13.9% versus 10.6% a year earlier. A gain of 3.3 percentage points with revenue unchanged means costs fell in absolute terms or grew slower than sales. That is a positive signal for profitability, but it is not tied to business growth.
Operating margin, by contrast, fell: operating profit of USD 718.0 mn on revenue of USD 28,046.0 mn gives about 2.6% versus 5.8% a year earlier. The gap between EBITDA margin and operating margin is depreciation, which has risen. The company has likely been commissioning new capacity, and its depreciation weighs on operating profit.
For the durability of the margin it matters that cost savings have a limit. If revenue does not return to growth, further EBITDA margin improvement will require new cuts, and those are finite. The next quarter will show whether the 13.9% margin held with revenue flat.
Operating cash flow of USD 6,263.0 mn is almost equal to last year's USD 6,238.0 mn and covers capital expenditure
Q3 2026 operating cash flow was USD 6,263.0 mn versus USD 6,238.0 mn a year earlier. Profit fell while cash flow stayed flat – meaning non-cash items, primarily depreciation, support the flow. Over the last twelve months operating cash flow reached USD 18,710.0 mn.
Capital expenditure in Q2 2026 was USD 5,796.0 mn, well above the usual USD 2–2.5 bn in prior quarters. If Q3 kept that level, free cash flow may have been small. The facts do not include Q3 capital expenditure, so free cash flow for the quarter cannot be assessed.
Negative net debt of USD -1,794.0 mn on the latest annual balance sheet means cash exceeds debt. That gives the company a cushion: even with weak profit it can fund capital expenditure without adding borrowings.
Leverage is negative: net debt to LTM EBITDA stands at -0.14
Net debt on the latest annual balance sheet was USD -1,794.0 mn, meaning cash exceeds debt. The ratio of net debt to LTM EBITDA is -0.14. A negative value means the company funds itself from its own resources rather than borrowings.
Such leverage removes interest-rate risk: with negative net debt, interest does not weigh on profit. That matters because net profit fell to USD 787.0 mn, and additional interest costs would have deepened the fall.
The level itself says nothing about its direction: the facts do not include a prior value for this ratio. One can only say the current level is negative and creates no debt risk. For a shareholder this is one of the few unambiguously positive elements of the report.
EV/EBITDA of 95.2 is 15% below its own three-year average of 111.8, and the portal model puts the upside to fair value at +7%
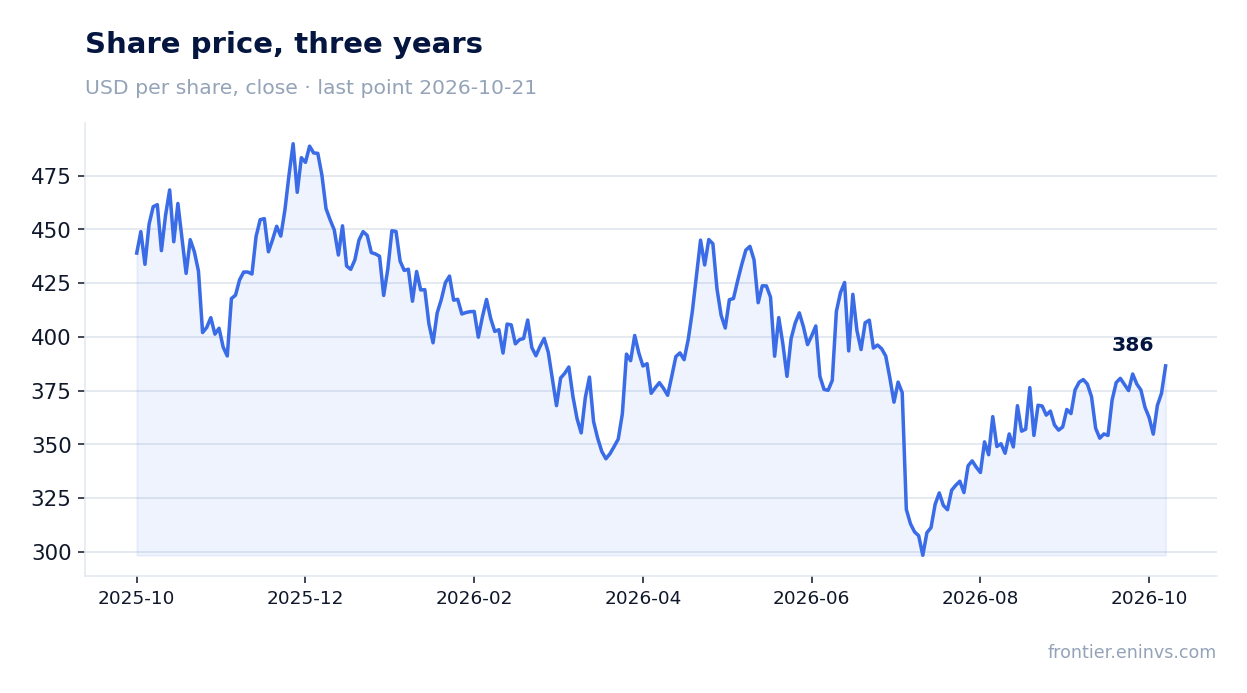
The LTM EV/EBITDA multiple is 95.2 against its own three-year average of 111.8. The share trades 15% below its history, so on this multiple it is cheaper than usual. P/E LTM at 387.3 is very high, but it reflects a low profit base rather than an expensive business.
On the portal's model the upside to fair value is +7%. That is our own estimate, not a market consensus or a target price. It rests on EBITDA growth and a target multiple, and with revenue flat that upside is small.
The comparison with history shows the market has already priced in the weakness in profit. If EBITDA holds at USD 3,900.0 mn a quarter, annual EBITDA would be about USD 15.6 bn, and a multiple of 95.2 would look less stretched. But that requires revenue stability, which Q3 did not have.
Valuation on the latest reported figures
| Metric | Value |
|---|---|
| Market cap | 1 246 bn USD |
| P/E (LTM) | 387.3 |
| EV/EBITDA (LTM) | 95.2 |
| P/B | 15.17 |
| Net debt / EBITDA (LTM) | -0.14 |
| Operating cash flow (LTM) | 18.7 bn |
| ROE | 1.2% |
| EV/EBITDA, 3-year average | 111.8 |
Bottom line
The report's strength remains cash flow: operating flow of USD 6,263.0 mn is almost equal to last year's and covers capital expenditure, while negative net debt of USD -1,794.0 mn removes debt risk. But EBITDA growth of 31.1% alongside operating profit falling to USD 718.0 mn and net profit down 42.7% is a cost and depreciation effect, not a business one. Revenue of USD 28,046.0 mn did not grow, and that is the main question for a holder: will sales growth return, without which cost savings will not deliver sustainable profit. On an EV/EBITDA of 95.2 the share is cheaper than its own history of 111.8, and the portal model shows +7% upside, so the assessment is rather attractive, with a caveat on weak revenue.
Open the company's financial profile TSLA →
See also: market overview · valuation map · stock screeners