TEXAS INSTRUMENTS INC: revenue accelerated to +27.7%, but the price already discounts most of the profit

On 21 October TEXAS INSTRUMENTS INC reported third-quarter 2026 results: revenue of $6,055m, operating profit of $2,874m and net income of $2,425m. Year-on-year revenue growth accelerated to +27.7% from +22.8% a quarter earlier, and the net margin rose to 40.0% from 28.8% a year ago. Yet the share trades at EV/EBITDA LTM of 28.4 – 18% above its own three-year average of 24.0 – so despite the strong report the stock looks fairly valued rather than cheap.
Key takeaways
— Revenue rose 27.7% year on year, with the acceleration driven by broad growth in industrial, automotive and data centre
— The Analog segment grew 32% and delivered $2,505m of operating profit – more than the whole company earned a year earlier
— The 40.0% net margin, up from 28.8%, was helped by a low cost base and the absence of one-off charges
— Free cash flow over twelve months reached $8,422m on capital expenditure of $2,578m
— The quarterly dividend of $1.42 per share yields about 2.0% – modest against the current price
— EV/EBITDA of 28.4 is above its own three-year average of 24.0, and the portal model puts upside to fair value at +23%
Attractiveness
Key figures, USD bn
| Metric | Q3 2025 | Q3 2026 | Change |
|---|---|---|---|
| Revenue | 4.74 | 6.05 | +27.7% |
| EBITDA | 2.16 | — | — |
| Operating profit | 1.66 | 2.87 | +72.8% |
| Net profit | 1.36 | 2.42 | +77.8% |
| Operating cash flow | 2.19 | 3.42 | +56.1% |
| Capex | 1.20 | — | — |
| EBITDA margin | 45.6% | — | — |
| Net margin | 28.8% | 40.0% | +11.2 pp |
Revenue rose 27.7% year on year, with the acceleration driven by broad growth in industrial, automotive and data centre
Third-quarter 2026 revenue came to $6,055m, up 27.7% year on year and 11% quarter on quarter. Growth accelerated: it was +22.8% year on year in the second quarter and +18.6% in the first. The company names the driver directly – continued broad growth in industrial, automotive and data centre.
The sequential trend is strong too: revenue rose 11% quarter on quarter. This is not a one-customer spike but widening demand across several markets, which for a semiconductor cycle is a more reliable signal than a single large contract.
For the next quarter the company guides revenue to $5,800–6,300m and earnings per share to $2.45–2.79. The midpoint of the revenue range is slightly below the level just achieved, so management promises neither continued acceleration nor a downturn.
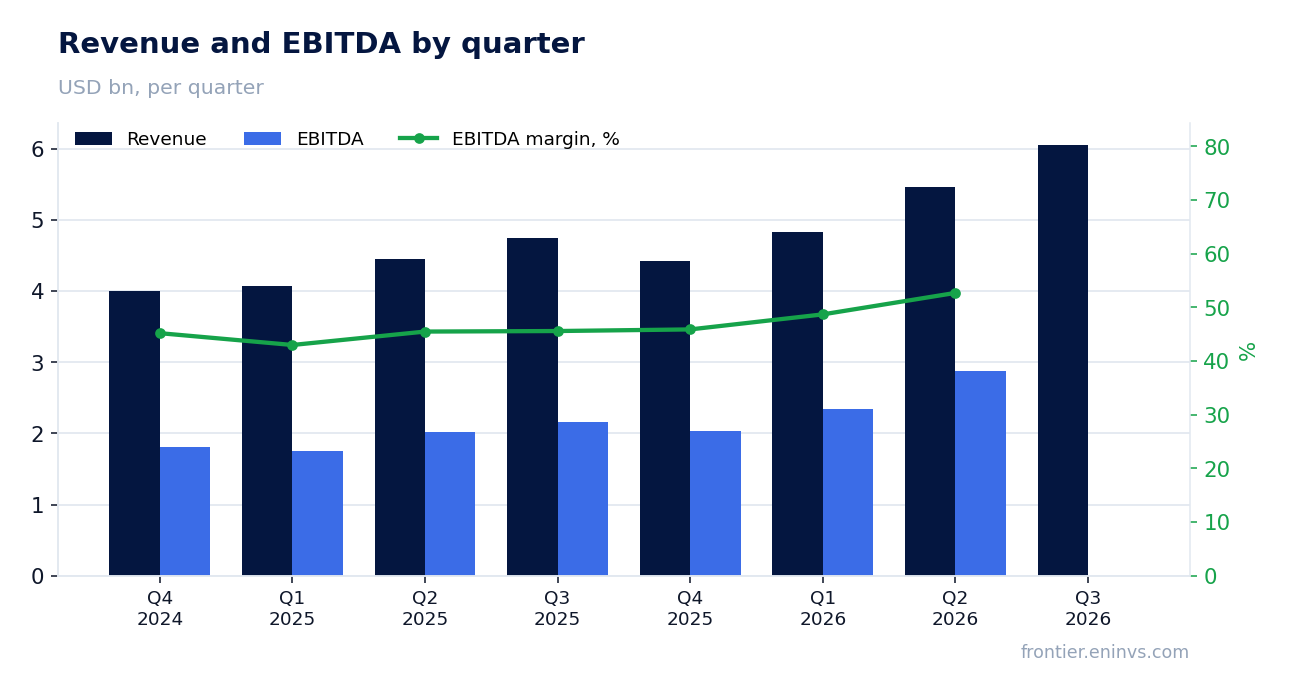
The Analog segment grew 32% and delivered $2,505m of operating profit – more than the whole company earned a year earlier
Analog remains the main engine: revenue of $4,911m, up 32% year on year, and operating profit of $2,505m against $1,486m a year earlier. That single segment's profit exceeds the whole company's operating profit in the third quarter of 2025 ($1,663m).
Embedded Processing added 21% to $858m of revenue, and its operating profit more than doubled to $227m. Other segments fell 6% to $286m, but their contribution to the total is small.
The structure means the report rests on the analog core and its 300mm production. That is what lets the company raise output without a proportional rise in costs, and its utilisation will determine how durable the margin is in coming quarters.
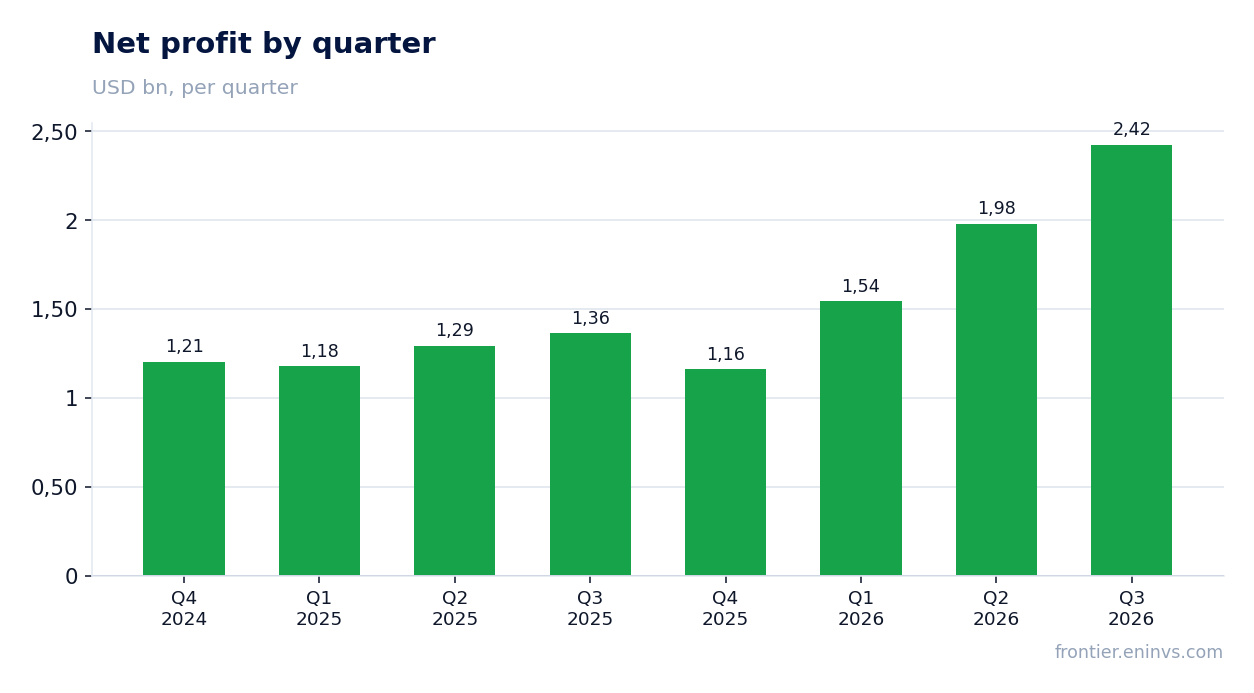
The 40.0% net margin, up from 28.8%, was helped by a low cost base and the absence of one-off charges
Net income for the quarter was $2,425m, or $2.62 per share, up 77.8% year on year. The margin rose to 40.0% from 28.8%. Operating profit grew 73% to $2,874m on revenue growth of 27.7% – costs rose markedly slower than sales.
Cost of revenue rose only to $2,168m from $2,019m while revenue added more than $1.3bn. Gross profit increased to $3,887m from $2,723m. A year earlier the report included $85m of restructuring charges that are absent now – part of the explanation for the profit jump.
Operating expenses were almost flat: R&D of $530m against $518m, SG&A of $476m against $457m. The effective tax rate fell: tax of $380m against $220m on pre-tax income of $2,805m against $1,584m. Part of the profit gain therefore came not only from revenue but from the absence of one-off items and a lower relative tax burden.
Free cash flow over twelve months reached $8,422m on capital expenditure of $2,578m
Operating cash flow in the third quarter was $3,419m against $2,190m a year earlier. Over the last twelve months it reached $9,896m, and free cash flow $8,422m on capital expenditure of $2,578m over the same period.
Capital expenditure in the quarter was only $463m against $1,197m a year earlier – the company cut investment markedly. Over twelve months capex was $2,578m against $4,817m a year earlier. That is the main reason free cash flow rose so much: it grew not only from profit but from the fall in investment.
Free cash flow over twelve months equals 40.6% of revenue against 14.0% a year earlier. That level is supported by a low investment phase; if the company returns to its former capex level, the flow will shrink even if profit holds.
The quarterly dividend of $1.42 per share yields about 2.0% – modest against the current price
For the third quarter the company declared a dividend of $1.42 per share against $1.36 a year earlier. Over the last twelve months it paid $5,174m in dividends while buybacks were only $636m – 61% less than a year earlier. The yield on the current price is about 2.0%.
Our estimate: with an annual payout of about $5.7 per share and quarterly earnings per share of $2.62, the dividend is comfortably covered by profit. Payments grow slowly – just 5% over twelve months – consistent with the company's cautious policy.
A 2.0% yield is modest both against the current share price and against what an investor can get in risk-free instruments. The dividend here is a pleasant addition to a growth story, not the main argument for the stock. A sustained fall in profit or a new wave of heavy capex could cut the payout, but neither is visible in this report.
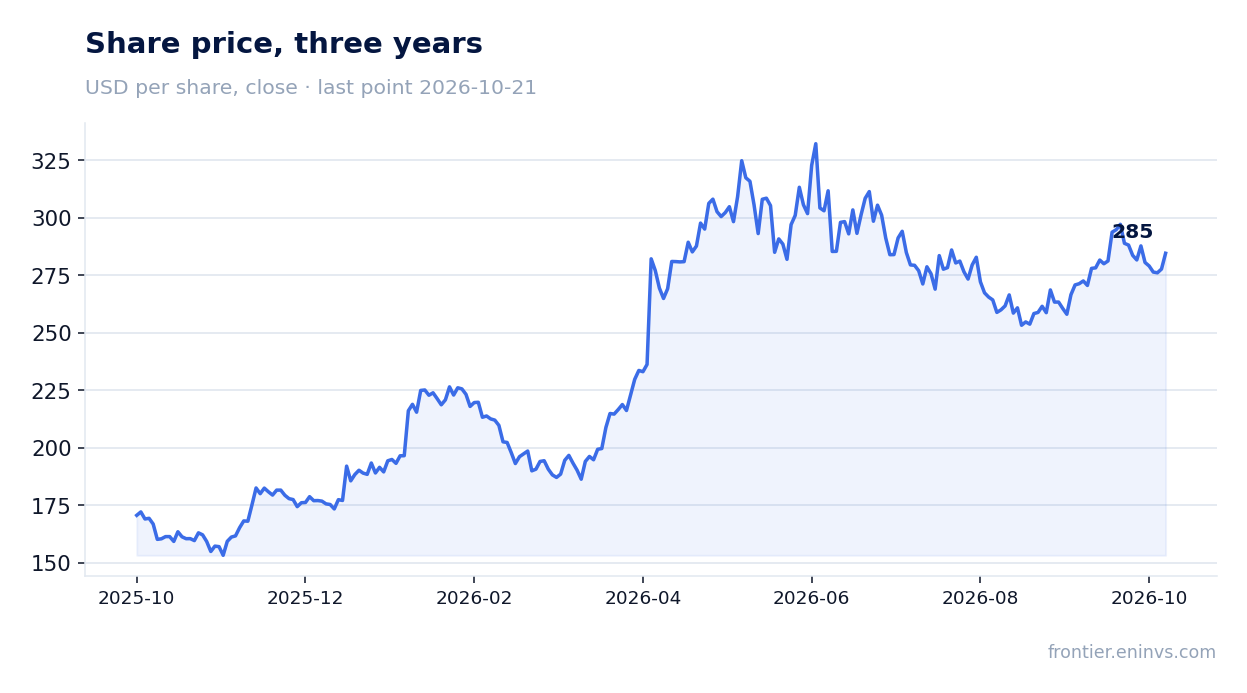
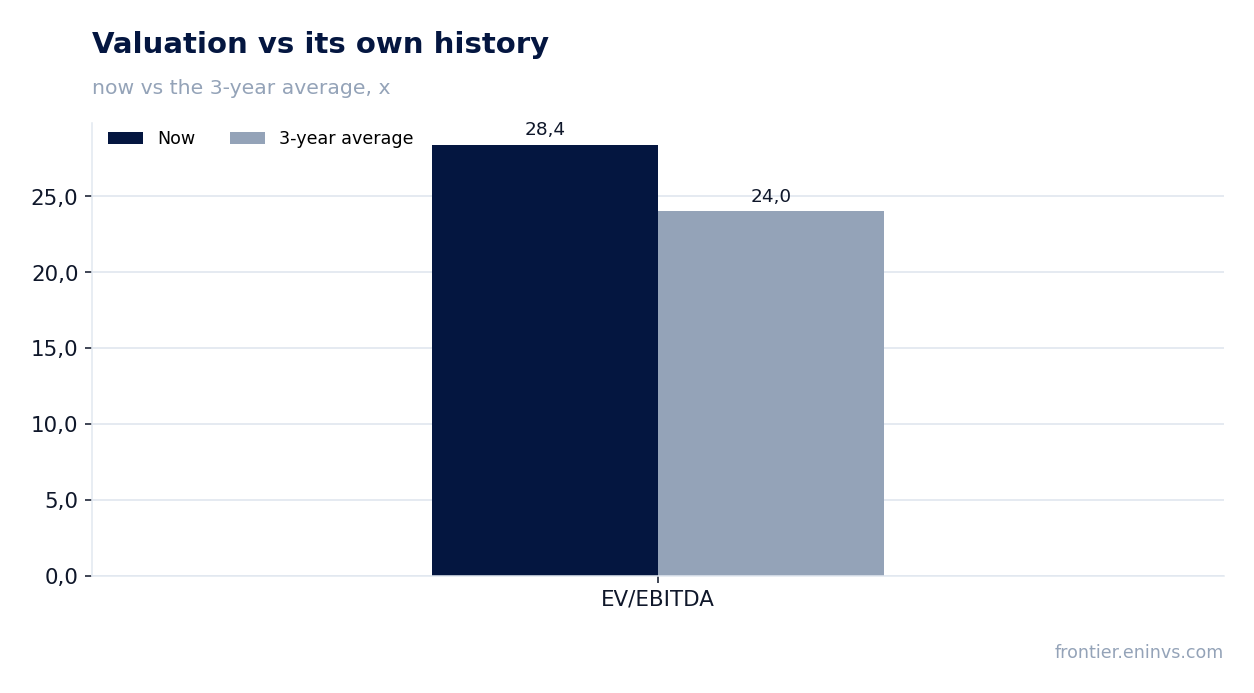
EV/EBITDA of 28.4 is above its own three-year average of 24.0, and the portal model puts upside to fair value at +23%
On EV/EBITDA LTM of 28.4 the share trades 18% above its own three-year average of 24.0. P/E LTM is 36.5. This is not a cheap stock: the market has already priced in the strong profit growth the company delivered in the third quarter.
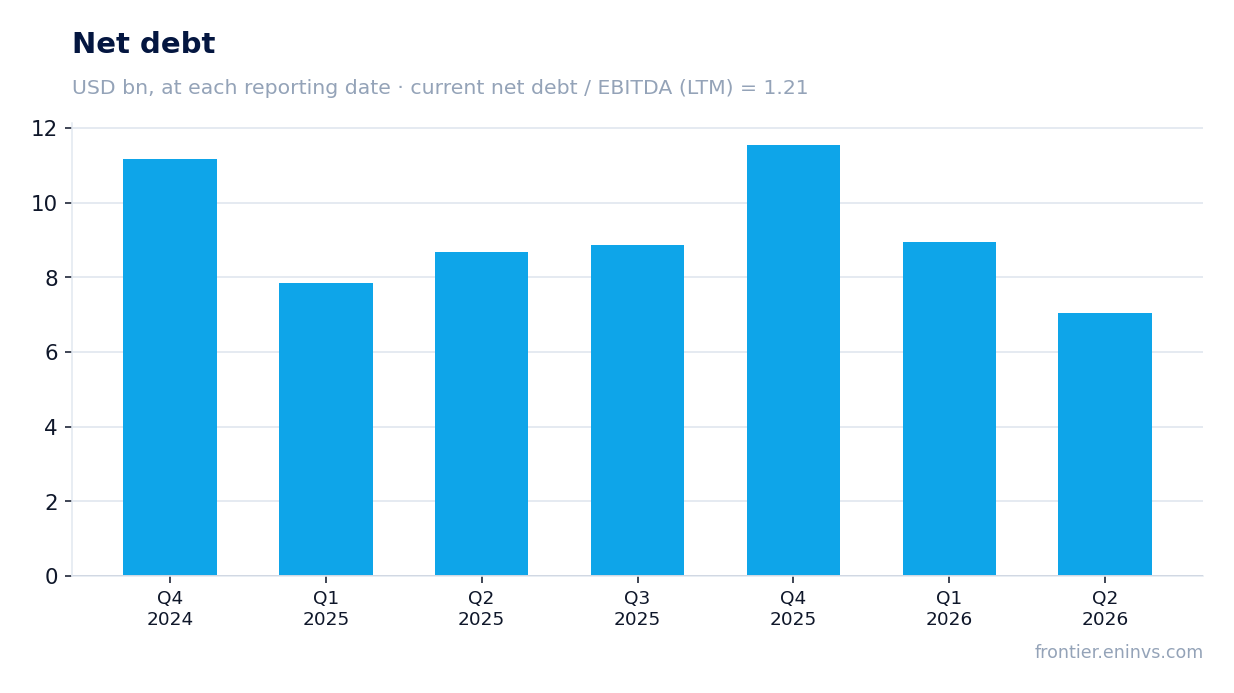
Leverage is moderate: net debt of $11,554m against EBITDA LTM of $9,555.5m, a ratio of 1.21. Return on equity is 17.4%. That is a healthy balance sheet, but it does not add an argument for the stock – rather it confirms that the risk here is valuation, not debt.
On the portal's model the upside to fair value is estimated at +23%. That is our own estimate, not a market consensus. Since the report the share has added 2.5% and is up the same 2.5% from the release – the market reacted cautiously, consistent with an already high valuation.
Valuation on the latest reported figures
| Metric | Value |
|---|---|
| Market cap | 260 bn USD |
| P/E (LTM) | 36.5 |
| EV/EBITDA (LTM) | 28.4 |
| P/B | 15.97 |
| Net debt / EBITDA (LTM) | 1.21 |
| Operating cash flow (LTM) | 9.90 bn |
| ROE | 17.4% |
| Dividend yield (12m) | 2.0% |
| EV/EBITDA, 3-year average | 24.0 |
Bottom line
The report is strong: revenue accelerated to +27.7%, the net margin rose to 40.0%, and the Analog segment grew 32%. But part of the profit gain came from a low base – the absence of restructuring charges and a lower relative tax burden – and record free cash flow rests on reduced capex. At EV/EBITDA of 28.4 against its own three-year average of 24.0, the share already discounts much of the good news. The verdict is neutral: the business is growing fast, but the price leaves no cushion, and a higher rating would need either further revenue acceleration or a correction in the multiple.
Open the company's financial profile TXN →
See also: market overview · valuation map · stock screeners