Uber Technologies, Inc: revenue growth slowed to 9.6% while investment revaluations wiped out most of the profit
On 4 November Uber Technologies, Inc released its results for the third quarter of 2026. Revenue rose 9.6% year on year to USD 14,766 million, EBITDA grew 27.5% to USD 1,659 million, while net profit fell 92.3% to USD 512 million: in the reported quarter the company booked a USD 476 million pre-tax net loss from revaluations of equity investments, against a large one-off gain a year earlier. Revenue growth slowed from 12.2% in the second quarter, but the EBITDA margin rose to 11.2% from 9.7%. At an EV/EBITDA of 19.3 the share is cheaper than its own three-year average of 45.6, and the portal's model puts the upside to fair value at +19%; net profit, however, is driven largely by revaluations rather than operations, so the share looks rather attractive than flawless.
Key takeaways
— Revenue rose 9.6% to USD 14,766 million, but growth slowed from 12.2% in the second quarter
— The EBITDA margin rose to 11.2% from 9.7%, and that happened while net profit fell
— Net profit of USD 512 million was almost entirely eaten by a USD 476 million loss on investment revaluations
— Operating cash flow of USD 2,639 million with capital expenditure of just USD 104 million produced free cash flow of USD 2,535 million
— Net debt of USD 8,179 million is 1.06x trailing-twelve-month EBITDA, a moderate load
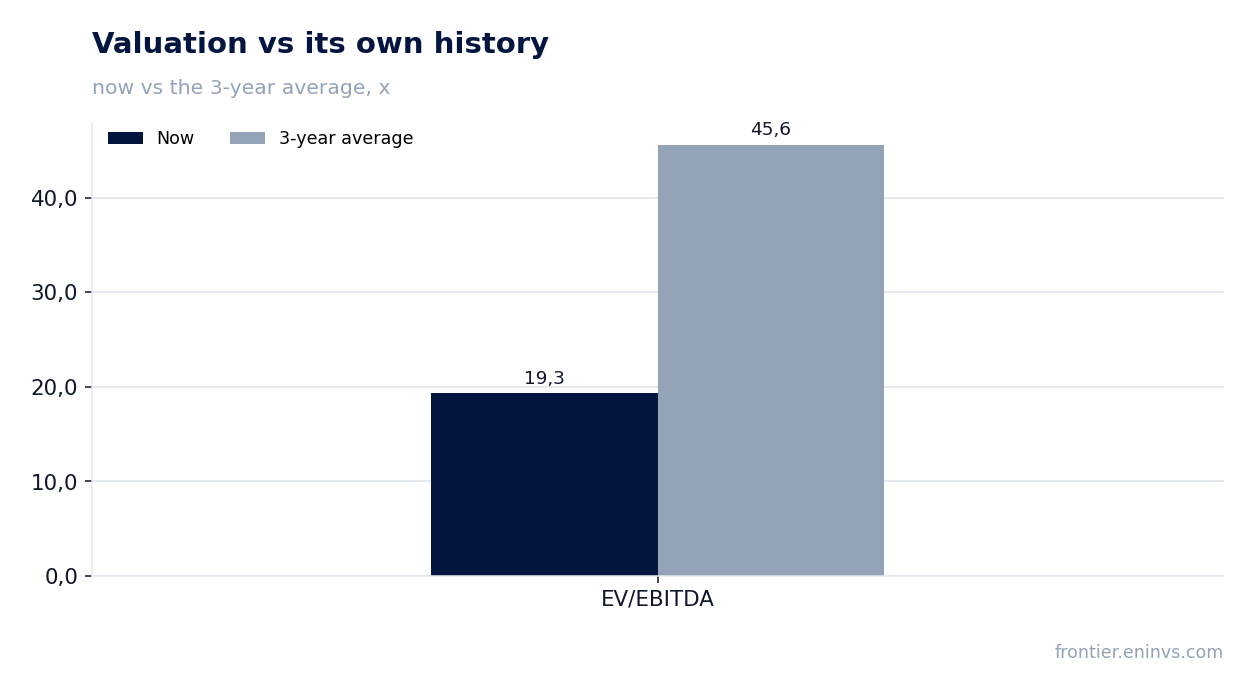
— EV/EBITDA of 19.3 against its own three-year average of 45.6 makes the share 58% cheaper than its history
— On the portal's model the upside of the share to fair value is +19%
Attractiveness
Key figures, USD bn
| Metric | Q3 2025 | Q3 2026 | Change |
|---|---|---|---|
| Revenue | 13.5 | 14.8 | +9.6% |
| EBITDA | 1.30 | 1.66 | +27.5% |
| Operating profit | 1.11 | 1.45 | +30.0% |
| Net profit | 6.63 | 0.51 | -92.3% |
| Operating cash flow | 2.33 | 2.64 | +13.4% |
| Capex | 0.10 | 0.10 | +6.1% |
| EBITDA margin | 9.7% | 11.2% | +1.5 pp |
| Net margin | 49.2% | 3.5% | -45.7 pp |
Revenue rose 9.6% to USD 14,766 million, but growth slowed from 12.2% in the second quarter
Revenue in the third quarter of 2026 was USD 14,766 million, up 9.6% year on year. In the second quarter growth was 12.2%, so the slowdown is 2.6 percentage points. The release itself attributes part of the gap to business model changes: they cut year-on-year revenue growth by 8 percentage points on both a reported and a constant-currency basis.
The segments diverge. Mobility revenue fell 2% to USD 7,520 million, Delivery rose 23% to USD 5,488 million and Freight rose 34% to USD 1,758 million. Gross bookings meanwhile grew 20% to USD 59,819 million, the fifth consecutive quarter of at least 20% growth.
The gap between bookings and revenue comes from how the company now records part of its turnover. For a holder this means 9.6% is not a measure of demand but of how much Uber keeps as revenue. Demand, judging by bookings and trips, is growing faster: trips rose 16% to 4.1 billion.
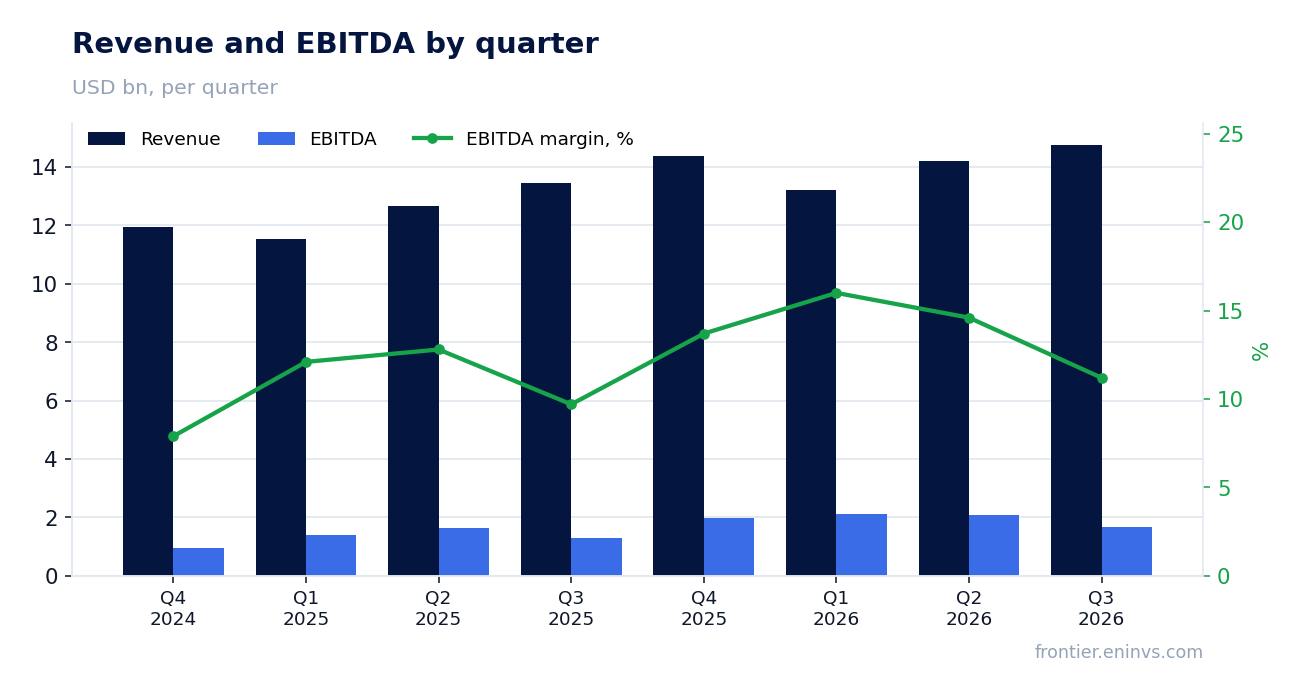
The EBITDA margin rose to 11.2% from 9.7%, and that happened while net profit fell
EBITDA for the reported quarter was USD 1,659 million, up 27.5% year on year. The EBITDA margin rose to 11.2% from 9.7%. Operating profit grew 30% to USD 1,447 million, faster than revenue.
The improvement is visible in the release's non-GAAP measures too: adjusted EBITDA rose 31% to USD 2,963 million and non-GAAP operating income rose 38% to USD 2,304 million. The company attributes this to expanding profitability alongside strong bookings growth.
Net profit, however, fell 92.3% to USD 512 million, and the net margin was 3.5% against 49.2% a year earlier. The cause is not operations: in the reported quarter the company booked a USD 476 million pre-tax net loss from revaluations of equity investments, while a year earlier there was a large one-off gain from the same revaluations plus a tax effect. The operating business itself became more profitable.
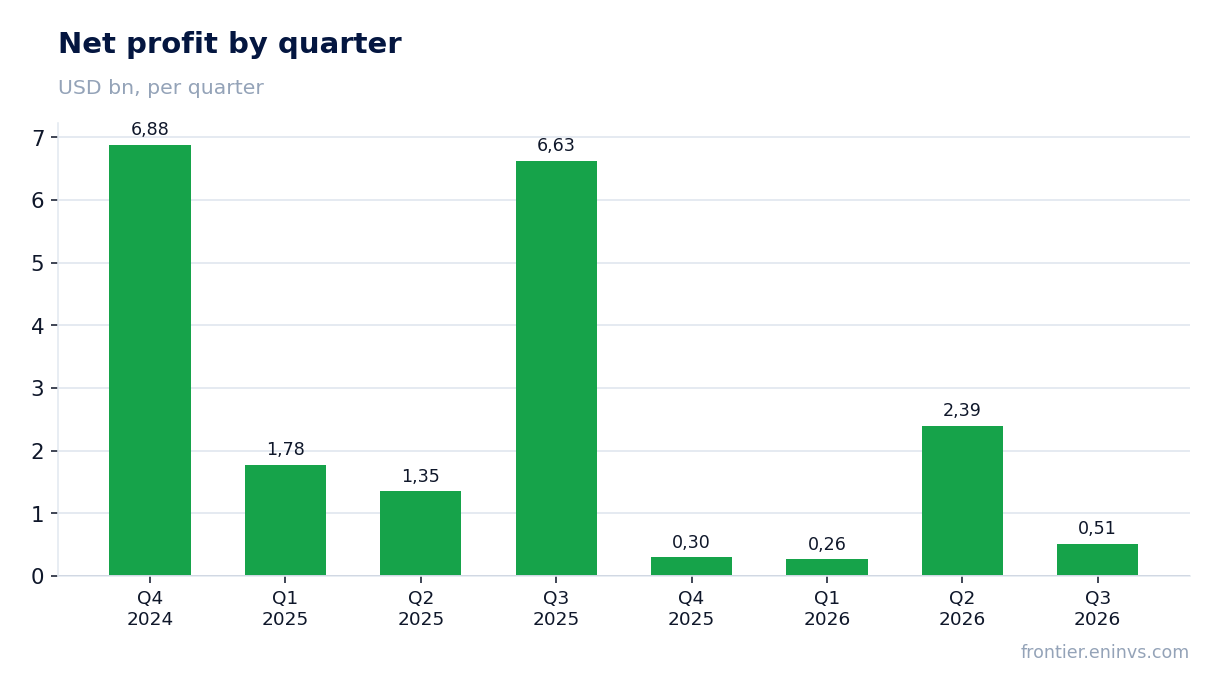
Net profit of USD 512 million was almost entirely eaten by a USD 476 million loss on investment revaluations
Of the USD 512 million of net profit in the reported quarter, a USD 476 million pre-tax net loss from revaluations of equity investments took most of it. This is not a cash write-off but an accounting revaluation of the stakes the company holds. Without it profit would have been materially higher.
For comparison, a year earlier net profit was USD 6,626 million, but it included a USD 4.9 billion benefit from a tax valuation release and a USD 1.5 billion net benefit from investment revaluations. Both quarters are distorted by one-offs, only with opposite signs.
Non-GAAP net income, which excludes these items, rose 29% to USD 1,796 million, and non-GAAP EPS rose 35% to USD 0.88. That measure better reflects what the business earned. The gap between USD 512 million and USD 1,796 million is the price of revaluations and other one-offs.
Operating cash flow of USD 2,639 million with capital expenditure of just USD 104 million produced free cash flow of USD 2,535 million
Operating cash flow in the reported quarter was USD 2,639 million, up 13% year on year. Capital expenditure was only USD 104 million, so free cash flow, as the company defines it, reached USD 2,535 million, up 14%.
Uber's business is not capital-intensive: the main costs are payments to drivers and couriers, not construction. Almost all operating cash therefore turns into free cash. Over nine months free cash flow was USD 7,613 million.
The company directs this money partly into buybacks: USD 750 million in the quarter and USD 4,279 million over nine months. At the same time it raised debt: net proceeds from debt operations in the quarter were USD 5,139 million against USD 2,000 million of repayments. Free cash flow covers the buyback, but not the buyback together with business acquisitions, which took USD 1,555 million over nine months.
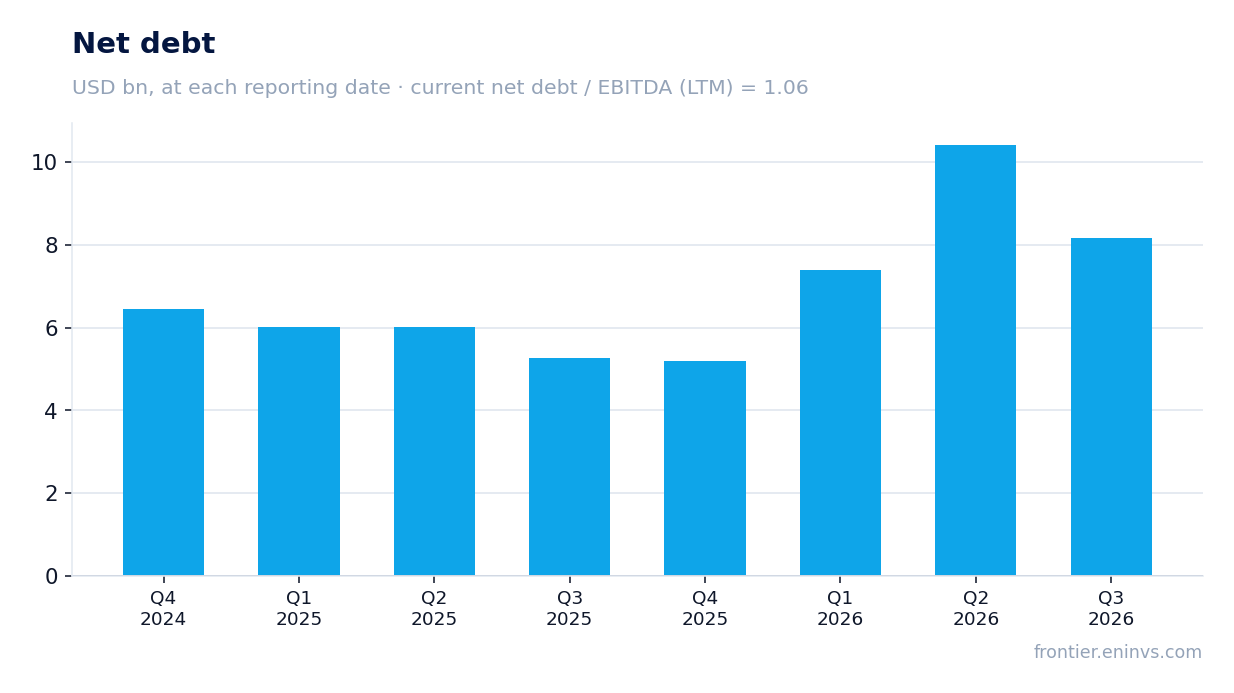
Net debt of USD 8,179 million is 1.06x trailing-twelve-month EBITDA, a moderate load
Net debt at 30 September 2026 was USD 8,179 million. Against trailing-twelve-month EBITDA of USD 7,702.7 million that is 1.06x. The level is moderate for a company with this cash flow.
Net debt fell over the quarter: USD 10,423 million at 30 June 2026 to USD 8,179 million at 30 September, a decrease of USD 2,202 million. Over the year the picture is the opposite: USD 5,275 million at 30 September 2025 to USD 8,179 million at 30 September 2026, an increase of USD 2,904 million. The annual rise reflects debt raising and acquisitions.
Long-term debt on the balance sheet rose to USD 15,664 million from USD 10,521 million at the end of 2025. Interest expense in the quarter was USD 152 million against USD 112 million a year earlier, but interest income of USD 176 million covers it. For a holder it matters that debt service is not yet eating into profit.
EV/EBITDA of 19.3 against its own three-year average of 45.6 makes the share 58% cheaper than its history
On EV/EBITDA the share trades at 19.3. Its own three-year average for this multiple is 45.6, so the current valuation is 58% below its history. This is the strongest argument for the share: the market pays materially less for Uber's earnings than it did over the past three years.
The trailing-twelve-month P/E is 41.2, which is less informative for a company whose net profit is distorted by revaluations. Return on equity is 7.5%, not high, and it too suffers from one-off items in profit.
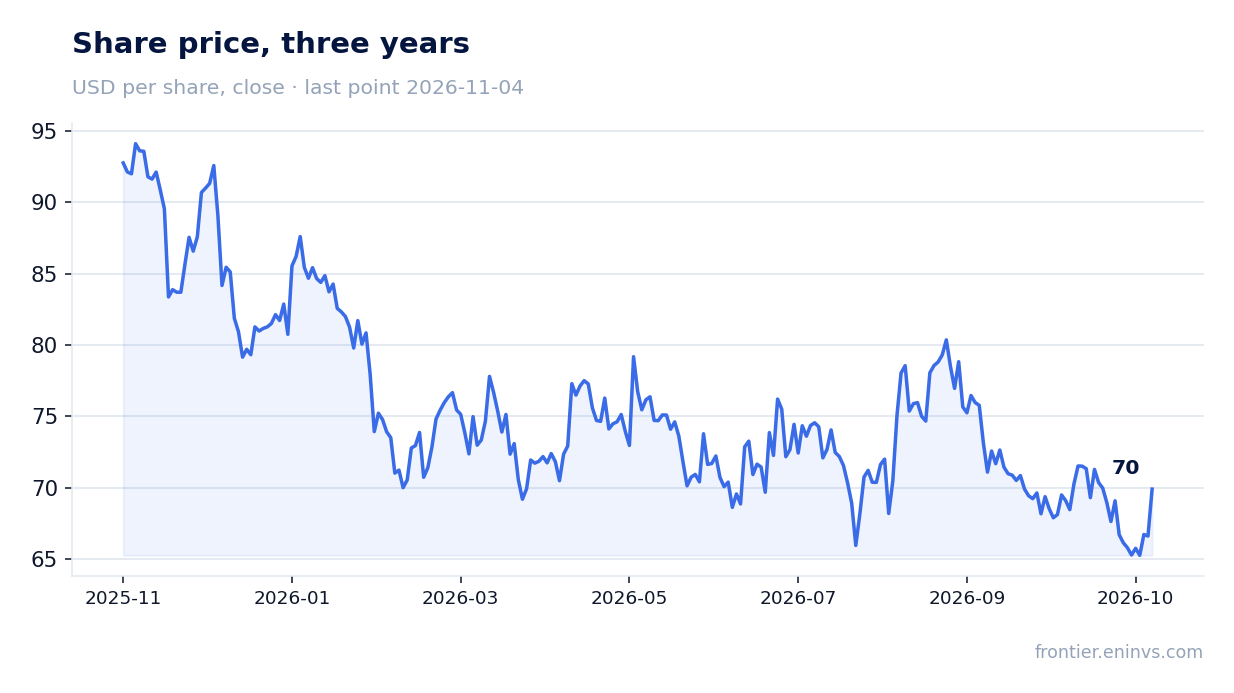
On the portal's model, which sets EBITDA growth against the target multiple and market capitalisation, the upside of the share to fair value is +19%. This is our own estimate, not a market consensus. The market's reaction to the release was positive: the share added 4.9% on the publication day and the same from the release day to 4 November.
On the portal's model the upside of the share to fair value is +19%
The portal's model gives +19% upside to fair value. It rests on EBITDA growth and the target multiple rather than on the quarter's one-off profit, so investment revaluations do not affect it. With a market capitalisation of USD 142,754.5 million, such upside implies the market underestimates the company's ability to grow EBITDA.
The company itself gave guidance for the next quarter: gross bookings of USD 63.25–65.25 billion, growth of 18–22% in constant currency, and non-GAAP EPS of USD 0.95–0.99, growth of 34–39%. That is above the USD 0.88 of the reported quarter, so the company expects profit growth to continue.
What could break this picture is a further slowdown in revenue. If growth falls below 9.6% while the margin stops expanding, the undervaluation argument weakens. For now the company is growing bookings at a double-digit rate and expanding profitability.
Valuation on the latest reported figures
| Metric | Value |
|---|---|
| Market cap | 143 bn USD |
| P/E (LTM) | 41.2 |
| EV/EBITDA (LTM) | 19.3 |
| P/B | 5.08 |
| Net debt / EBITDA (LTM) | 1.06 |
| Operating cash flow (LTM) | 10.7 bn |
| ROE | 7.5% |
| EV/EBITDA, 3-year average | 45.6 |
Bottom line
The strong side of the release is operational: EBITDA rose 27.5%, the margin climbed to 11.2%, and free cash flow reached USD 2,535 million on capital expenditure of just USD 104 million. The weak side is formal: net profit fell 92.3% because of a USD 476 million investment revaluation, and that effect is non-cash. Revenue growth slowed to 9.6%, but bookings are growing 20% and the company attributes the gap to business model changes. The key question for a holder is whether the margin and double-digit bookings growth hold once the model change stops distorting revenue. On the multiple the share is 58% cheaper than its own history, and the portal's model shows +19% upside, so the assessment is rather attractive.
Open the company's financial profile UBER →
See also: market overview · valuation map · stock screeners