Ultra Clean Holdings, Inc.: revenue up 48.8%, but profit barely turns into cash
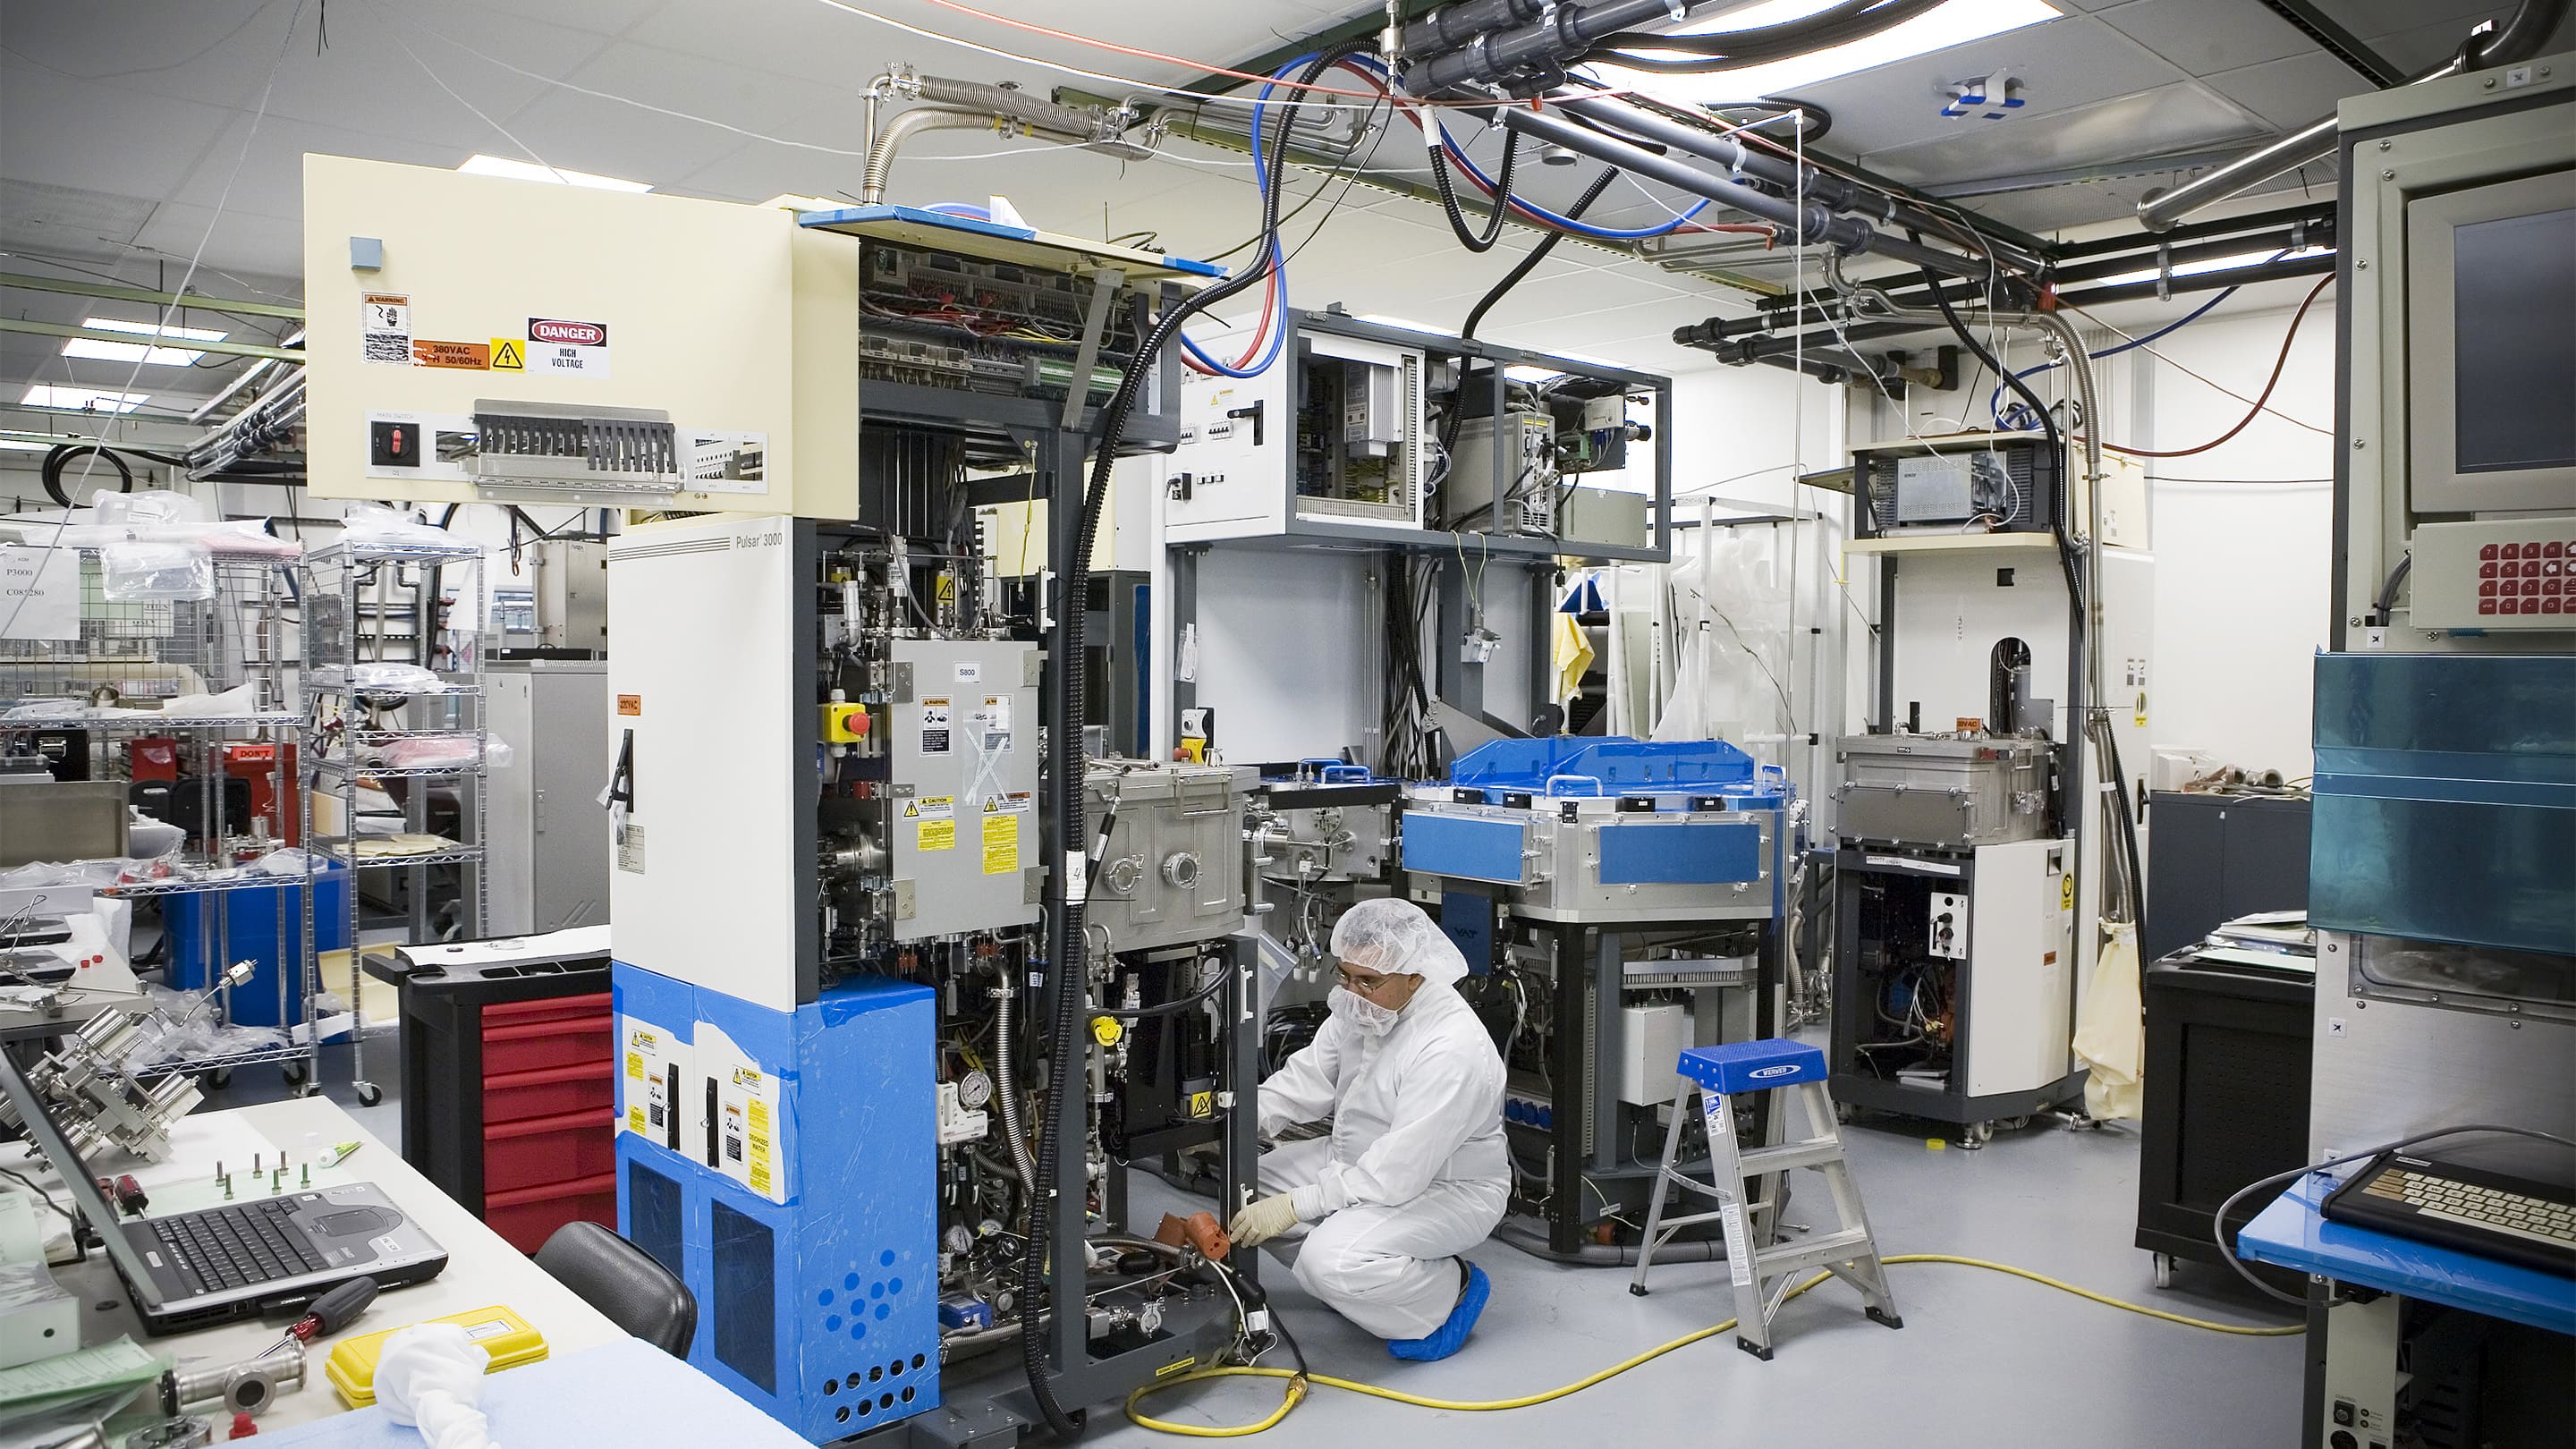
On 27 October, Ultra Clean Holdings, Inc. reported results for the third quarter of 2026. Revenue reached $759.0 million, up 48.8% year on year and 18% above the second quarter; operating profit was $53.7 million and net profit $39.1 million, a 5.2% net margin versus -2.1% a year earlier. The company guided fourth-quarter revenue to $800–860 million, but operating cash flow for the nine months remained negative at -$116.7 million. In our view the share looks rather attractive: the portal's model implies +31% upside to fair value, although leverage of 2.47x EBITDA and weak cash generation temper the assessment.
Key takeaways
— Revenue of $759.0 million grew 48.8% year on year, and products, not services, delivered almost all of the increase
— Gross margin rose to 16.9% from 16.1% in the prior quarter, but operating profit was also helped by one-off adjustments
— Net profit of $39.1 million includes one-off items; without them the result is more modest
— Operating cash flow for the nine months was negative $116.7 million because of inventory build
— Debt rose to $635.1 million after a convertible notes offering, and the debt-to-EBITDA ratio stands at 2.47
— Fourth-quarter guidance of $800–860 million implies further acceleration in growth
— Valuation at 19.1x EV/EBITDA and 88.1x P/E looks high, but the portal's model implies +31% upside
Attractiveness
Key figures, USD bn
| Metric | Q3 2025 | Q3 2026 | Change |
|---|---|---|---|
| Revenue | 0.51 | 0.76 | +48.8% |
| EBITDA | 0.02 | — | — |
| Operating profit | 0.01 | 0.05 | +406.6% |
| Net profit | -0.01 | 0.04 | to profit |
| Operating cash flow | 0.00 | — | — |
| Capex | 0.01 | — | — |
| EBITDA margin | 4.5% | — | — |
| Net margin | -2.1% | 5.2% | +7.3 pp |
Revenue of $759.0 million grew 48.8% year on year, and products, not services, delivered almost all of the increase
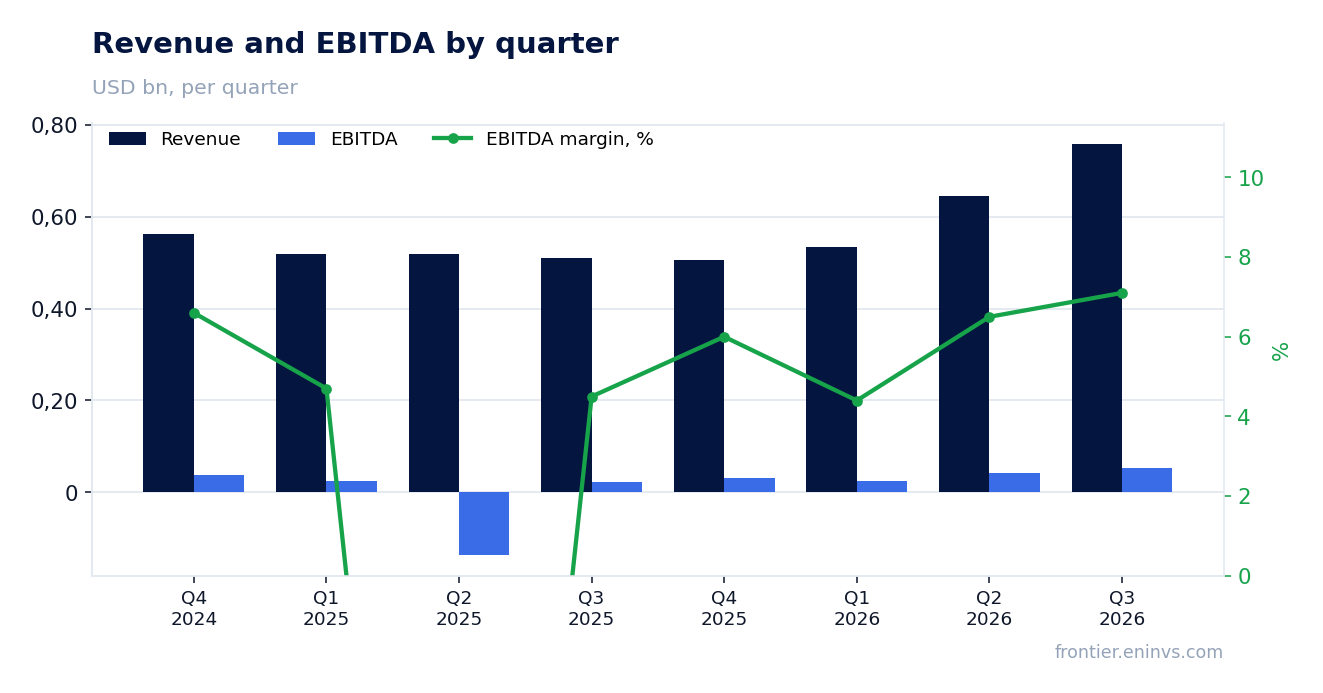
Third-quarter 2026 revenue was $759.0 million versus $510.0 million a year earlier. Growth of 48.8% accelerated markedly from 24.3% in the second quarter. Products generated $681.9 million and services $77.1 million; a year earlier products contributed $445.0 million and services $65.0 million. Products thus delivered almost all of the increase, while services added only $12.1 million.
The sequential comparison is also strong: second-quarter revenue was $644.9 million, so the quarter-on-quarter increase was 18%. The company attributes this to accelerating customer demand and expanded production. Fourth-quarter guidance of $800–860 million implies that growth will continue and exceed the third-quarter level.
Gross margin rose to 16.9% from 16.1% in the prior quarter, but operating profit was also helped by one-off adjustments
Gross margin in the third quarter was 16.9% versus 16.1% in the second quarter and 16.1% a year earlier. Gross profit reached $128.4 million. Operating margin rose to 7.1% from 4.6% in the prior quarter. Adjusted operating margin, excluding amortisation of intangibles, stock-based compensation and one-off items, was 9.0%.
One-off items include $6.8 million of intangible amortisation, $6.9 million of stock-based compensation, $0.6 million of restructuring and $0.6 million of legal costs. Without them operating profit would have been $68.6 million instead of $53.7 million. This means part of the margin improvement is one-off in nature, although underlying revenue growth also contributed to higher profitability.
Net profit of $39.1 million includes one-off items; without them the result is more modest
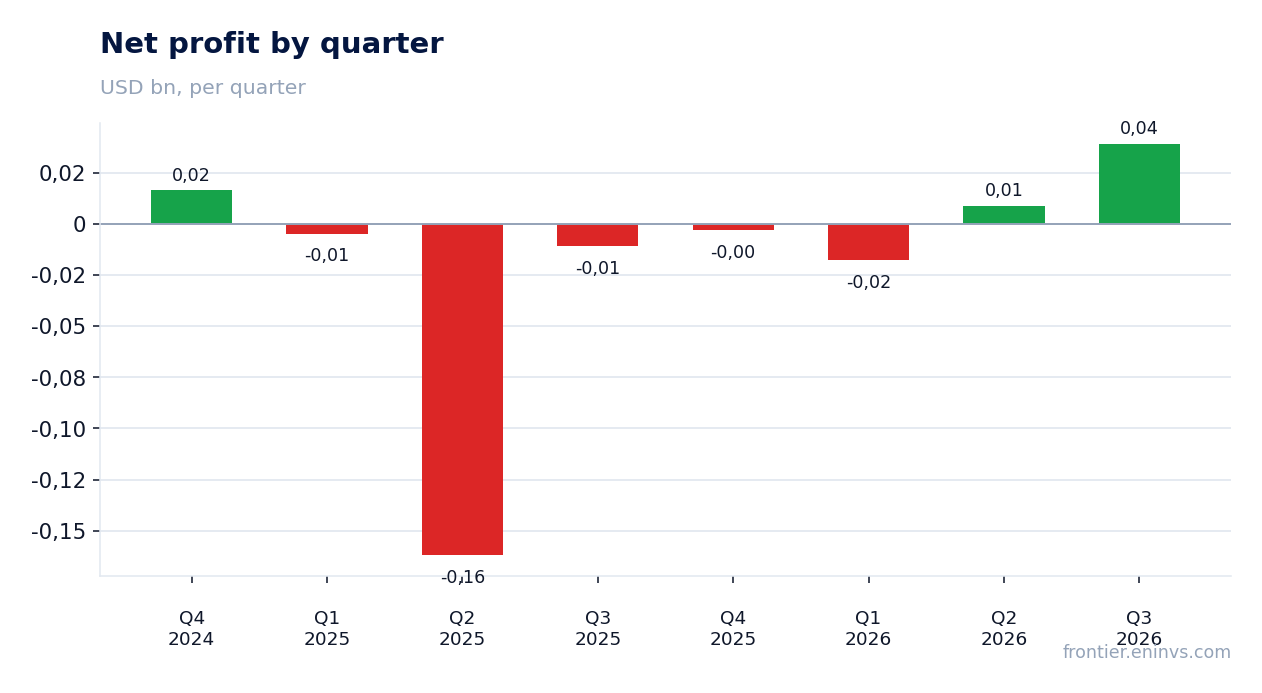
Net profit attributable to Ultra Clean Holdings, Inc. was $39.1 million, or $0.85 per diluted share, versus a loss of $10.9 million a year earlier. The net margin reached 5.2% versus -2.1% a year earlier. Adjusted net profit was $53.2 million, or $1.15 per share.
The gap between GAAP and adjusted profit includes $6.8 million of amortisation, $6.9 million of stock-based compensation, $2.6 million of unrealised foreign-exchange losses and tax effects. One-off items thus raised adjusted profit relative to GAAP, but some of them – stock-based compensation, for instance – recur every quarter. The actual cash result is lower, as the weak operating cash flow confirms.
Operating cash flow for the nine months was negative $116.7 million because of inventory build
For the nine months of 2026, operating cash flow was negative at -$116.7 million versus positive $57.5 million a year earlier. The main reason is a $332.4 million increase in inventories and a $63.6 million increase in receivables, partly offset by a $131.1 million increase in payables. The company is building working capital to meet higher demand.
Capital expenditure for the nine months was $45.3 million. Free cash flow therefore remains negative. This is a key risk: revenue and profit growth is not yet converting into cash, and if growth slows the company will have to reduce inventories, which could hit margins.
Debt rose to $635.1 million after a convertible notes offering, and the debt-to-EBITDA ratio stands at 2.47
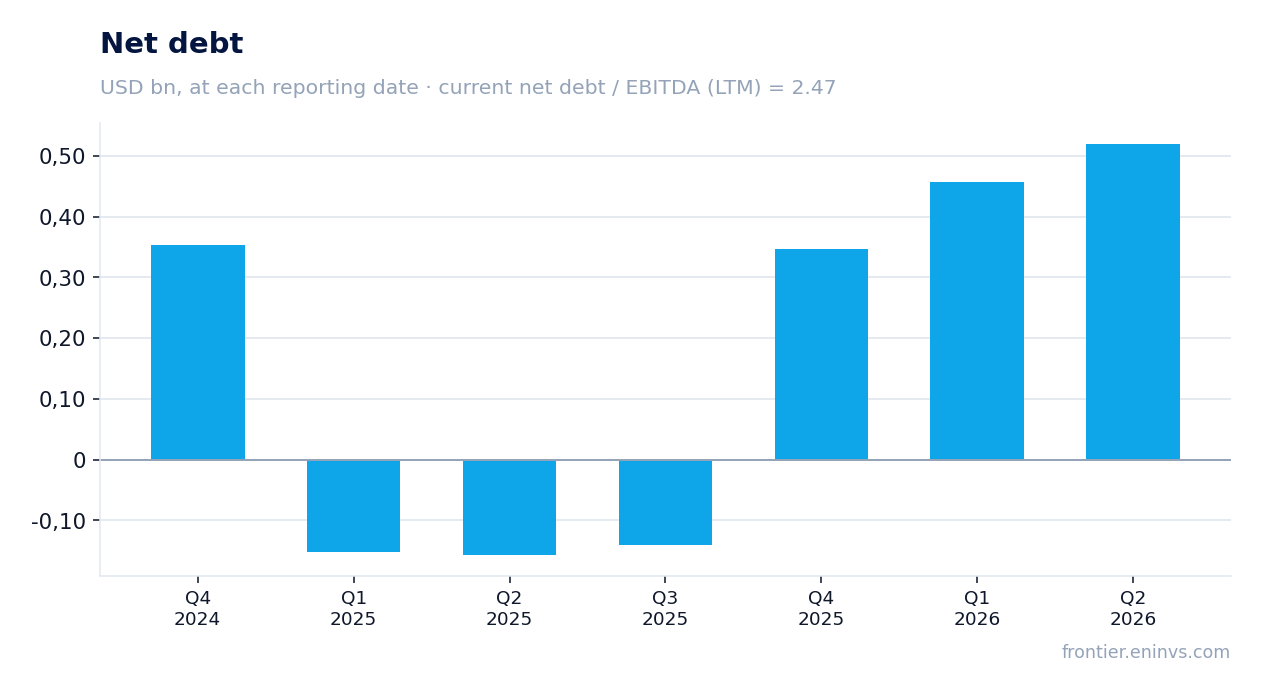
Long-term debt at the end of the third quarter was $635.1 million versus $467.0 million at the end of 2025. The increase reflects a $600.0 million convertible notes offering, partly offset by $481.5 million of bank loan repayments. Cash declined to $270.9 million from $311.8 million.
The ratio of net debt to trailing-twelve-month EBITDA is 2.47. This is a moderate level, but it has risen from a year earlier when debt was lower. Quarterly interest expense was $1.5 million versus $9.9 million a year earlier, reflecting lower cost of debt service after refinancing.
Fourth-quarter guidance of $800–860 million implies further acceleration in growth
The company expects fourth-quarter 2026 revenue in the range of $800–860 million. This is above the third quarter ($759.0 million) and implies continued growth. Diluted earnings per share guidance is $1.02–1.26 on a GAAP basis and $1.11–1.35 on an adjusted basis.
If the company reaches the top end of guidance, annual revenue could exceed $3 billion. However, the guidance does not account for a possible slowdown in demand or supply-chain issues. In addition, working-capital growth may require additional financing.
Valuation at 19.1x EV/EBITDA and 88.1x P/E looks high, but the portal's model implies +31% upside
The trailing-twelve-month EV/EBITDA ratio is 19.1 and P/E is 88.1. Return on equity is 7.6%. For a company with negative free cash flow, these multiples look high. However, our valuation model, based on EBITDA growth and a target multiple, implies +31% upside to fair value.
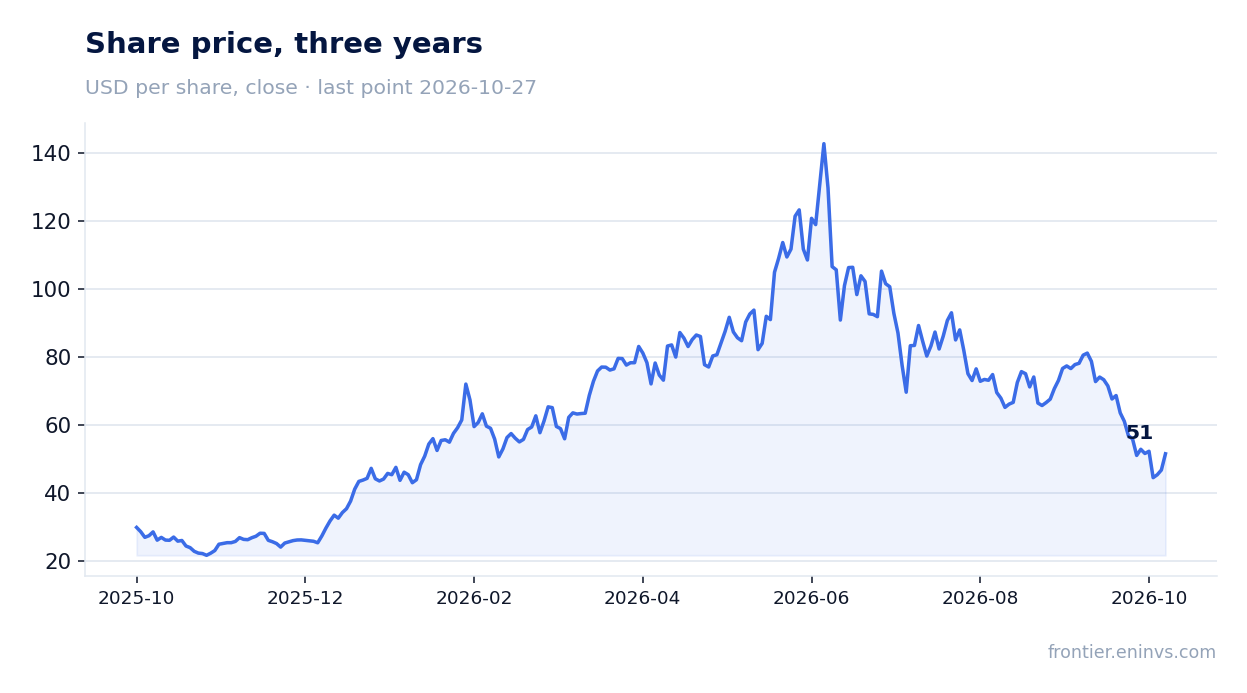
Since the report was published, the share has risen 10.2% and trades at $46.71. Market capitalisation is $2.34 billion. If the company can improve conversion of profit into cash flow, the multiples could decline without a fall in the share price. Otherwise, the valuation will remain under pressure.
Valuation on the latest reported figures
| Metric | Value |
|---|---|
| Market cap | 2.34 bn USD |
| P/E (LTM) | 88.1 |
| EV/EBITDA (LTM) | 19.1 |
| P/B | 3.29 |
| Net debt / EBITDA (LTM) | 2.47 |
| ROE | 7.6% |
Bottom line
The strong side of the report is revenue acceleration to 48.8% and margin expansion, along with confident fourth-quarter guidance. The weak side is negative cash flow and rising debt. One-off items supported profit but not cash. The question for a holder now is whether the company can convert growth into cash without increasing debt. In our view the share is rather attractive: the portal's model implies +31%, but the risks warrant attention.
Open the company's financial profile UCTT →
See also: market overview · valuation map · stock screeners