UDR: profit jumped 5.4x, but almost all of it came from selling two properties, not from rent
On 21 October UDR released preliminary results for the third quarter of 2026. Revenue came in at USD 428.1 million, down 0.9% year on year, EBITDA at 245.2 million (–1.7%), and net profit at 216.1 million versus 40.4 million a year earlier. The 5.4x profit jump was driven by the sale of two communities in Seattle and Nashville for 183.0 million dollars; without that one-off gain the result would have been more modest. The company nonetheless raised its full-year guidance for net income and FFOA per share, and the 1.74 dollar annual dividend yields about 4.5% at the current price – the stock looks rather attractive for income than for growth.
Key takeaways
— Revenue has decelerated for three straight quarters: from +2.8% in Q3 2025 to –0.9% now
— The 57.3% EBITDA margin holds at last year's level, but 88% of profit comes from asset sales
— Debt rose from 5.8 to 6.6 billion dollars in the quarter – up 0.7 billion, eating into sale proceeds
— Operating cash flow of 201.8 million dollars does not cover 71.4 million of capex plus dividends
— The 1.74 dollar annual dividend yields about 4.5% – above most REITs, but payout exceeds 100% of FFO
— Full-year guidance was raised for net income to 1.58–1.60 dollars per share but cut for FFO to 2.48–2.50
Attractiveness
Key figures, USD bn
| Metric | Q3 2025 | Q3 2026 | Change |
|---|---|---|---|
| Revenue | 0.43 | 0.43 | -0.9% |
| EBITDA | 0.25 | 0.25 | -1.7% |
| Operating profit | 0.08 | 0.27 | +253.7% |
| Net profit | 0.04 | 0.22 | +434.9% |
| Operating cash flow | 0.23 | 0.20 | -14.1% |
| Capex | 0.00 | 0.07 | — |
| EBITDA margin | 57.7% | 57.3% | -0.4 pp |
| Net margin | 9.4% | 50.5% | +41.1 pp |
Revenue has decelerated for three straight quarters: from +2.8% in Q3 2025 to –0.9% now
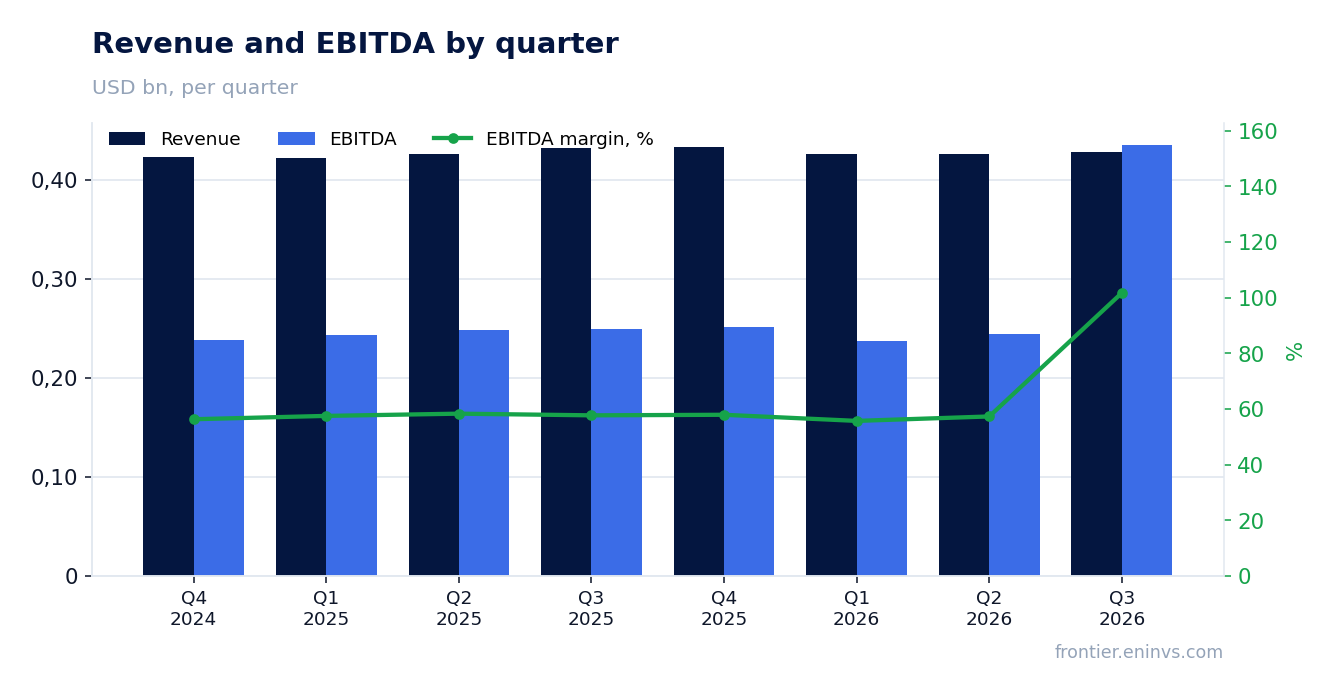
Revenue for the third quarter of 2026 was 428.1 million dollars – 0.9% less than a year earlier. This continues a deceleration: growth was 2.4% in Q2 2025, 2.8% in Q3, 2.5% in Q4, 0.9% in Q1 2026, zero in Q2, and now negative. The slowdown has been steady quarter by quarter, with no reversals.
The cause is not falling rent but the exhaustion of rate growth. Effective blended lease rate growth on same-store communities was 2.0% in Q3 versus 2.2% for the nine months, with occupancy at 96.5%. The company itself excludes 19 communities going into the Apollo joint venture from the same-store base – without that exclusion revenue growth would have been 1.5%, not 1.8%.
For a holder this means organic growth has nearly stalled. Revenue of 428.1 million dollars is the level of Q3 2025 (431.9 million), so the company has been flat for a year. Further dynamics depend on whether occupancy holds above 96% and whether concessions to new tenants become necessary.
The 57.3% EBITDA margin holds at last year's level, but 88% of profit comes from asset sales
EBITDA for Q3 was 245.2 million dollars at a 57.3% margin – versus 57.7% a year earlier. The margin barely moved despite lower revenue: same-store expenses rose 2.2%, faster than revenue (1.8%), but the company held operating profit at 270.2 million dollars.
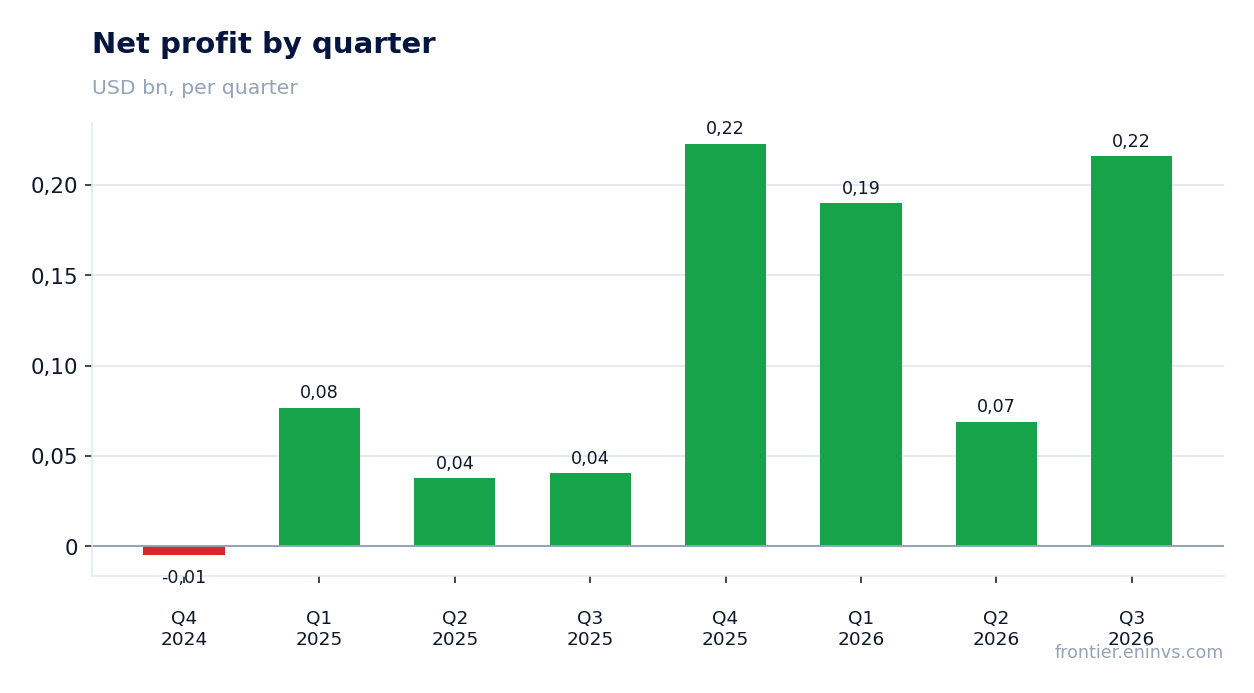
The key in the report is not the operating part but the one-offs. Net profit of 216.1 million dollars includes 190.1 million of gain on property sales: two communities in Seattle and Nashville with 412 apartments sold for 183.0 million dollars. Without that sale profit would have been about 26 million – roughly in line with 40.4 million a year earlier.
The 50.5% net margin versus 9.4% a year earlier is entirely a sale effect, not an operating improvement. For assessing business sustainability FFOA matters more: 0.65 dollars per share, exactly at last year's level. The company itself shows that the operating result did not grow.
Debt rose from 5.8 to 6.6 billion dollars in the quarter – up 0.7 billion, eating into sale proceeds
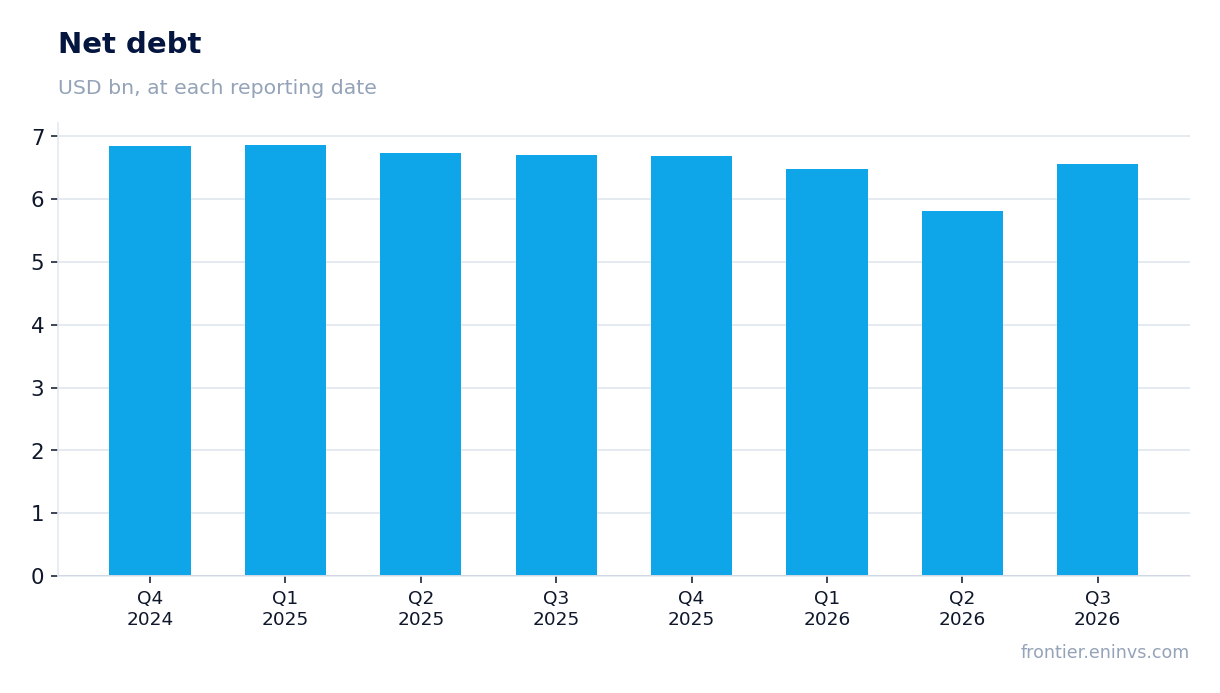
Net debt at 30 September 2026 was 6.6 billion dollars versus 5.8 billion at 30 June – up 0.7 billion in the quarter. Over the year debt barely changed: from 6.7 billion at 30 September 2025 to 6.6 billion now, a 0.2 billion reduction. So the quarterly jump is not a long-term trend but a one-off move within the year.
The cause is the buyout of interests in joint ventures in the debt and preferred equity portfolio. The company acquired 483 apartments in the Inland Empire and 286 in Portland, paying 235.0 million dollars in cash against a combined valuation of 354.4 million. At the same time it received 183.0 million from the sale of two communities and 103.2 million from contributing a Nashville community to the LaSalle joint venture.
The debt-to-EBITDA ratio is not disclosed in the facts, so the direction of leverage cannot be assessed. But absolute debt of 6.6 billion against annual EBITDA of about 1.0 billion (245.2 million per quarter) is roughly 6.5x, high for a REIT. Servicing such debt at rates above 4% absorbs a significant part of operating cash flow.
Operating cash flow of 201.8 million dollars does not cover 71.4 million of capex plus dividends
Operating cash flow in Q3 was 201.8 million dollars, capex 71.4 million. After capex 130.4 million remains. Dividends for the quarter: 0.145 dollars per share per month, i.e. 0.435 per quarter on 346.0 million shares – about 150.5 million dollars. Free cash flow does not cover the payout; the gap is filled by asset sales and new debt.
For the nine months the picture is the same: operating cash flow 725.4 million dollars (LTM), quarterly capex rose from zero a year earlier to 71.4 million. The company increased investment in repairs and redevelopment, which pressures free cash flow.
The 1.74 dollar annual dividend against FFOA of 2.55 dollars per share (full-year guidance) gives a payout of about 68% of FFOA – sustainable. But against net income the payout exceeds 100%, because profit includes one-off sales. If sales stop, the dividend would have to be paid from debt or cut.
The 1.74 dollar annual dividend yields about 4.5% – above most REITs, but payout exceeds 100% of FFO
The company pays 0.145 dollars per share monthly, i.e. 1.74 dollars a year. At the current price that is about 4.5% yield. For a REIT this is above average: most pay 3–4%. The dividend is declared for October, November and December 2026, paid in cash.
Our estimate for the 2026 dividend is 1.74 dollars per share, i.e. at last year's level. It rests on FFOA guidance of 2.54–2.56 dollars per share and a payout of about 68%. The risk is that FFOA guidance was cut from 2.49–2.57 to 2.54–2.56, i.e. the upper bound was lowered. If the operating result deteriorates, the payout will rise.
What could make the payout smaller: occupancy falling below 96%, expenses growing faster than revenue (already 2.2% versus 1.8%), and the need to direct cash to debt repayment. With 6.6 billion of debt and rates above 4%, interest expense absorbs about 260 million a year – more than the dividend.
Full-year guidance was raised for net income to 1.58–1.60 dollars per share but cut for FFO to 2.48–2.50
The company raised net income per share guidance from 1.03–1.11 to 1.58–1.60 dollars – a midpoint increase of 0.52 dollars. This is a consequence of asset sales: gain on real estate sales of 1.10 dollars per share is built into the forecast. Without sales guidance would be about 0.48–0.50 dollars.
FFO guidance, by contrast, was cut from 2.47–2.55 to 2.48–2.50 dollars – the upper bound lowered by 0.05 dollars. FFOA was raised from 2.49–2.57 to 2.54–2.56 dollars, but mainly due to one-off items: legal costs, severance and insurance. Same-store operating guidance: revenue growth 1.4–1.8%, expenses 2.7–3.1%, NOI 0.8–1.2%.
What matters for the investor is that full-year NOI guidance is just 1.0% at the midpoint. This confirms organic growth is nearly zero and the company compensates with sales and joint ventures. The next report is on 2 November, when final figures will be released.
Valuation on the latest reported figures
| Metric | Value |
|---|---|
| Operating cash flow (LTM) | 0.73 bn |
| ROE | 28.5% |
Bottom line
The strong side of the report is the stable 57.3% EBITDA margin and the raised profit guidance, but that raise comes entirely from sales, not rent. Operating cash flow of 201.8 million dollars does not cover capex and dividends, and debt rose 0.7 billion in the quarter. The 1.74 dollar annual dividend yields about 4.5% – above the market – but the payout of about 68% of FFOA keeps it sustainable. The verdict is rather attractive for income, not for growth: the stock is interesting for its dividend, not for revenue dynamics.
Open the company's financial profile UDR →
See also: market overview · valuation map · stock screeners