UNITEDHEALTH GROUP INC: profit up 75% while revenue falls for the first time in a year
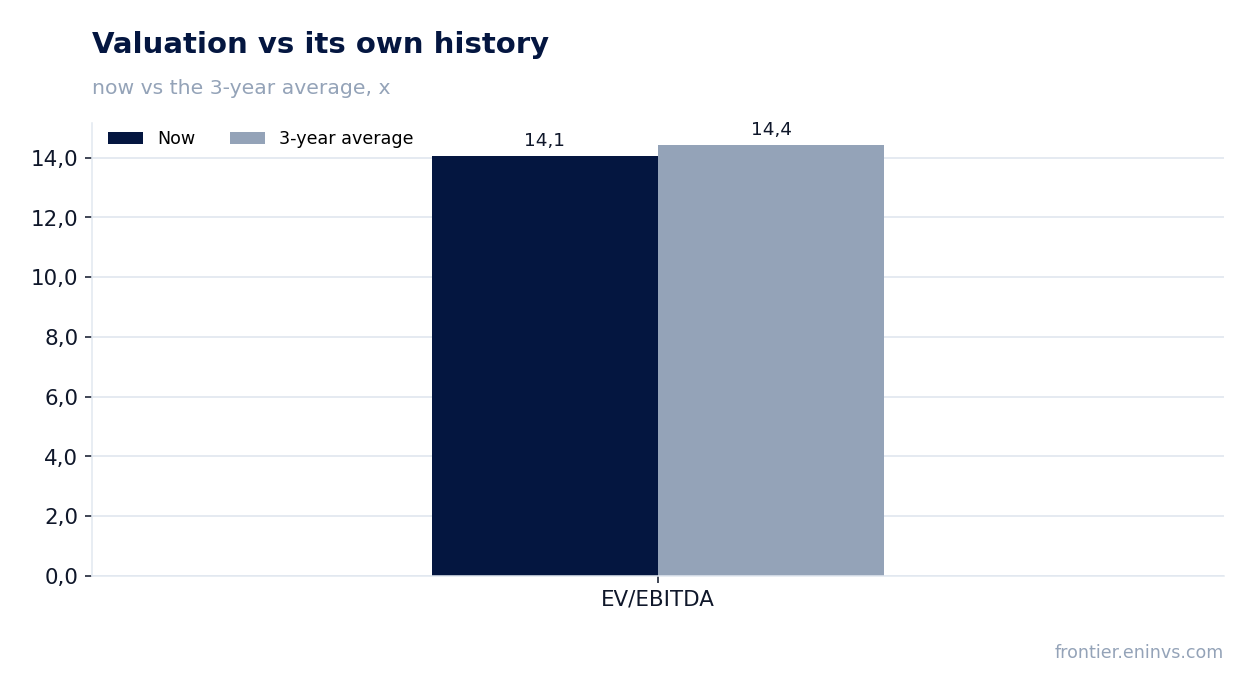
On 13 October UNITEDHEALTH GROUP INC reported third-quarter 2026 results. Revenue came in at $112.7 billion and fell for the first time in a year – down 0.4% year on year after 0.4% growth in the prior quarter. Net profit nevertheless rose 75% to $4.1 billion, lifting the net margin from 2.1% to 3.6%. With EV/EBITDA at 14.1 – in line with its own three-year average of 14.4 – and a dividend yield of 2.4%, the share is fairly valued: profit growth is not yet backed by revenue, so the verdict is neutral.
Key takeaways
— Revenue fell for the first time in a year – down 0.4% after 0.4% growth in the prior quarter
— Profit rose 75%, but one-off factors, not operating leverage, drove the gain
— The medical care ratio improved to 88.4% on cost management and pricing discipline
— UnitedHealthcare returned to profitability: operating margin 3.3% versus 2.1% a year earlier
— Optum Health cut revenue by 10% but lifted its margin from 0.2% to 3.2%
— Leverage at 1.92x EBITDA and debt-to-capital at 41.7% – moderate for the sector
— Dividend yield of 2.4% with $6.2 billion paid out over nine months
Attractiveness
Key figures, USD bn
| Metric | Q3 2025 | Q3 2026 | Change |
|---|---|---|---|
| Revenue | 113 | 113 | -0.4% |
| EBITDA | 5.41 | — | — |
| Operating profit | 4.32 | 6.56 | +52.1% |
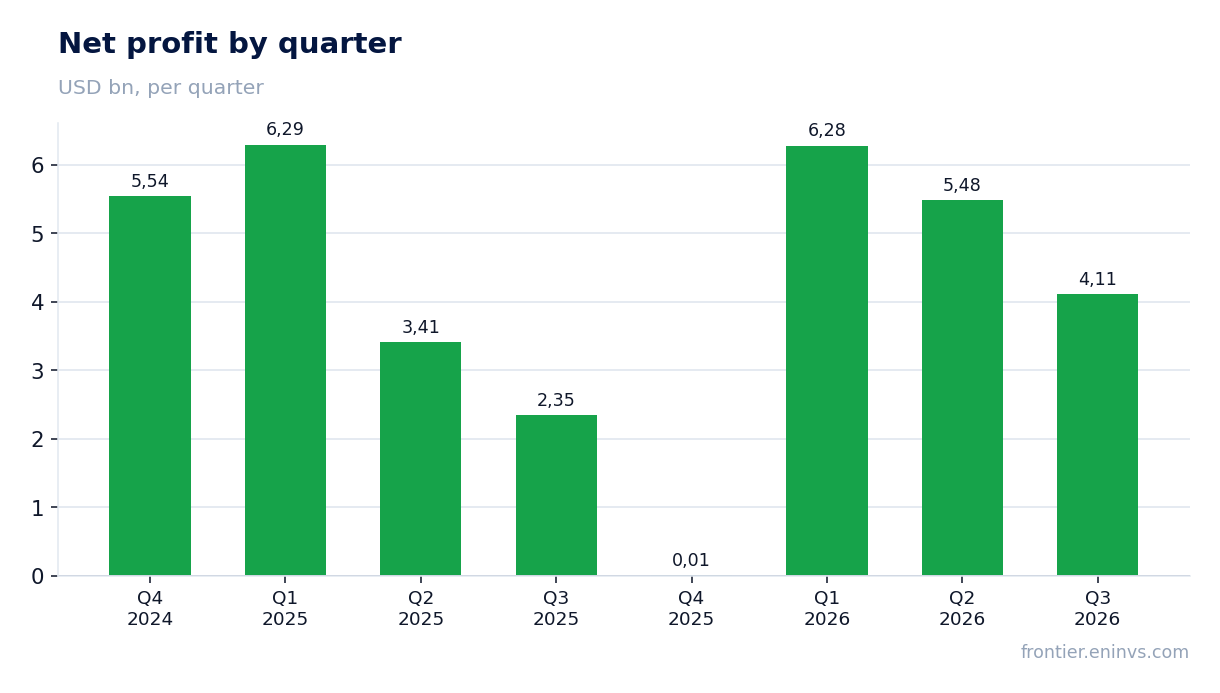
| Net profit | 2.35 | 4.11 | +75.0% |
| Operating cash flow | 5.95 | 5.10 | -14.2% |
| Capex | 0.89 | — | — |
| EBITDA margin | 4.8% | — | — |
| Net margin | 2.1% | 3.6% | +1.5 pp |
Revenue fell for the first time in a year – down 0.4% after 0.4% growth in the prior quarter
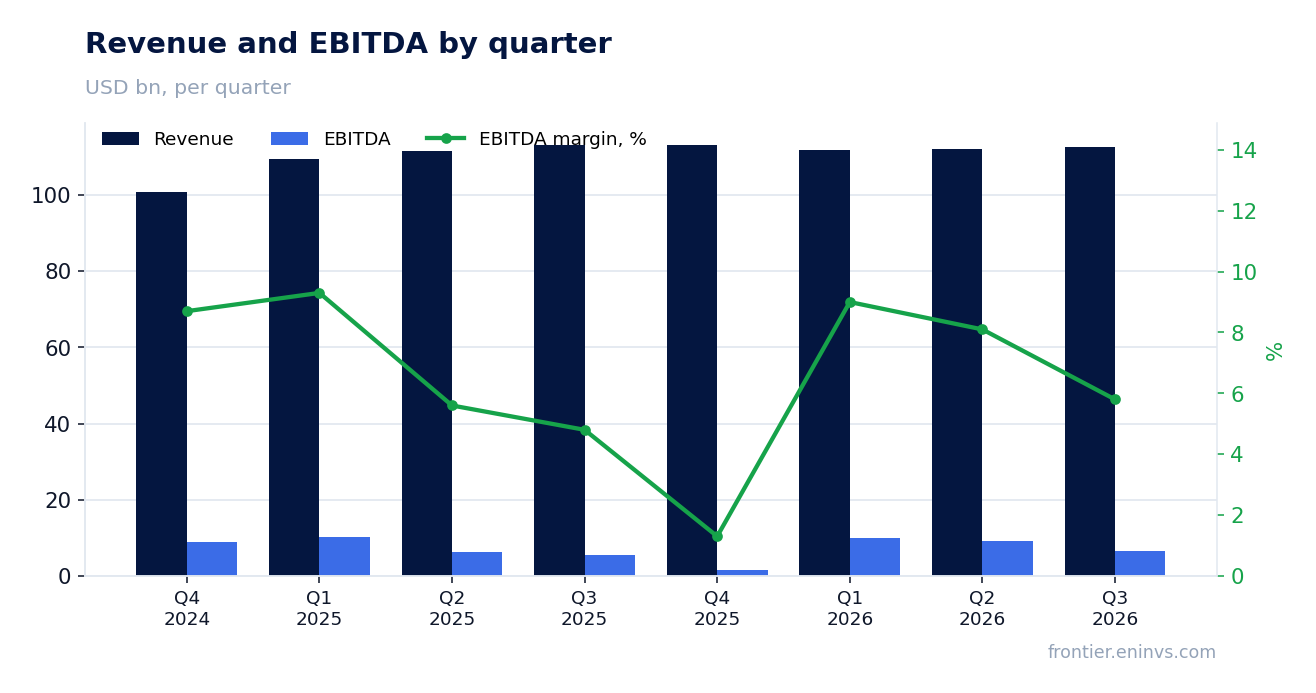
Third-quarter 2026 revenue came in at $112.7 billion versus $113.2 billion a year earlier. This is the first decline in a year: the prior quarter saw 0.4% growth, and before that 12.9% and 12.2%. The slowdown began in Q1 2026 with just 2.0% growth and has now turned negative.
UnitedHealthcare drove most of the contraction: its revenue fell to $86.3 billion from $87.1 billion a year earlier. Medicare Retirement slipped to $42.4 billion from $43.4 billion on membership and product-mix changes, while Community State declined to $23.7 billion from $23.8 billion amid ongoing Medicaid eligibility changes. People served dropped to 48.3 million from 50.1 million a year earlier.
Optum also declined: revenue fell to $66.9 billion from $69.2 billion. Optum Health cut revenue by 10% to $22.9 billion due to fewer value-based care patients in markets where the company lacked sufficient presence to sustain its clinicians. Optum Rx and Optum Insight grew to $39.9 billion and $5.5 billion respectively.
Nine-month 2026 revenue totalled $336.4 billion versus $334.4 billion a year earlier. Growth of 0.6% marks a sharp deceleration from double-digit rates last year. The question for the next report is whether the revenue decline persists or reverses.
Profit rose 75%, but one-off factors, not operating leverage, drove the gain
Third-quarter 2026 net profit came in at $4.1 billion versus $2.3 billion a year earlier – up 75%. The net margin rose to 3.6% from 2.1%. Operating profit grew to $6.6 billion from $4.3 billion.
One-off factors partly explain the profit improvement. The medical care ratio was 88.4% versus 89.9% a year earlier, and the quarter included $610 million of net favourable prior-period reserve development related to 2026 dates of service. Without this effect, the margin would have been lower.
The operating cost ratio fell to 12.8% from 13.5% a year earlier. The company attributes this to realised operating efficiencies partly offset by accelerating investments in technology, processes and people. The 0.7 percentage-point decline in the operating cost ratio added roughly $0.8 billion to operating profit.
One-off items also include $224 million of losses from portfolio divestitures and South American impacts, plus $74 million of restructuring charges. Adjusted operating profit was $6.3 billion versus $4.3 billion a year earlier. The profit growth is real, but its durability depends on whether favourable reserve development persists.
The medical care ratio improved to 88.4% on cost management and pricing discipline
The medical care ratio in Q3 2026 was 88.4% versus 89.9% a year earlier. The 1.5 percentage-point decline reflects medical cost management, benefit design changes and pricing discipline, as well as care delivery enhancements focused on affordability and integrated value-based care.
The quarter included $610 million of net favourable prior-period reserve development related to 2026 dates of service. This means actual costs came in below previously reserved amounts. Such an effect flatters the current ratio but may not repeat.
Days claims payable were 47.0 – the same as in Q2 2026 and above 46.2 a year earlier. A rising figure can indicate slower payment or a change in claim mix. Days sales outstanding fell to 16.9 from 18.6 a year earlier.
The improvement in the medical care ratio is the key driver of profit growth. If it is sustainable, it changes the company's valuation. If it largely reflects one-off reserve development, next quarter's profit may come in lower.
UnitedHealthcare returned to profitability: operating margin 3.3% versus 2.1% a year earlier
UnitedHealthcare, the largest segment, reported operating profit of $2.8 billion versus $1.8 billion a year earlier. The operating margin rose to 3.3% from 2.1%. The improvement was driven by benefit changes and pricing discipline combined with medical and operating cost management.
Segment revenue declined to $86.3 billion from $87.1 billion. People served fell to 48.3 million from 50.1 million a year earlier. The main contraction came in Medicare Advantage – down 935,000 since year-end – and Medicaid, where eligibility changes continue.
Within Employer Individual, revenue rose to $20.2 billion from $19.9 billion, but people served fell by 165,000 in the quarter due to employer attrition. Medicare Retirement declined to $42.4 billion from $43.4 billion. Community State fell to $23.7 billion from $23.8 billion.
Margin expansion on falling revenue is the result of cost cuts and portfolio improvement. The company is exiting unprofitable lines and tightening discipline. The question is whether it can hold the margin if revenue continues to decline.
Optum Health cut revenue by 10% but lifted its margin from 0.2% to 3.2%
Optum Health, the value-based care unit, cut revenue by 10% to $22.9 billion from $25.4 billion a year earlier. The company attributes this to fewer value-based care patients in markets where it lacked sufficient presence to sustain its clinicians.
Operating profit nevertheless rose to $735 million from $41 million a year earlier, with the margin climbing to 3.2% from 0.2%. The improvement was driven by strengthened operational discipline and medical cost management across its value-based care markets.
Optum Insight grew revenue by 3% to $5.5 billion and operating profit to $1.3 billion from $920 million a year earlier. Growth came from enhanced product offerings and operational efficiencies. Optum Rx increased revenue to $39.9 billion from $39.7 billion and profit to $1.7 billion from $1.5 billion.
The revenue contraction at Optum Health is a deliberate exit from unprofitable markets. The margin rose, but on a smaller base. If the company continues to shrink its footprint, Optum revenue will decline while profitability may improve. This is a 'smaller but better' strategy.
Leverage at 1.92x EBITDA and debt-to-capital at 41.7% – moderate for the sector
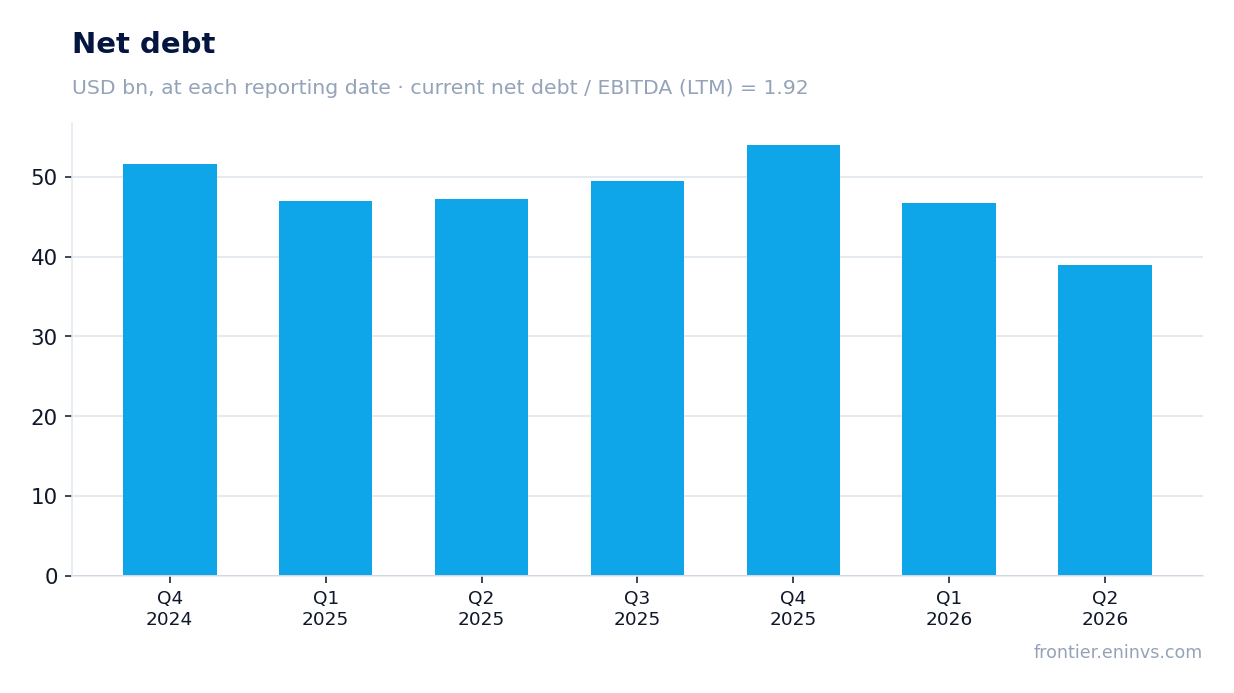
Net debt at the end of the latest reported year was $54.0 billion, equivalent to 1.92x trailing twelve-month EBITDA. The debt-to-capital ratio at 30 September 2026 was 41.7% versus 41.2% in the second quarter. The company targets a long-term ratio of approximately 40.0% by year-end.
Operating cash flow in Q3 2026 was $5.1 billion, or 1.2x net profit. For the nine months of 2026, operating cash flow reached $25.1 billion versus $18.6 billion a year earlier. Growth came from both higher profit and working capital changes.
Over nine months the company spent $2.4 billion on capital expenditure and capitalised software, $5.0 billion on share buybacks and $6.2 billion on dividends. Financing flows were negative $15.0 billion, covered by operating cash flow.
Leverage is moderate and cash flow is stable. The company can service its debt and return capital to shareholders. However, the rise in debt-to-capital from 41.2% to 41.7% over the quarter warrants attention, especially if revenue continues to decline.
Dividend yield of 2.4% with $6.2 billion paid out over nine months
Over the nine months of 2026 the company paid $6.2 billion in dividends, up 4.3% from $5.9 billion a year earlier. The dividend yield at the current price is 2.4%. This is a moderate level for a company of this scale and stability.
The company also repurchased $5.0 billion of shares over nine months. Total shareholder returns of $11.2 billion exceed operating cash flow less capital expenditure, which was about $22.7 billion over nine months. This is sustainable.
Our estimate for the 2026 dividend is based on adjusted earnings per share of at least $20.50, which the company guided. At a payout ratio of about 30%, the dividend per share could be around $6.15, implying a yield of about 1.6% at the current price. However, the company has historically raised its dividend, and the actual payout may be higher.
The risk to the dividend is further revenue and profit declines. If the one-off factors that supported Q3 profit do not repeat, the payout ratio could rise, limiting dividend growth. The company may also prefer to direct funds to share buybacks, which currently trade below our model's fair value.
Valuation: EV/EBITDA 14.1 in line with the three-year average of 14.4, portal model upside +22%
The trailing twelve-month EV/EBITDA multiple is 14.1, almost exactly in line with its own three-year average of 14.4 – a deviation of just 3%. This means the market values the company in line with its historical range, without a premium or discount.
The trailing twelve-month P/E is 21.5. With trailing twelve-month net profit of $15.9 billion and a market capitalisation of $342.2 billion, this reflects the current valuation. Return on equity is 5.3%, below the company's historical levels but reflecting current profit challenges.
On the portal's model, the fair value of the share implies +22% upside to the current price. The model uses EBITDA growth times the target multiple against market capitalisation. This is our own estimate, not a market consensus.
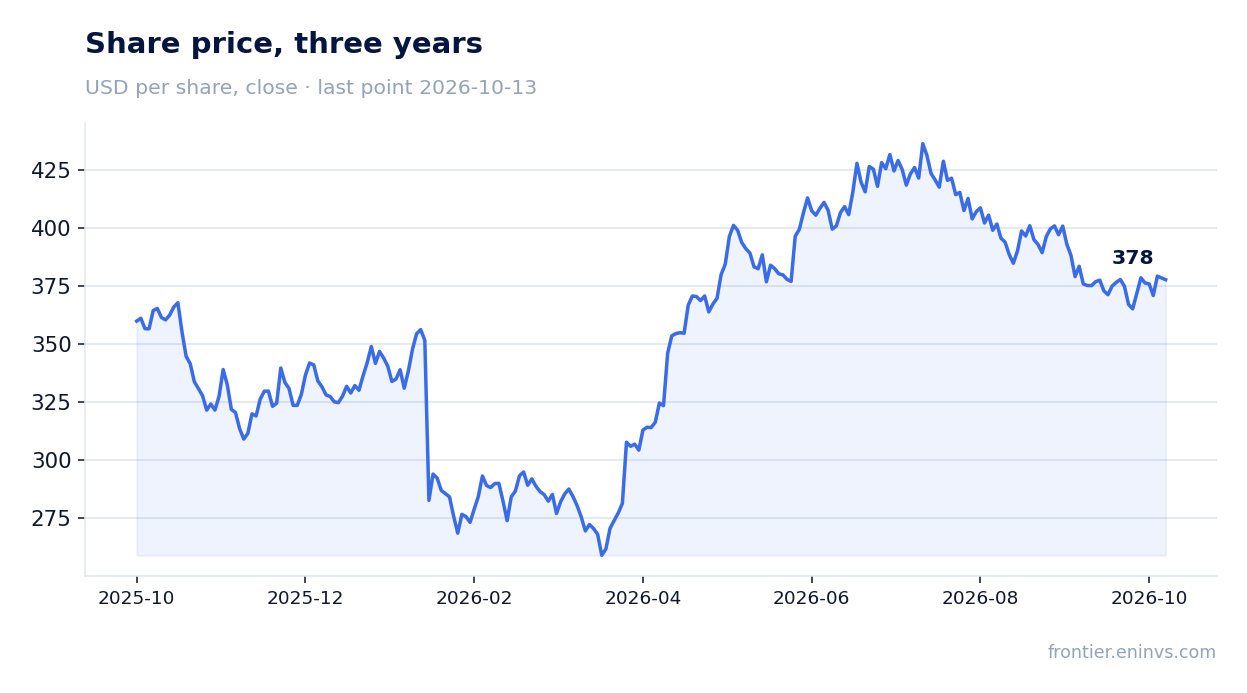
The share closed at $378.52 before the release, fell 0.2% on the release day and has lost another 0.2% since, through 13 October. The market reaction is muted: investors are likely weighing the sustainability of profit growth. At the current valuation, the share looks neither overvalued nor undervalued relative to its own history.
Valuation on the latest reported figures
| Metric | Value |
|---|---|
| Market cap | 342 bn USD |
| P/E (LTM) | 21.5 |
| EV/EBITDA (LTM) | 14.1 |
| P/B | 3.42 |
| Net debt / EBITDA (LTM) | 1.92 |
| Operating cash flow (LTM) | 26.2 bn |
| ROE | 5.3% |
| Dividend yield (12m) | 2.4% |
| EV/EBITDA, 3-year average | 14.4 |
Bottom line
The report showed the company's strength: cost and pricing discipline lifted profit by 75% and raised the margin to 3.6% even as revenue declined. However, part of that growth came from one-off reserve development of $610 million, and revenue fell for the first time in a year – down 0.4%. Leverage is moderate, the dividend is stable, but EV/EBITDA at 14.1 in line with the three-year average of 14.4 leaves no room for re-rating. The question for a holder now is whether the company can return revenue to growth, or profit will start to decline with it. The verdict is neutral: the share is fairly valued, and the current level implies neither significant upside nor downside.
Open the company's financial profile UNH →
See also: market overview · valuation map · stock screeners