US markets in October 2026: 5% Treasuries, 3.7% inflation, CAPE 40, the 1973 and 2000 analogues and our view
October 19, 2026. The S&P 500 closed the week at 7,659, 2% below its October 6 record. Over the same week the semiconductor index lost 11%, second-tier cloud operators 22-25%, enterprise software 7%. The 10-year Treasury yield is holding near 5.1%, the Fed raised rates in September for the first time since 2023, Brent is at $110, and producer prices rose 1.3% in September, the most since March 2022. Below we look at what is happening to rates, inflation, earnings and valuations, how similar setups played out before, what the strategists say, and where the data leads.
The US equity market has entered a de-rating driven by rising rates and financing costs, not by a recession. The base case is a long, uneven 10-20% correction from the record. A 1973/2000-type scenario with a 25-35% decline remains live and hinges on two variables: the oil price and the credit of AI companies.
- Rates are rising, and the Fed will most likely hike once more. On September 16 the target range was raised to 3.75-4.00%, and the market puts about 75% on a second hike in December. The 10-year yield reached 5.35% on October 7, its highest since 2002. The driver is not inflation expectations (stable near 2.3%) but real rates, a $2 trillion deficit and synchronized tightening in Europe and Japan.
- Inflation is accelerating at the headline and in the production chain, but not yet in core. CPI is 3.7% with core at 2.6%; gasoline, up 34% on the year, delivered more than half of the monthly increase. Producer prices are +6.3% y/y, core PPI 5.0%, import prices +8.1%. Household one-year inflation expectations stand at 4.7%.
- Cost inflation is already in the earnings reports, but only where fuel and food carry a large weight. Delta cut its profit guidance by a quarter because of jet fuel, J.B. Hunt grew revenue 20% and operating income 2%, PepsiCo lowered its outlook. At the index level the net margin is 14.9%, the second highest on record: chip makers and oil producers earn on the same shock that squeezes everyone else.
- Valuations are at records on every metric except one. The Shiller CAPE is 40.5 (higher only in 1999-2000), price/sales 3.78, dividend yield 1.06%, the lowest ever. The forward P/E of 19 looks ordinary, but it rests on 33% earnings growth in 2026, half of which is paper gains on investment revaluations.
- The real economy: a nominal boom and a real stall outside AI. PMIs at 54-55, capital goods orders +14%, global chip sales +144%. At the same time real wages are falling, car sales are -3.4%, air passenger traffic -2.8%, mortgages at 7.4%, consumer confidence at its lowest since 2014.
- Commodities are trading a supply shock. The Bloomberg Commodity Index is +33% year to date against +12% for the S&P 500. Gold, meanwhile, is 25% below its January peak. The market is pricing inflation fought with rate hikes, not currency debasement.
- The closest historical analogue is 1999-2000 combined with 1973. In every episode except 1987 the leaders broke weeks or quarters before the index. In the inflationary episodes (1973, 2022) long bonds did not protect; energy, commodities and gold did.
- The week of October 12-16 was a cost-of-money shock to the AI trade, not a drop in demand. The same week TSMC reported record revenue. Hedge funds sold AI stocks for six sessions in a row, retail bought a record $3.9 billion of the triple-leveraged semiconductor ETF. Money moved into defensive sectors, bond yields fell. That is what rotation looks like, not panic.
Rates: the 10-year near 5.1%, driven by the deficit and oil, not by a breakdown in inflation expectations
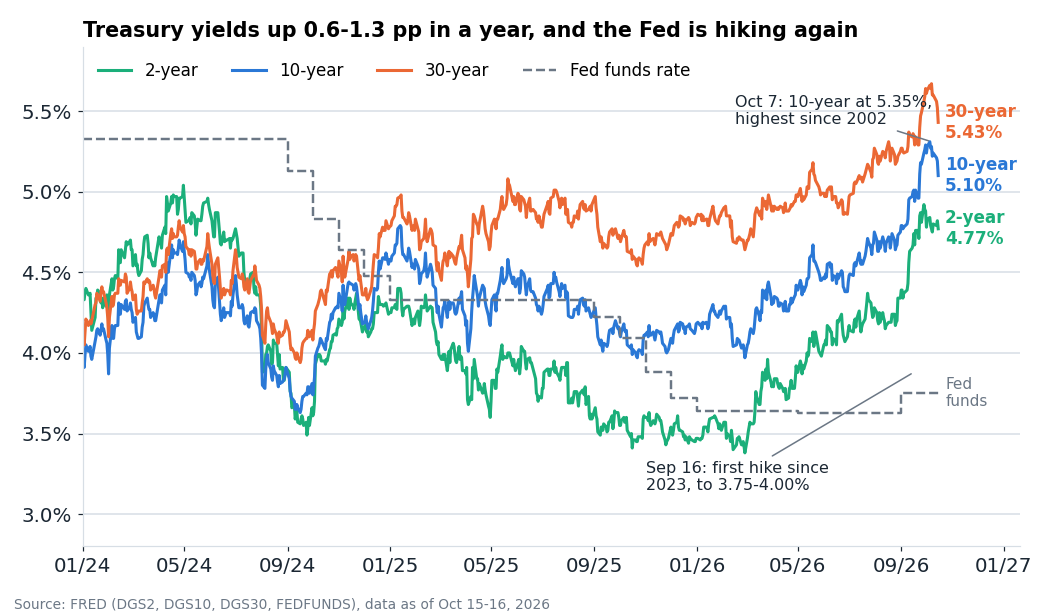
On October 16 the Treasury curve stood at 2-year 4.74%, 10-year 5.09%, 30-year 5.43%, up 127, 90 and 57 bp respectively since the start of the year (US Treasury). The 10-year touched 5.35% on October 7, and the 30-year bond auctioned on October 8 cleared at 5.618%, the highest since August 2000. The spread between 10-year and 2-year yields has compressed from 72 to 35 bp. A flattening of this kind means the market expects more hikes: a 2-year yield of 4.74% against a funds-rate midpoint of 3.875% discounts two to three more 25 bp steps.
On September 16 the Fed raised the target range to 3.75-4.00% by a unanimous vote, the first hike since 2023 (FOMC statement). The median projection for end-2026 and end-2027 is 4.1%, that is, one more hike. In the minutes, "most participants" judged it appropriate before year end and described policy as "not restrictive or only mildly so" (minutes). Chair Kevin Warsh, who took over in May, does not submit his own dot and said on October 16 that the Fed is "not in the forward-guidance business anymore". The odds of an October 28 hike then fell to 13-16%, while a December hike is priced at 72-76% on Kalshi and Polymarket and about 89% on CME FedWatch. The committee's hawks are explicit: Dallas Fed President Lorie Logan says the rate needs to rise "an additional 50 basis points or more", Governor Waller "anticipates additional hikes".
The long end is not being driven by inflation expectations. The 10-year TIPS real yield is 2.78%, the implied breakeven 2.32%, the five-year forward inflation rate 2.33%, and in the week of the hottest PPI print in four years these numbers did not move. The term premium on the New York Fed model is 0.81%, and the Fed minutes attribute the rise in yields to "higher term premiums, geopolitical developments, and heavy AI-related debt issuance". The Bank for International Settlements says the same: premia rose on "fiscal pressures rather than inflation concerns". The pressure is concrete. The US budget deficit for fiscal 2026 was $2.0 trillion, interest outlays exceeded $1 trillion for the first time, and debt held by the public is about 100% of GDP (CBO). Japan has cut its Treasury holdings for a fourth straight month, China's are at an 18-year low. Tightening is global: the ECB is at 2.50% after two hikes this year, the Bank of Japan at 1.25%, 30-year UK gilts yield 6.04%, 30-year JGBs a record 4.235%. Japanese capital, which bought long Treasuries for decades, now finds yield at home.
Investment banks mostly expect one or two more hikes (Goldman: a pause in October and "a second and final hike in December"; Morgan Stanley: December and March to 4.25-4.50%), followed by a decline in the 10-year yield to 4.5-4.85% by end-2027. BofA stands apart at 5.0-5.1%. That consensus assumes a reversal of the term premium and a retreat in oil, and neither is in hand yet. The more cautious reading: the funds rate goes to 4.00-4.25% in December, this year's peak in long yields has probably passed unless oil breaks above $120, and the 10-year spends the next two quarters in a 4.75-5.35% range where every auction and every inflation print matters more than usual.
Inflation: gasoline delivered more than half of the CPI increase, and producer prices are rising twice as fast as consumer prices
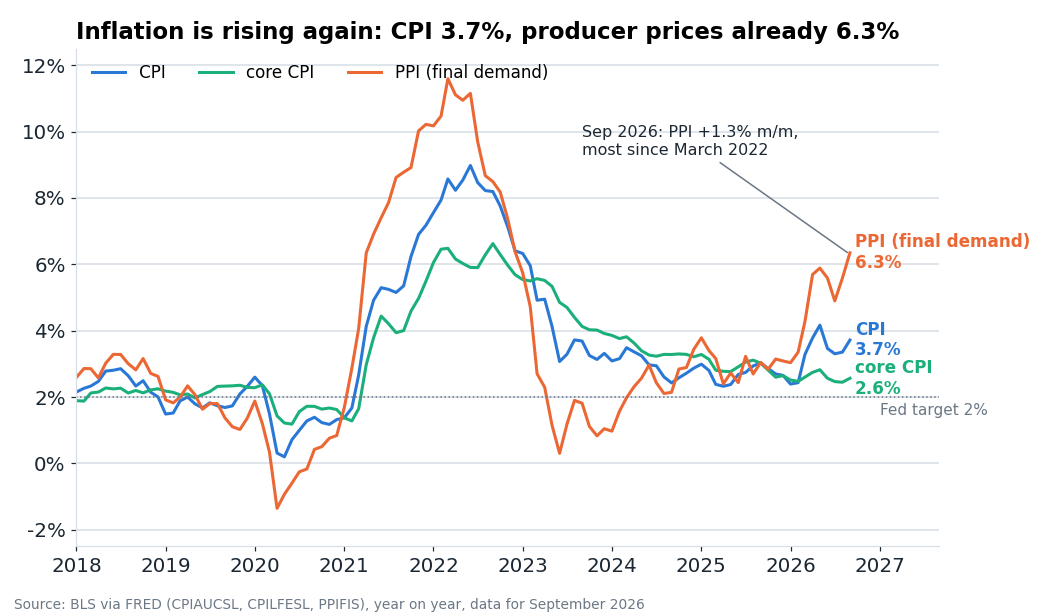
September CPI rose 0.6% on the month and 3.7% on the year, after 3.4%. Energy is +20.4% y/y, gasoline +34.2%, and by the BLS's account gasoline delivered more than half of the monthly increase (BLS). Core CPI is 2.6%, core goods just +0.7% y/y: the 2025 tariff effect has run its course. By our calculation the three-month annualized rate is about 4.5% for headline and 3.2% for core, so momentum is worsening. The Fed's preferred gauge is softer: August PCE 3.4%, core 3.0%.
The production chain is where the picture turns hot. PPI final demand rose 1.3% in September, the most since March 2022, and 6.3% on the year. Core PPI is 5.0%, intermediate goods +14.1%, unprocessed goods +21.5% (BLS). Import prices are +8.1% y/y, the most since 2022. The ISM prices indexes are 77.9 in manufacturing and 74.0 in services, the highest since July 2022, and not a single industry reported lower prices paid. The gap between core PPI at 5.0% and core CPI at 2.6% is the widest since 2021-2022. It closes either through company margins or through consumer price increases in 2027. Fuel retailers' margins fell 30% in September, which means gas stations have so far absorbed part of the gasoline spike, and that cannot last.
Expectations are split the same way they were in 2022. Market-based measures are calm (2.3%), household measures are rising: in the University of Michigan survey one-year inflation expectations are 4.7% and 5-10-year expectations 3.5%, the highest since May and well above the 2024 range of 2.8-3.2%. Wages are growing 3.0% against 3.7% inflation, real incomes are falling, and in the October Beige Book workers are changing jobs because "wage increases lagged inflation" (Beige Book). This is the data that keeps the December hike live regardless of what PCE shows.
Two secondary forces are tariffs and AI itself. Tariffs are weaker than in 2025: the Supreme Court struck down most IEEPA duties in February, the average rate is about 11%, and importers have received about $145 billion in refunds. New York Fed research shows the indirect channel through producer prices "more than doubles between six and twelve months", so the replacement tariffs of mid-2026 will feed into PPI through mid-2027. AI is the new force: the Minneapolis Fed estimates that AI equipment prices, +12.2% y/y, add about 0.4 pp to core PCE, and the Fed minutes record that "AI effects appeared to grow as tariff effects waned".
Earnings: cost inflation sits in the reports of airlines, truckers and food companies, and the index does not see it
The aggregate says costs are not eating earnings. By FactSet's count, S&P 500 earnings per share for the third quarter are growing 29.0% on revenue growth of 12.6%, the third straight quarter above 25%, with 84% of companies beating estimates (FactSet, Oct 16). The quality is weak, though. The average surprise is only +2.6% against a five-year norm of 7.5%. Micron and Nvidia together deliver nine points of growth; without them the index grows 20%. Energy earnings are +128% on oil that averaged 32% more over the quarter than a year earlier. The net margin of 14.9% is the second highest since 2009, but below the record 17.0% of the second quarter, which was inflated by paper gains at Alphabet ($98 billion) and Amazon ($53 billion) from investment revaluations. The margin is held up by IT (32.3% against a five-year average of 25.9%) and energy. In six of eleven sectors margins are lower than a year ago, and in health care and real estate they are below their five-year averages.
Company reports map exactly onto the PPI components. Delta: fuel +62%, adjusted operating margin 9.4% against 11.1%, full-year profit guidance cut from $6.50-7.50 to $5.10-5.60 per share, and the CFO explains the cut in one phrase: "All of it is fuel". For the fourth quarter the airline assumes jet fuel at $4.25 per gallon against $3.61 in the third, so the larger hit lies ahead. J.B. Hunt: revenue +20%, operating income +2%, fuel at 7.1% of revenue against 5.4%, insurance +23%. PepsiCo: core operating margin -35 bp, North American snacks -280 bp, full-year profit growth guidance cut from 4-6% to 1-2%; the company names "operating cost inflation" outright and warns that $178 million of tariff refunds "goes away" after the third quarter while commodity hedges expire. Fastenal: gross margin -40 bp even though pricing added 240 bp to sales growth. McCormick raised its cost-inflation guidance to 6-7%, P&G warned in advance of $1 billion in additional raw material, energy and logistics costs. Even the banks, with a "very healthy consumer", showed expense growth of 12% at JPMorgan and 14% at Bank of America and cited wage inflation among the reasons. The Beige Book sums up the demand side: "higher oil prices permeated all District reports", and consumer companies report "tighter profit margins as price-sensitive customers continue to resist price hikes".
The counterweight is capacity-constrained technology, where price does the work for them. TSMC posted a gross margin of 66.4% and guided to 14% sequential revenue growth; ASML has a 57.5% margin and a warning that in 2027-2028 supply may not cover demand. But cost inflation has reached the hyperscalers too, in the form of component prices and depreciation. Microsoft attributes about $25 billion of its 2026 capex to higher component prices, its quarterly depreciation has risen from $5.8 to $9.0 billion, and its gross margin of 67.6% is the lowest since 2022, even after it extended data-center useful lives from 15 to 25 years. The combined 2026 capex plan of the four largest hyperscalers is $720-745 billion, Oracle's free cash flow for the quarter was -$5.4 billion, and nobody has yet guided for 2027.
The answer to "is cost inflation visible in earnings" is this: yes, in airlines, transport, packaged food, distribution and energy-intensive European industry, visibly in hyperscaler gross margins, and not at all in the aggregate, because semiconductors and oil producers profit from the same shock. The real test is ahead for two reasons. Tariff refunds were a one-off gift of the second and third quarters and are now reversing. Consensus already models earnings growth collapsing from +19.3% in the first quarter of 2027 to +2.8% in the second, when the base effects from memory chips and oil lap, so there is almost no cushion in estimates for the period when the hedges expire.
Valuations: CAPE 40.5, dividend yield 1.06%, and stocks pay less than bonds for the first time since 2002
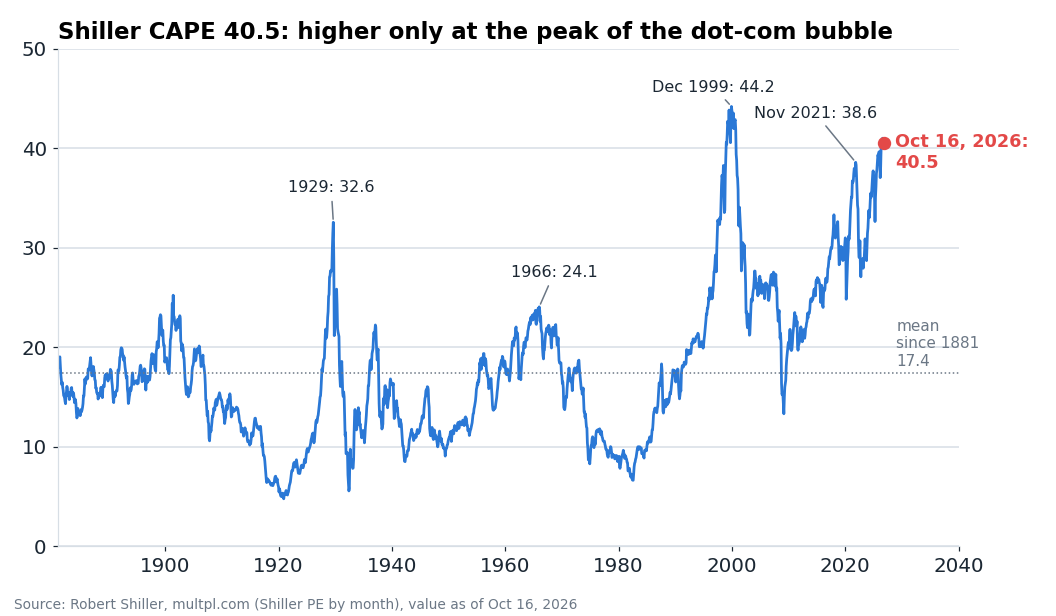
By any trailing or cyclically adjusted yardstick US stocks are historically expensive. The Shiller CAPE on October 16 was 40.54 against an average of 17.4 since 1881 and a record of 44.19 in December 1999. Only 19 months in history have been above today's level, all of them in 1999-2000 and 2026 (multpl). Price to sales is 3.78 against an average of 1.81, price to book 6.07, the trailing P/E 26 against an average of 16, and the dividend yield of 1.06% is the lowest in the entire record. Market capitalization to GDP was 244% at mid-year, 2.6 standard deviations above trend. Hussman's market cap to gross value added set a new record of 4.3 in August, above the 1929 and 2000 peaks.
The only metric that looks ordinary is the forward P/E. FactSet has it at 19.0 against a five-year average of 19.8 and a ten-year average of 19.1; a year ago it was 23.1. The compression came through earnings, not price: the index is up 11.9% year to date, and the earnings forecast rose faster. The denominator is suspect on three counts. Consensus assumes earnings growth of 32.8% in 2026 and another 16% in 2027. The market's leading bull, Ed Yardeni, concedes that first- and second-quarter growth was "inflated by mark-to-market investment gains", and Hussman calculates that without $160 billion of paper gains on private stakes S&P 500 earnings growth "would have been reduced by nearly half". The forward multiple also assumes that IT's record 32% margin persists. Restate 2026 earnings without the revaluations and the forward P/E comes out well above 19. This is the weakest of the "not expensive" arguments.
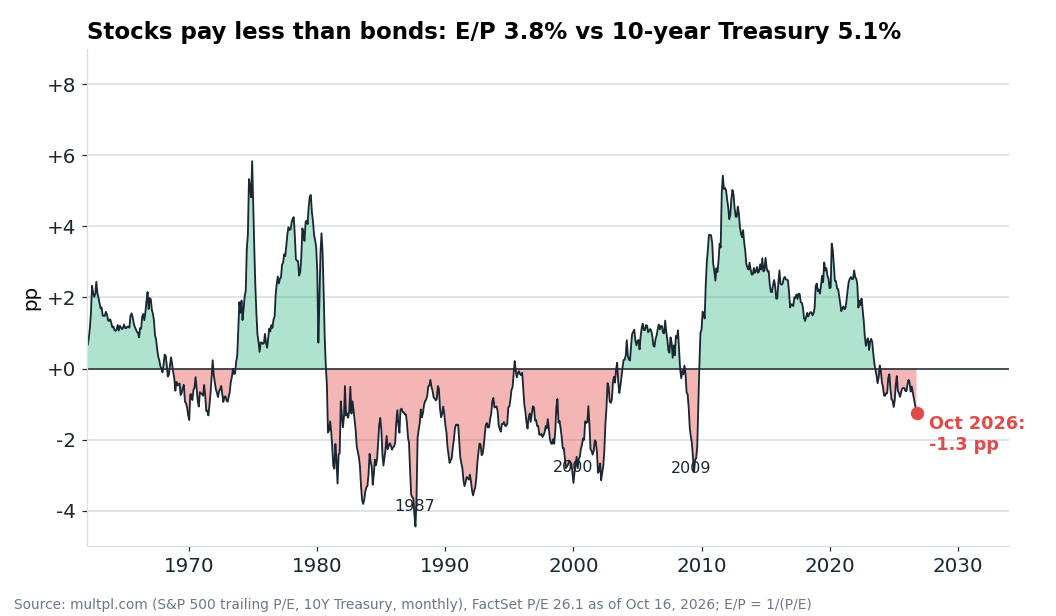
Against bonds there is no cushion left. With the 10-year at 5.1%, the trailing earnings yield of about 3.8% is 1.3 points below the Treasury yield, the forward earnings yield (5.3%) is roughly equal to it, and the dividend yield is four points below. Setting aside the earnings collapse of 2009, the last time stocks yielded this much less than bonds was 2002. Fund managers in the BofA survey say the 10-year would need to reach 5.9% for money to move from stocks into bonds. That is a statement about positioning, not valuation.
Concentration and positioning are the second half of the picture. The ten largest companies make up about 39% of the index against roughly 27% at the 2000 peak, the "Magnificent Seven" 32-35%, Nvidia alone about 8%. AI-linked stocks were valued at a record 45% of index capitalization in May, and the index excluding AI has gone nowhere since February. By Goldman's count, the median S&P 500 stock is 16% below its high while the index sits at a record. Households, according to the Fed, hold a record 48.2% of financial assets in equities, ten points more than at the 2000 peak. BofA private clients are at a record 66.4% in equities with a historically low cash share of 9.3%. Margin debt is $1.48 trillion, 31% more than a year ago. Fund-manager cash is 3.9%, and the technology overweight is the largest since August 2020. Short-term sentiment has already cooled (among AAII retail investors bears are 41.6% against 38.7% bulls), but, as BofA's Hartnett put it, "the cooling in market sentiment has not been accompanied by sufficient de-risking". The structural overallocation to equities is the clearest "few buyers left" indicator. It does not date the top, but it determines how far a decline can run once it starts.
Credit tells the same two-tier story. Index spreads are calm but off their lows: high yield 3.23% against 2.60% in August, investment grade 0.84% against 0.73%. The tail is stressed: CCC spreads are 12.8%, CoreWeave's five-year CDS set a record near 1,195 bp (more than 60% default probability), its 2031-2032 bonds trade at 76-81 cents on the dollar with $10.6 billion of maturities through end-2027, Oracle's CDS is at a record 288 bp. Gundlach notes that AI-related investment-grade bonds have widened about 50 bp while the rest of the market barely moved. In private credit, which by Carlyle's estimate could finance about $1 trillion of the AI buildout, redemptions are already under way: 39% of units were tendered at Blue Owl's technology fund.
Economy: leading indicators show no recession, but growth is narrow and rests on AI and high prices
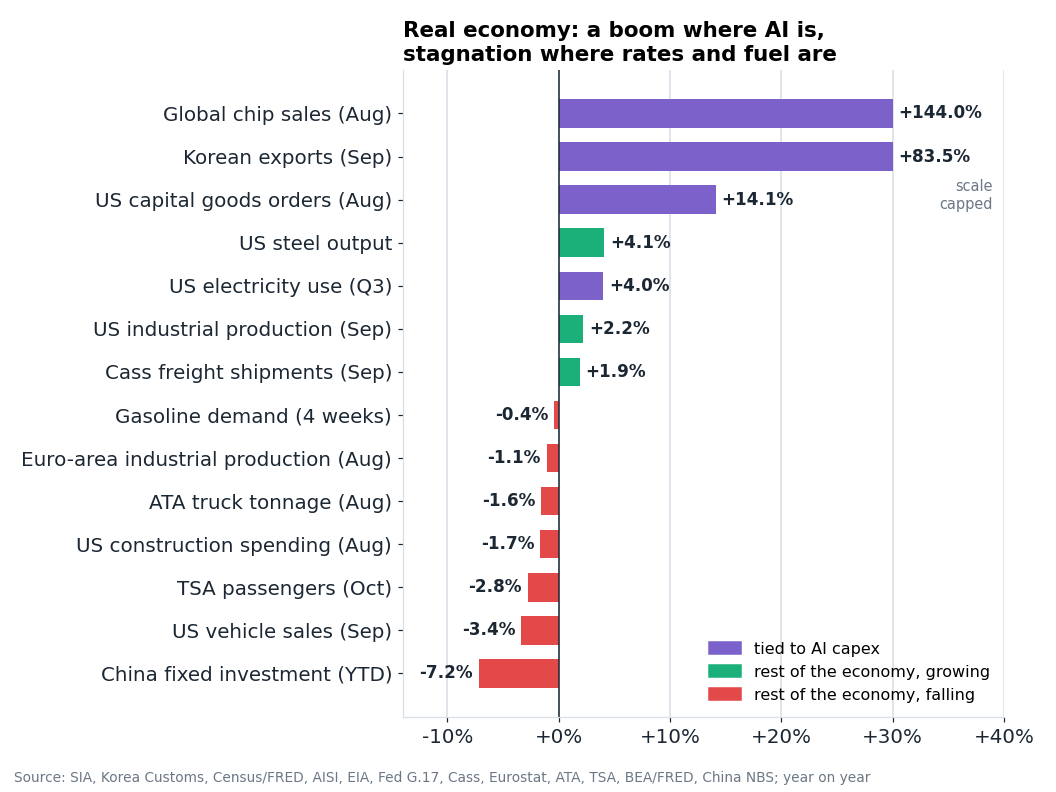
Surveys are strong, but with hot prices. ISM manufacturing is 54.5, services 54.9, and the S&P Global flash composite PMI hit 58.4 in September, the highest since 2021. The October regional Fed surveys diverged: New York 25.5, the highest since 2021, Philadelphia 20.9 with new orders collapsing from 29.2 to 4.3. The classic indicators are quiet: the leading economic index -0.1% for August, the Sahm rule at 0.00, the 10-year minus 3-month spread +83 bp, the Atlanta Fed's third-quarter GDP estimate 3.6%, though half of that is inventories. The Fed and the IMF expect 2.3% growth in 2026 and 2027, the Blue Chip panel puts a recession within a year at 29%, prediction markets at 5-6% for 2026 and about 19% for 2027.
The hard data split along one line: everything tied to AI capex is accelerating, everything that depends on rates or fuel is flat or falling. Industrial production rose 0.7% in September, but utilities (+3.5%) did the work, manufacturing was +0.3%, motor-vehicle output -3.0%, and capacity utilization at 76.9% is 2.5 points below its long-run average. The one line in a boom is semiconductors, +28.4% annualized for the quarter. Capital goods orders ex defense and aircraft are +14.1% y/y, US electricity consumption grew 4% in the quarter, double trend, the footprint of data centers. Global chip sales were +144% y/y in August, Korean exports +83.5% in September with a record $60 billion of chips, Japanese machine-tool orders at a record. On the other side, car sales are running at 16.4 million annualized, -3.4%, heavy-truck sales are 13% below their June peak, TSA passenger traffic -2.8%, truck tonnage -1.6%, euro-area industrial production -1.1%, and in China retail sales are +0.4% with investment -7.2% year to date. Freight captures the cost shock most precisely: shipment volumes on the Cass index are +1.9% y/y, freight expenditures +20.4%, diesel $6.18 per gallon, +69% on the year.
Housing is the obvious casualty of 5% Treasuries. The mortgage rate is 7.40% after seven straight weekly increases from 6.66%, builder sentiment is 32, the lowest in a year, 38% of builders are cutting prices, existing-home sales run at 3.99 million annualized. The labor market is in "low-hire, low-fire" mode: September payrolls +29 thousand with 60 thousand of downward revisions, unemployment 4.2% (already above the Fed's 4.1% median), and by Moody's estimate payroll growth excluding health care over the past year is "essentially zero", yet initial jobless claims are 199 thousand. The consumer spends in nominal terms (retail sales +0.8% in September, but +0.2% ex gasoline and roughly flat in real terms) and feels bad: the Michigan index is 46.3, the Conference Board index 81.9, the lowest since 2014, and its expectations component at 63.6 is far below the 80 level that, in the Conference Board's own words, "historically signals a recession within the next year". By the Beige Book, spending is "driven by high-income households", small businesses borrow at an average of 8.2%, the saving rate is 4.1%. Bank credit is not yet a constraint (BofA's card charge-offs improved to 3.22%), but that is a lagging indicator. The leading ones, falling real wages and the gap between sentiment and spending, point to a consumer carried by the top decile and by the wealth effect of the very AI stocks now under pressure.
Commodities: the best year since the early 2000s, for a bad reason
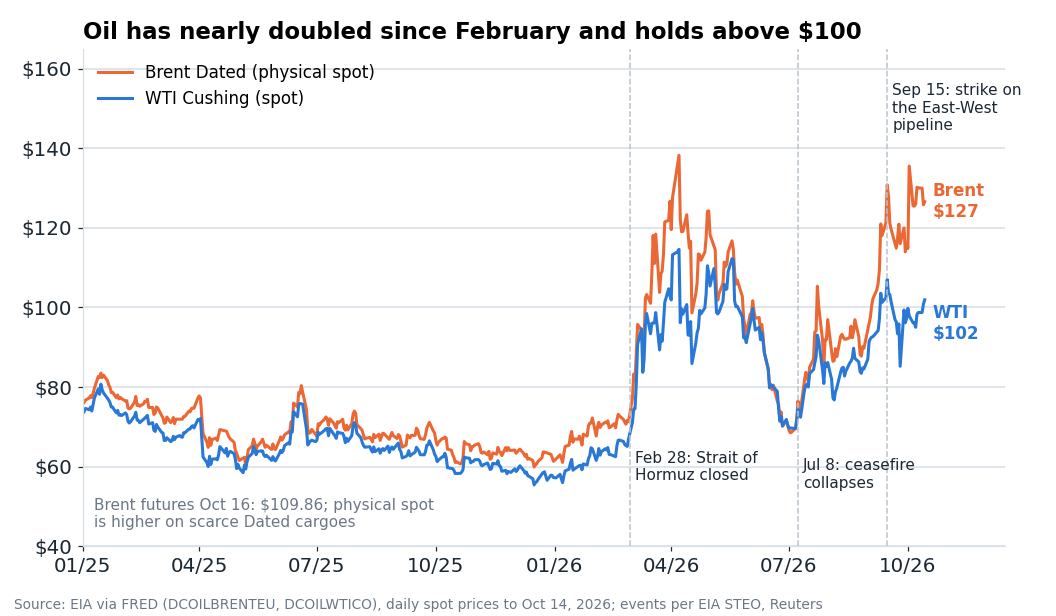
Commodities are having their best year since the early 2000s for reasons that are bad for the rest of the economy. The Bloomberg Commodity Index is +33% over three quarters with a 5% roll yield from futures, the highest since 2003, against +11.9% for the S&P 500. The dollar rose 3.5% over the year at the same time. Commodities and the dollar rising together break the usual inverse relationship and reveal a supply shock in the mold of 1973-1974, not a liquidity rally.
Oil is at the center. Brent futures settled at $109.86 on October 16, WTI at $101.41, the highest since May, after tanker attacks cut Hormuz flows to 11.6 million barrels a day against a baseline of 17.2 million. By the EIA's estimate, shut-in Gulf production averaged 4.8 million b/d in September (the peak was 10.9 million in May), observed global inventories are 509 million barrels below end-February, the US strategic reserve is at 283 million barrels, the lowest since 1982, and OPEC spare capacity is effectively zero, 0.02 million b/d, so OPEC+ quota decisions have no bearing on price (EIA STEO). US shale is not responding: the oil rig count is 459 and falling, the majors return half of free cash flow to shareholders, and respondents in the Dallas Fed survey expect WTI at $88 by year end because they consider the disruption temporary. Every base-case forecast is below spot and assumes de-escalation: the EIA sees Brent at $105 in the fourth quarter and $84 in 2027, JPMorgan $105 and $100 in the first quarter, and the futures curve, in roughly $20 backwardation between the first and twelfth month, prices the same path. The IMF's baseline assumes Hormuz shipments resume by March 2027; the IEA gives no date and warns that without a recovery in fuel supply "further demand reductions and the heavy economic costs these will entail may be needed" (IEA OMR). The bottleneck is not crude but diesel: US distillate stocks are 12% below the five-year average, and the IEA sees the gasoil balance "tight well into 2027".
Gold is the surprise of 2026, because it is not at a record. On October 16 it was $4,166, roughly 25% below the late-January peak ($5,405 at the London fix) and 2% below a year ago. It fell as the Fed pivoted to hikes and real rates rose; central banks (289 tonnes in the second quarter) provide the floor. The gold-to-oil ratio collapsed from 70 barrels per ounce in January to 38. The market is pricing an inflation regime driven by energy and rate hikes, not the debasement regime that drove 2025. Silver is $57 against a January record of $121.6. Among industrial metals, copper is around $14,500-14,600 per tonne, +17% year to date, with a record $14,875 on September 10 on data-center and grid demand, a deficit of 150-600 thousand tonnes and expected tariffs that have pulled more than 700 thousand tonnes into US warehouses. Aluminium at a year low near $3,000 on Gulf smelter restarts, iron ore at $91, -14% on the year, and the Baltic Dry Index -14% in a week reflect weak Chinese construction demand. US gas is $3.1-3.2 per million BTU against $25-30 in Europe and Asia with Qatari LNG at half capacity, the widest structural gap in commodities and an advantage for US industry over European. Agriculture is the 2027 risk: the FAO food price index was 136.0 in September, the highest since November 2022, wheat +31% on the year, while US food CPI is only +1.8%, because the path from field to shelf takes several quarters. The ratio of the GSCI commodity index to the S&P 500, even after the rally, remains near its lows of the past 50-plus years, the configuration from which the commodity supercycles of the 1970s and 2000s began.
History: the closest match is 1999-2000 together with 1973, and in every episode the leaders broke before the index
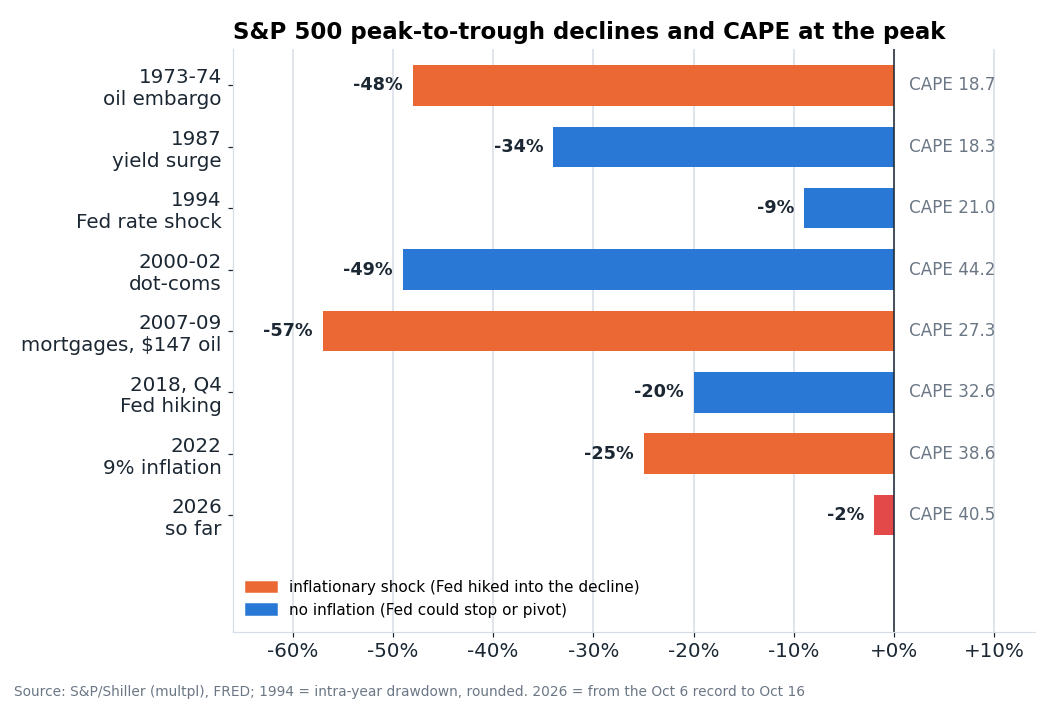
No single episode reproduces October 2026 in full, but each component has a precedent.
- 1973-1974, the oil embargo. Index CAPE just 18.7, but the "Nifty Fifty" traded at about 42 times earnings. Oil tripled, inflation went from 3.6% to 12.3%, the Fed funds rate from 5.9% to 12.9%. S&P 500 -48% over 630 days, the recovery took 7.5 years, the "Nifty Fifty" -62%. Gold +67% and +73% over two years.
- 1987, rising yields. The 10-year yield went from 7% to 10.2% in nine months at a CAPE of 18, a 34% crash with a one-day -22.6%. Inflation stayed low, the Fed eased, the high was regained in under two years.
- 1994, the rate shock. The Fed raised rates from 3% to 6%, the 10-year yield rose 286 bp, but inflation held at 2.7%, CAPE was 21, and there was no oil shock. Stocks finished the year near flat and gained 37% in 1995.
- 2000-2002, the dot-coms. CAPE 44.2, the Fed +175 bp to 6.5%, oil tripled from $11 to $34, inflation from 1.7% to 3.8%, the advance-decline line peaked two years before the index. The Nasdaq lost 35% within five weeks of its March 2000 peak while the S&P held within 10% of its high until September. Outcome: S&P -49%, Nasdaq -78%; value and commodities won.
- 2007-2009. CAPE 27, financials broke 4-8 months before the index, oil reached $147 in July 2008 already inside the bear market, S&P -57%.
- 2018, fourth quarter. CAPE 32.6, the 10-year at 3.24%, the Fed hiking, a 20% decline, software and cloud lost more than 20%. Inflation was falling, though, and in January 2019 the Fed pivoted; the decline was bought back within a quarter.
- 2022. CAPE 38.6, inflation 9.1%, the 10-year from 1.5% to 4.25%. The cloud index peaked on November 9, 2021, eight weeks before the S&P 500, and fell 58.6%; S&P -25%, Nasdaq -36%, long Treasuries -17.8%, energy +60%.
Three lessons matter more than the rest. First: the starting valuation determines the depth, but not the timing. The market has left the zone of CAPE above 38 twice, in 2000 and 2021, both times with a 25-50% decline within one to three years, and by Cliff Asness's calculations the top CAPE decile (25-46) delivered about +0.5% real a year over the following ten years. Second: the type of shock decides what protects. In 1994 and 2018 inflation was flat or falling, the Fed could stop or pivot, and stocks recovered fully. In 1973 and 2022 the shock was inflationary, the Fed hiked into the decline, long bonds did not protect, and only energy, commodities and, in 1973-1974, gold worked. Two of the three reasons 1994 passed quietly (flat inflation, CAPE 21, no energy shock) are absent today, and the pivot that saved 2018 is unavailable with oil at $110 and CPI rising. Third: a top is a process in which the old leadership breaks first. The window between the leaders and the index is weeks to two quarters. Goldman's quantitative rules are tripping too: after a two-standard-deviation one-month rise in the 10-year yield (about 50 bp; September was +45 bp) stocks "have struggled to move higher", especially when inflation or the budget drives the move, and the bank once put the threshold for a "clear problem" at around 5%. The breadth signal has already fired: in May 2026 the S&P set a record with 5% of its members at 52-week lows, which previously happened only in July 1929, January 1973 and December 1999.
How 2026 differs from 2000: the leaders are profitable (TSMC, Nvidia, hyperscaler margins at records), and the forward P/E of the "AI class of 2026" is about 39 against a median of 152 for the dot-com darlings. From 1973: US oil intensity of GDP is 58% lower, and core inflation is 2.6%, not 8%. These differences argue for a milder outcome than either analogue on its own. The combination of both shocks at once argues against complacency.
The week of October 12-16: the AI trade was scared by the cost of money, not by demand
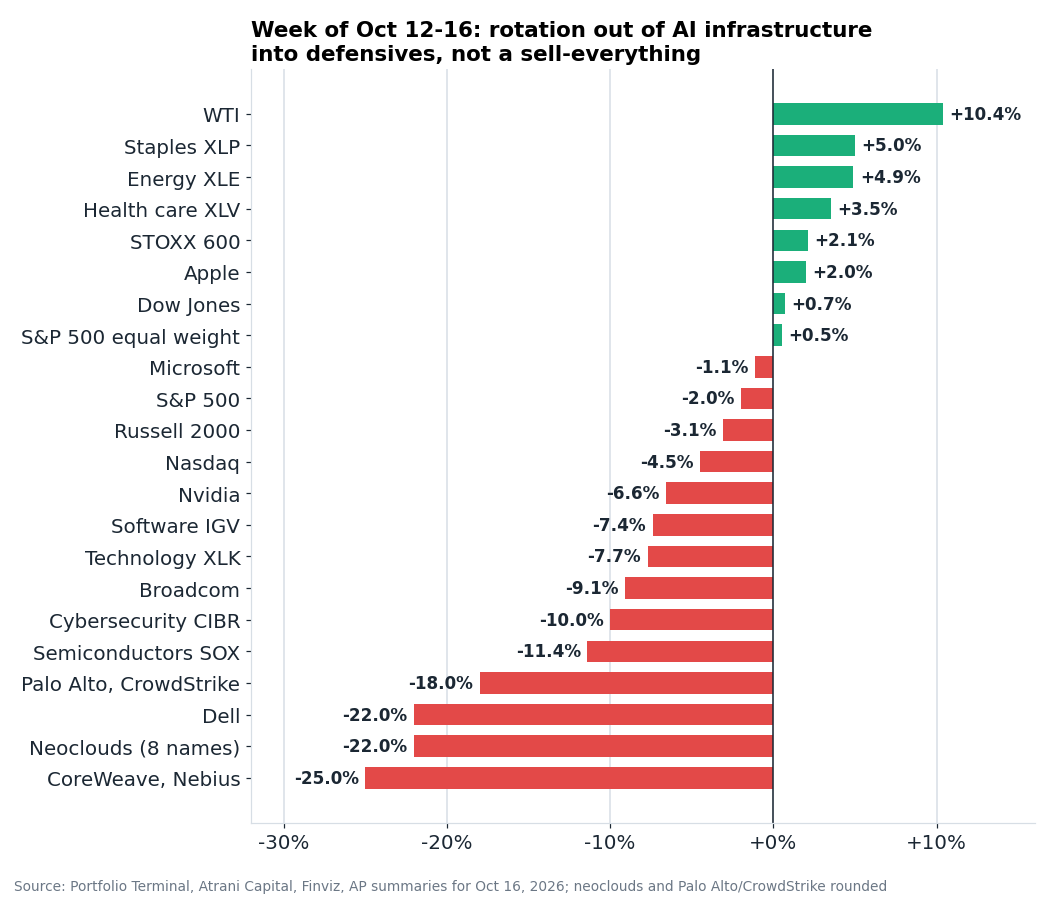
The damage was concentrated, sequenced and credit-led. On Monday, October 12, Broadcom CEO Hock Tan compared many AI investors to casino gamblers and called the shortage of capital "maybe the biggest constraint" on the industry, while a report from China's CXMT of a breakthrough in memory hit DRAM makers; Korea's KOSPI fell 5.5% on Tuesday. On Wednesday, October 14, three things converged: the hot CPI, a Gartner press release estimating that more than $3.5 trillion of AI infrastructure spending "could be exposed to impairment" by 2030 and that more than 80% of "neoclouds" (lessors of AI computing capacity) will cease to exist independently, and a chart of CoreWeave's 2032 bonds yielding above 15% that went viral (Gartner). CoreWeave -15.5%, Nebius -10%, Oracle -8.8%, Dell -11.3%. Thursday brought the PPI and a trading halt in Korea at -8.1% (Samsung -9.5%, SK Hynix -11.4%) on the same day TSMC reported a record quarter. Friday, October 16, was the contagion day: enterprise software, which had rallied on Monday after BofA's double upgrade of Salesforce, reversed intraday with no earnings and no downgrades. The IGV software ETF fell 4.8%, its worst day since April, a basket of 45 software names lost more than $260 billion of market value, Palantir -7.2%, ServiceNow -4.4%, the CIBR cybersecurity ETF closed the week -10%, its worst since March 2020, Palo Alto and CrowdStrike -18% each for the week.
For the week the semiconductor index fell 11.4%, eight losing sessions in a row for the first time since 2008 and about 24% below its June peak. Eight "neoclouds" averaged -22%, Dell -22%, the technology sector -7.7%, Nvidia -6.6%, Broadcom -9.1%. Meanwhile Microsoft was -1.1%, Meta -1.3%, Apple +2%. The damage to the index was modest: S&P 500 7,659, -1.95% for the week and about 2% below the October 6 record of 7,819; Nasdaq -4.5%, its worst week since June; Dow +0.7%, equal-weight S&P +0.5%, consumer staples +5.0%, energy +4.9%, health care +3.5%, and 73% of index members were up through Thursday. The behavior of other assets confirms a rotation, not a liquidation: the 10-year yield fell 15 bp over the week to 5.10% through the hottest CPI and PPI prints in years, the dollar -0.4%, gold flat, the VIX at 19.99 after 22.3 intraday, STOXX 600 +2.1%. The only "risk" asset that rose was oil: WTI +10.4% for the week.
Positioning explains the violence. According to Goldman's prime brokerage, hedge funds sold global AI stocks for six straight sessions at the second-fastest pace in a year, with long sales outpacing short covers 3.5 to one, which erased all net buying since the start of 2025. Fundamental long/short funds lost money every day of the week. Slow money did the opposite: by EPFR's count, $39.1 billion flowed into US equity funds in the week to October 14 (a record $636 billion year to date), and retail put a record $3.9 billion into the triple-leveraged semiconductor ETF SOXL in four days.
The signal matters more than the event. The trigger was financing arithmetic, not demand data: in the week when semiconductors fell eight days running, TSMC posted record revenue, global chip sales ran +144% y/y, and Korean chip exports set a record. The market is asking who pays for a buildout that, by Bain's calculation, needs an AI market of "approaching $6 trillion annually" by 2031 to pay off, of which "about $4.2 trillion" of revenue has yet to be invented, and it is asking at a moment when the marginal borrower (CoreWeave, Oracle at BBB-, data centers on private credit) borrows at 15% against a 5% risk-free rate (Bain). That is why the hot CPI mattered: "higher for longer" raises both the hurdle rate on debt-funded capex and the discount rate on long-duration software. A sequence in which mega-caps lose 1% while the levered second tier loses 15-25%, spreads on the weakest AI borrowers blow out, and hedge funds sell to retail is the classic "narrowing, then cracking" of 2000 and 2021. The cap-weighted index barely registered it because the top seven held. History says that is what the weeks and quarters after the leaders break look like, not proof that the index is immune. The "AI eats SaaS" thesis also circulated on Friday, but its evidence is weaker than the financing thesis: no strategist with numbers formulated it, and Bain's own report argues that "agentic AI's big opportunity isn't replacing software as a service" but converting labor spend into software spend.
Opinions: bears and bulls agree on four things and argue about one
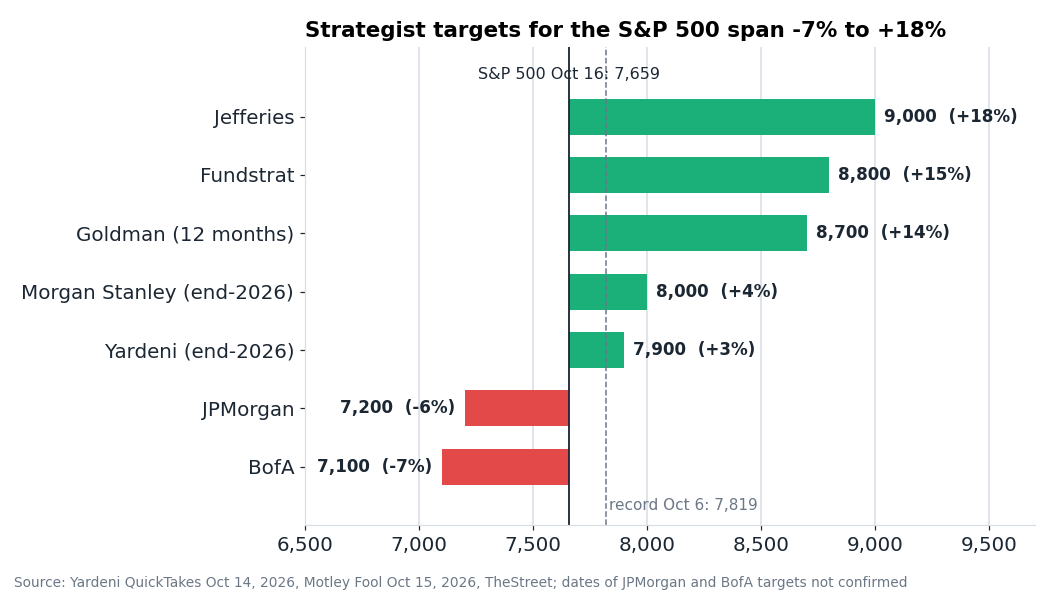
The map of opinions is wider than usual, and the two camps share more facts than they admit. On the bear side, Hussman puts the downside at "on the order of 50-75%". GMO's third-quarter letter argues the catalyst "may come from equity supply rather than disappointing AI demand": supply growth of about 5% means "perhaps a 20% hit relative to normal over the next year and a half", because the 2000 bubble also rolled over on a flood of issuance before fundamentals disappointed (GMO). Goldman independently expects about $600 billion of issuance and $1.7 trillion of lockup expiries in 2027, "potentially the largest increase in public U.S. equity supply since 2000". Paul Tudor Jones says the market looks very much like 1999, that "2027 is going to be really, really challenging", but that a strong fourth quarter after the midterms is possible. Gundlach called the September hike "too little, too late" and says the market "does not trust" AI bond ratings: "It's not an analysis, it's a price list". BofA's Hartnett has moved from "sell" to "defensive, not yet buy", wants a hike on October 28 "to restore credibility" and calls CoreWeave the AI trade's "Darwin moment". Jamie Dimon's quarterly release listed "large fiscal deficits, sticky inflation, elevated asset prices, rising interest rates and geopolitical conditions". Notably, not one bear with a verifiable September-October statement names a date for the crash; the common timing hint is "after the midterms, into 2027".
The bull camp stands on earnings and political economy. Ed Yardeni, one of the most accurate bulls of 2023-2025, cut his year-end target to 7,900 and moved 8,400 to mid-2027, lowering his assumed P/E from 19.8 to 18.6 ("our concern isn't earnings; it's stock valuations"), yet argues that "AI is too big to fail", that the discipline of the "bond vigilantes" lets the bubble "deflate without bursting", and that consensus earnings of $366 in 2026, $424 in 2027 and $493 in 2028 could justify 10,000 by end-2027 (Yardeni). Investment bank targets remain above the market: Goldman 8,700 on 12 months, Jefferies 9,000, Fundstrat 8,800, Morgan Stanley 8,000 for year end, against JPMorgan at 7,200 and BofA at 7,100. The industry bulls (Huang: "CoreWeave's strength is improving every day"; CoreWeave itself: a $104 billion backlog "more than covers the debt"; Musk: "no crying in the casino") add conviction but not data. The bulls' best arguments come from official bodies: Fed staff note that equity gains were "supported by robust corporate earnings", the IMF writes that "core firms in the AI ecosystem have been profitable so far", and the Bank for International Settlements calls hyperscaler valuations "more moderate, at least by historical standards".
The Fed and the international institutions are hawkish in direction and worried about the same thing as the credit bears. At the September press conference Warsh said he "would be hard pressed to describe broad financial conditions as restrictive", that the Fed "removed a dose of accommodation", and that he does not "need to do harm to the labor markets", naming the hyperscalers' "surge in capital expenditures" among the drivers of long yields. Even Claudia Sahm, the profession's reference dove, moved "from hold to hike" in September because "the logic of looking through energy prices or tariffs should not extend to memory chip shortages". The IMF's October financial stability report ranks an AI correction "exacerbated by rising leverage, concentrated exposures, and circular financing arrangements" as risk number one and a disorderly rise in sovereign yields as number two (IMF GFSR). Fund managers in the BofA survey rank the same two risks in reverse order: a "disorderly rise in bond yields" 31%, an "AI bubble" 23%, 11% name a hyperscaler credit event, and 45% expect an AI bubble in 2027.
Four points of agreement. Policy is at best mildly restrictive, and one more hike is coming (the Fed majority, Sahm, markets at 75%). Reported 2026 earnings growth is roughly half accounting (Yardeni and Hussman agree). The near-term AI risk is financing and leverage, not demand (the IMF, BIS, Gundlach, Hartnett, Yardeni and GMO, in different words). The oil shock lasts into 2027, and the pressure point is diesel (the IEA, Waller, Sahm). The real disagreements: whether the $4.2-4.9 trillion AI revenue gap by 2030-2031 is closed by new applications (Bain, Yardeni, Huang) or by write-downs (Gartner, Hussman, Grantham); whether valuation matters now (Hussman and GMO: 20-75% downside) or is "ordinary" on forward earnings (targets of 8,000-9,000); whether the trigger is equity supply (GMO, Tudor Jones) or a rates shock (the fund-manager survey). The bears' strongest evidence is market prices (AI bond spreads, CoreWeave's bonds, households' record equity share). The bulls' strongest evidence is realized profits and backlogs. "Too big to fail", "casino" and the "1997 or 1999" debate are narratives.
Weighing it: the de-rating has begun, three scenarios and a calendar
The objective reading of the data: the US equity market entered a de-rating in early October, triggered by the rates and financing channel, and whether it grows into a bear market of the 1973 or 2000 type depends on two observable variables, the oil price path and the behavior of AI credit, not on the debate about AI demand that fills the headlines. The case that this is more than a two-week scare rests on five facts pointing the same way. The starting valuation is in the top percentile of history on every trailing measure. The equity risk premium against a 5% Treasury is negative on trailing earnings for the first time since 2002. The Fed is hiking into a supply shock with household inflation expectations rising, which removes the pivot that saved 2018. Positioning is at records, and hedge funds have already lightened up while households have not. Leadership broke in exactly the sequence (the levered second tier, then software, mega-caps last) that preceded the 2000 and 2022 tops. The arguments against a deep bear market are also real: core inflation is 2.6%, no recession rule has tripped, bank credit is loose, the leaders are profitable, and every oil forecaster's base case has lower prices by mid-2027. A strong fourth-quarter rally after the November 3 elections, which both Tudor Jones and Hartnett allow, is fully consistent with a large top forming, as it was in late 1999 and late 2021.
The scenarios below are our assessment; the probabilities are judgment, not calculation.
- A grinding de-rating, about 45%. The Fed raises to 4.00-4.25% in December and holds, Brent $95-110 into mid-2027, CPI 3.5-4% into the first quarter and then cooling, growth 1.5-2% with unemployment at 4.4-4.5%. The 10-year yield 4.75-5.25%, the S&P 500 in a 6,800-7,800 range with a 10-20% drawdown from the record led by semiconductors, neoclouds and software, the forward multiple compressing toward 17-18 as 2027 earnings are revised from $424 toward $390-400. Energy, consumer staples, health care, the equal-weight index and quality value outperform. Template: 2018 for depth, 2000 for sequence.
- A 1973/2000 hybrid, about 30%. Escalation around Hormuz after the elections or a strike on Saudi infrastructure takes Brent above $120, CPI above 4%, the Fed hikes in December and March to 4.50%, an AI credit event (CoreWeave has $4.4 billion due by end-2026, Oracle's funding) forces capex cuts, 2027 equity supply of $600 billion plus $1.7 trillion of lockups finds no buyer, the consumer breaks on falling real wages and a reversal of the wealth effect. The 10-year yield goes above 5.5% before growth fears pull it down. S&P 500 -25-35% to 5,100-5,900 over 12-18 months, Nasdaq and semiconductors -40-60%, high-yield spreads above 5%. Treasuries do not protect until the shock turns deflationary; gold and energy work early, then everything falls. Template: 1973-1974 for the macro, 2000-2002 for the leadership, 2022 for the failure of the 60/40 portfolio.
- A 1994/1997 soft landing, about 25%. A political settlement reopens Hormuz by the first quarter of 2027, Brent falls to $75-85, CPI below 3% by mid-2027, the Fed finishes at 4.00-4.25% and cuts by end-2027, 2027 earnings of $415-425 are broadly delivered. The 10-year yield 4.25-4.6%, the S&P 500 reaches 8,300-8,700 within 12 months on a forward multiple of 19-20, the AI second tier recovers, leadership broadens to small caps, cyclicals and foreign markets.
The portfolio conclusions follow from the type of shock, not from the index forecast. While inflation is rising and the Fed is hiking, what has historically worked is energy and commodities (steep backwardation gives the BCOM index 5% from the roll), defensive stocks with pricing power, gold as a floor rather than as momentum, and short-to-intermediate Treasuries. Long duration becomes a hedge only when the shock turns deflationary; in 2000 and 2008 that took 6-12 months from the equity peak. Within equities the asymmetry is in the AI second tier, where debt-funded operators and long-duration software carry both the financing risk and the multiple risk, while the profitable leaders (TSMC, Nvidia, the hyperscalers except Oracle) were the last to fall in every analogue and the first to recover. The equal-weight index has already caught up with the cap-weighted one year to date (11.7% against 11.9%) and is the natural expression of a market where the median stock is 16% below its high.
The next six weeks will remove most of the uncertainty. October 20: housing starts, Netflix and GM results. October 21: Tesla and Meta, the first read on 2027 capex. October 22: the leading economic index, P&G with its $1 billion of costs. October 23: flash PMIs and the final Michigan survey. October 27: September durable goods orders. October 27-28: the Fed meeting, where a hold is priced and the event is the wording about December. October 29: September PCE, the first estimate of third-quarter GDP, the ECB. October 30: LyondellBasell, the first chemicals read on energy, and in the same window Microsoft, Alphabet and Amazon. November 1: OPEC+. November 3: the midterm elections, after which both Yardeni and our sources expect Middle East risk to rise. November 6: payrolls; November 10: CPI; November 13: PPI; December 8-9: the Fed meeting with the second hike priced; December 11: expiry of the stopgap budget. Alongside the calendar, five market gauges. The 10-year yield against its 5.35% high and the 2-year against 4.88%: a break on a hot CPI brings back the rates channel. CoreWeave's CDS and the AI investment-grade spread: refinancing $10.6 billion through 2027 at tolerable rates would defuse the credit thesis, a failure would confirm it. The high-yield spread: a move from 3.23% through 4% would mark the transition from isolated to systemic stress. EPFR flows for the week to October 21 will show whether Friday's software break turned record retail inflows into outflows. Michigan 5-10-year expectations at 3.5%: the single number most likely to make the Fed hike twice rather than once.
The most useful reframing of October 2026: the AI debate and the macro debate have merged into one variable, the cost of capital. Bears and bulls already agree that reported earnings are flattered, that the oil shock lasts into 2027, and that AI's near-term vulnerability is financing, not demand. What they argue about is whether a 5% risk-free rate and 15% neocloud yields are a healthy discipline that lets the bubble deflate or the mechanism that bursts it. History leans toward the second reading when the central bank is hiking into the shock, because the pivot that turns a correction into a V (1987, 2018) is unavailable while inflation is rising. That is why the outcome around Hormuz, which no market participant can predict, has become the swing factor for the entire US equity market: it decides whether the Fed gets to stop at 4.25%. An investor who accepts the base case should expect a long, uneven de-rating rather than a crash, prepare for the 2027 test of equity supply and refinancing rather than for the next earnings beat, and treat any post-election rally in the leaders as a chance to reduce concentration, not as confirmation that October's warning was noise.
See also: market overview · valuation map · stock screeners