Visa: profit up 18%, but revenue growth slowed to 8.5% — the network holds margin, not pace

On October 27, Visa reported results for the fourth quarter of fiscal 2026. Revenue was $12,139 million, operating profit $7,262 million, and net income $6,002 million. Year-on-year revenue growth slowed to 8.5% from 11.4% a quarter earlier, while net income rose 18% on lower one-off charges. The share looks rather attractive: the network keeps an exceptional margin and returns capital generously, though the revenue pace and one-off items warrant caution.
Key takeaways
— Net income rose 18% largely because one-off charges fell from $899 million to $469 million
— Operating margin holds at 59.8% — the network earns on transaction volume, not on price
— Client incentives rose 21% and eat into revenue, but that is the price of retaining issuers
— The company returned $5.2 billion to shareholders in the quarter and raised the dividend 16%
— Debt rose from $8,007 million to $11,499 million over nine months, yet interest expense fell
— The valuation remains high against its own history, and that is the main argument against
Attractiveness
Key figures, USD bn
| Metric | Q4 2025 | Q3 2026 | Change |
|---|---|---|---|
| Revenue | 10.9 | 12.1 | +11.4% |
| EBITDA | 7.06 | — | — |
| Operating profit | 6.74 | 7.26 | +7.8% |
| Net profit | 5.85 | 6.00 | +2.5% |
| Operating cash flow | 6.78 | — | — |
| Capex | 0.38 | — | — |
| EBITDA margin | 64.8% | — | — |
| Net margin | 53.7% | 49.4% | -4.3 pp |
Revenue for the quarter ended September 30, 2026, was $12,139 million, up 8.5% year on year. A quarter earlier growth was 11.4%, so the pace decelerated. The drivers show it too: payments volume rose 9% in constant dollars, processed transactions 10%, cross-border volume 14%.
Service revenue rose 14% to $5,255 million, data processing revenue 16% to $6,245 million, international transactions 8% to $4,115 million. Other revenue grew 40% to $1,647 million, but its contribution to overall growth is limited. Client incentives increased 21% to $5,123 million and are deducted from revenue, so their faster growth holds back the headline figure.
The slowdown to 8.5% is still double-digit growth in constant dollars, but the market is used to higher rates. In the next report it matters whether growth returns to 11% or 8.5% becomes the new norm.
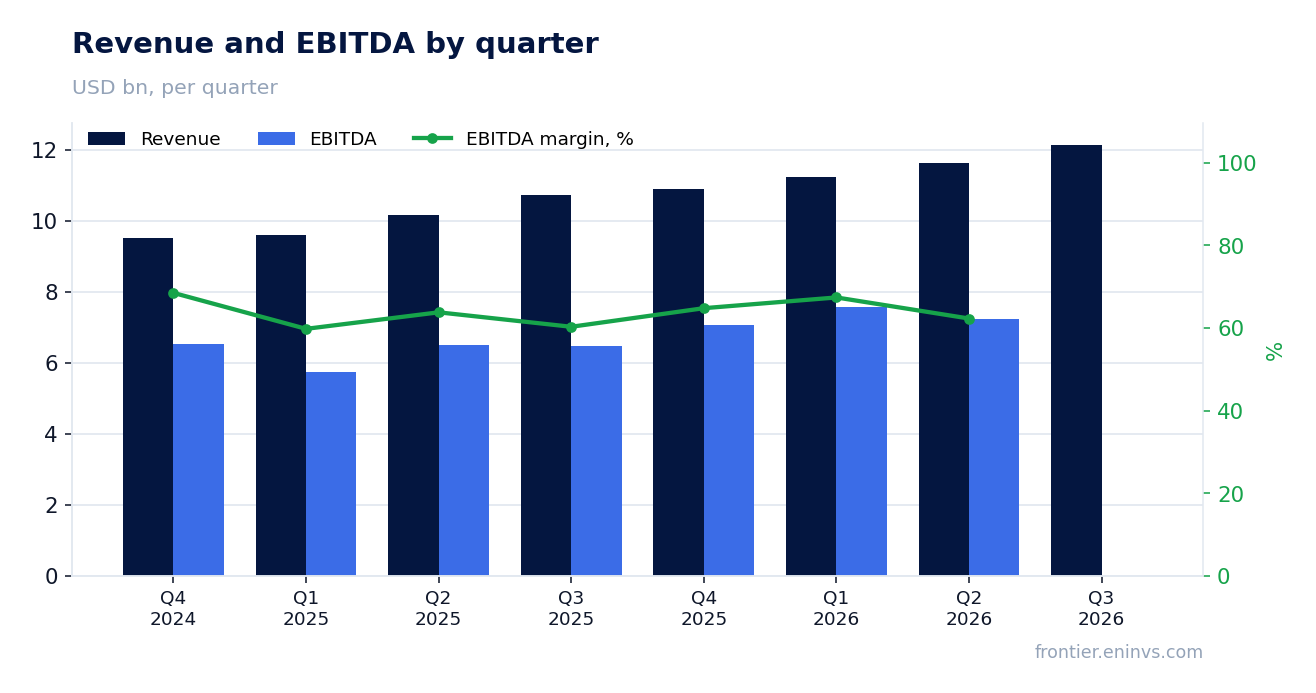
Net income rose 18% largely because one-off charges fell from $899 million to $469 million
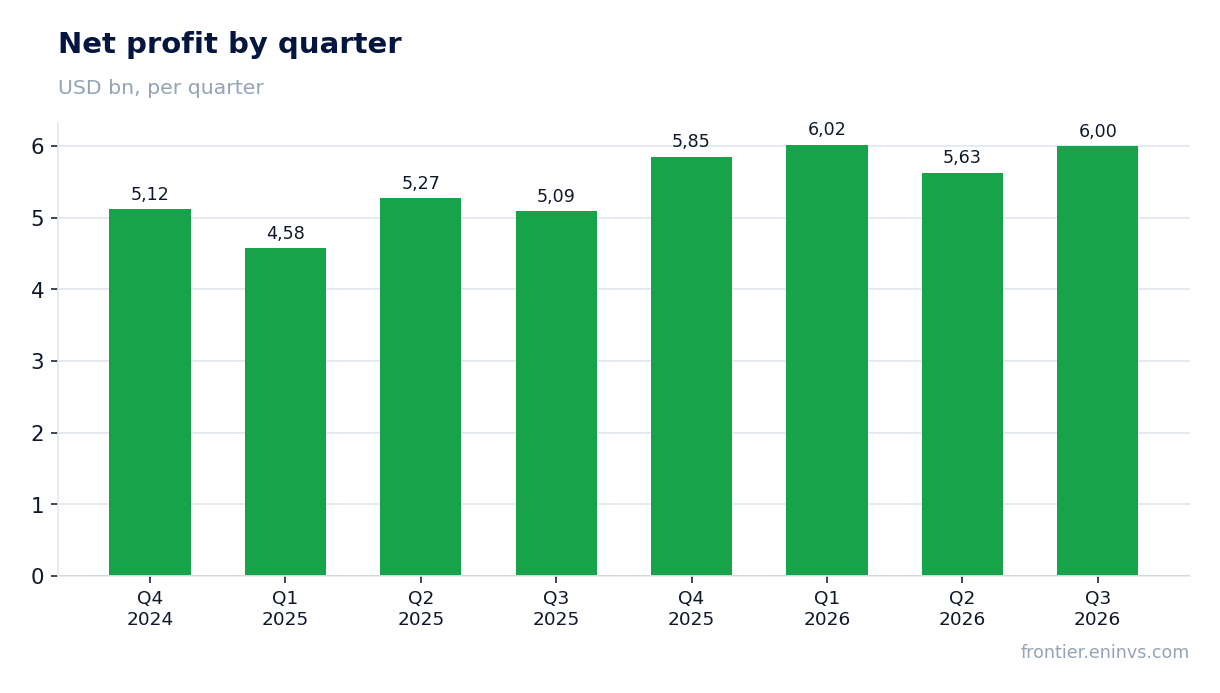
Net income was $6,002 million versus $5,090 million a year earlier, up 18%. A significant part of that growth, however, comes from lower one-off items: the litigation provision for the MDL case fell from $899 million to $469 million. The prior year also included amortisation and acquisition costs.
Non-GAAP net income rose 13% to $6,552 million, and non-GAAP EPS rose 17% to $3.48. The gap between GAAP and non-GAAP this quarter also includes a $282 million donation of investments to the Visa Foundation and a $37 million tax effect.
So the 18% profit growth is not purely operational — it also reflects the comparison base. Without the lower one-off charges, profit growth would have been more modest.
Operating margin holds at 59.8% — the network earns on transaction volume, not on price
Operating profit was $7,262 million on revenue of $12,139 million, a margin of 59.8%. A year earlier operating profit was $6,148 million on revenue of $10,724 million, a 57.3% margin. The 2.5 percentage point gain is driven primarily by the lower litigation provision.
Operating expenses rose 7% to $4,877 million while revenue rose 13%. The restraint came from the litigation line, but general and administrative expenses jumped 52% to $829 million, partly due to the foundation donation. Excluding one-off items, expenses would have risen 12%.
A margin near 60% is a sign of the network effect: each additional dollar of revenue brings almost 60 cents of operating profit. As long as transaction volumes grow, the margin should stay high.
Client incentives rose 21% and eat into revenue, but that is the price of retaining issuers
Client incentives — rebates and payments to issuers and partners — were $5,123 million, up 21% year on year. They are deducted from gross revenue, so their faster growth directly holds back net revenue. For the full year incentives reached $18,317 million, or about 40% of gross revenue.
Incentives growing 21% while revenue grows 13% means the company is paying more and more to retain and attract clients. This is a competitive environment: banks and payment systems demand ever-better terms. As long as Visa keeps market share, such spending is justified, but further growth could cap the margin.
In the next report, watch the ratio of incentive growth to revenue growth. If incentives keep outpacing revenue, margin pressure will build.
The company returned $5.2 billion to shareholders in the quarter and raised the dividend 16%
In the quarter Visa spent $5.2 billion on buybacks and dividends. Buybacks were $4.0 billion (about 11 million shares at an average of $369.12), dividends $1.2 billion. For the full year capital returned reached $25.6 billion.
The board raised the quarterly dividend 16% to $0.780 per share. At the current price that gives a yield of about 0.8%. The dividend remains modest compared with buybacks, which are the main way of returning capital.
Free cash flow for the year was $23,728 million of operating cash flow minus $1,671 million of capex, or about $22 billion. That comfortably covers dividends and buybacks. The capital return policy remains generous and sustainable.
Debt rose from $8,007 million to $11,499 million over nine months, yet interest expense fell
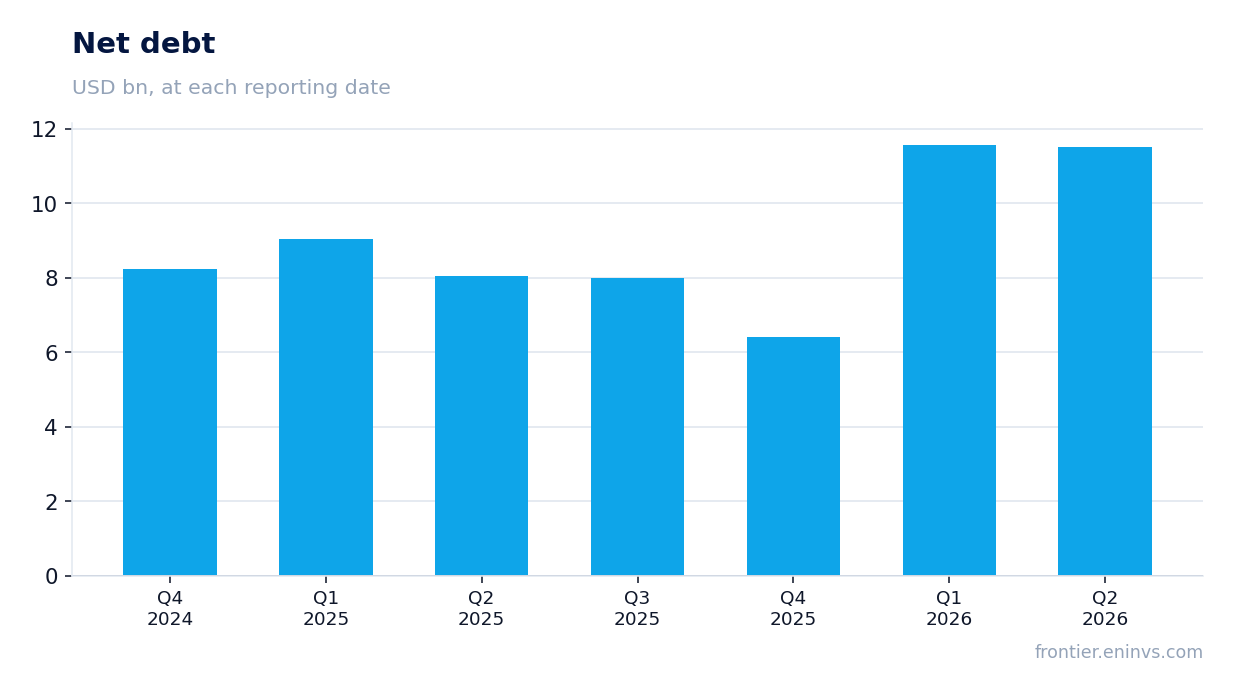
Net debt at the end of June 2026 was $11,499 million versus $8,007 million at the end of September 2025. The increase reflects $2,995 million of new notes issued, $5,565 million of repayments, and share buybacks. Yet quarterly interest expense fell to $192 million from $210 million a year earlier.
Leverage remains low: net debt is about 0.2 times annual EBITDA. The company has a significant cushion. Its rating remains high and borrowing costs low.
In the next report it matters whether the company keeps raising debt for buybacks. For now it creates no risks, but if revenue growth slows it could limit flexibility.
The valuation remains high against its own history, and that is the main argument against
At a share price near $370 and EPS of $12.32 over the last twelve months, the P/E is about 30. That is above the three-year average range of 25–28. The current valuation assumes high growth and margin persist.
The free cash flow yield is about 3.5%, below the yield on 10-year US Treasuries. Investors pay a premium for stability and business quality. But if revenue growth slows to 8.5%, that premium could come under pressure.
To sustain the current valuation, the company needs to return revenue growth to double digits or show profit acceleration through buybacks. Otherwise the multiple could compress.
Bottom line
The report's strength remains an exceptional margin — 59.8% operating and 49.4% net — and generous capital returns: $5.2 billion in the quarter and a 16% dividend increase. However, 18% profit growth is partly due to lower one-off charges, while revenue slowed to 8.5%. The key question for a holder is whether a valuation near 30 times earnings can hold as growth decelerates. Verdict: rather attractive, with a caveat on the growth slowdown.
Open the company's financial profile V →
See also: market overview · valuation map · stock screeners