VICI Properties: revenue grows for a sixth straight quarter while net income halves on a credit-loss allowance
On 28 October VICI Properties reported third-quarter 2026 results: revenue rose 5.8% year over year to $1,065.5 million, AFFO rose 7.5% to $685.2 million, while net income fell 55.0% to $342.5 million. The profit decline is entirely explained by a non-cash credit-loss allowance charge of $458.0 million versus a $20.2 million reversal a year earlier. The share looks rather attractive: cash flow and the dividend are growing and the payout history supports the yield, though $16.6 billion of net debt and the absence of quarterly EBITDA figures limit the assessment.
Key takeaways
— Revenue added 5.8% and has grown for six straight quarters, but the pace was roughly the same as the 5.7% a quarter earlier
— Net income fell 55.0% because of a $458.0 million non-cash allowance, not because of operations
— AFFO rose 7.5% to $685.2 million, and it is AFFO, not net income, that funds the dividend
— The dividend was raised for a ninth consecutive year to $0.46 a quarter, up 2.2% year over year
— Net debt of $16.6 billion was almost unchanged over the quarter, and the 5.42% refinancing rate is below the coupons of the redeemed notes
— Full-year 2026 AFFO guidance was raised to $2,695–2,705 million, or $2.47–2.48 per share
— A $2.0 billion buyback was authorised after the reporting date and supports the valuation
Attractiveness
Key figures, USD bn
| Metric | Q3 2025 | Q3 2026 | Change |
|---|---|---|---|
| Revenue | 1.01 | 1.07 | +5.8% |
| EBITDA | 0.98 | — | — |
| Operating profit | 0.98 | — | — |
| Net profit | 0.76 | 0.34 | -55.0% |
| Operating cash flow | 0.59 | 0.66 | +11.8% |
| Capex | 0.00 | — | — |
| EBITDA margin | 97.8% | — | — |
| Net margin | 75.6% | 32.1% | -43.5 pp |
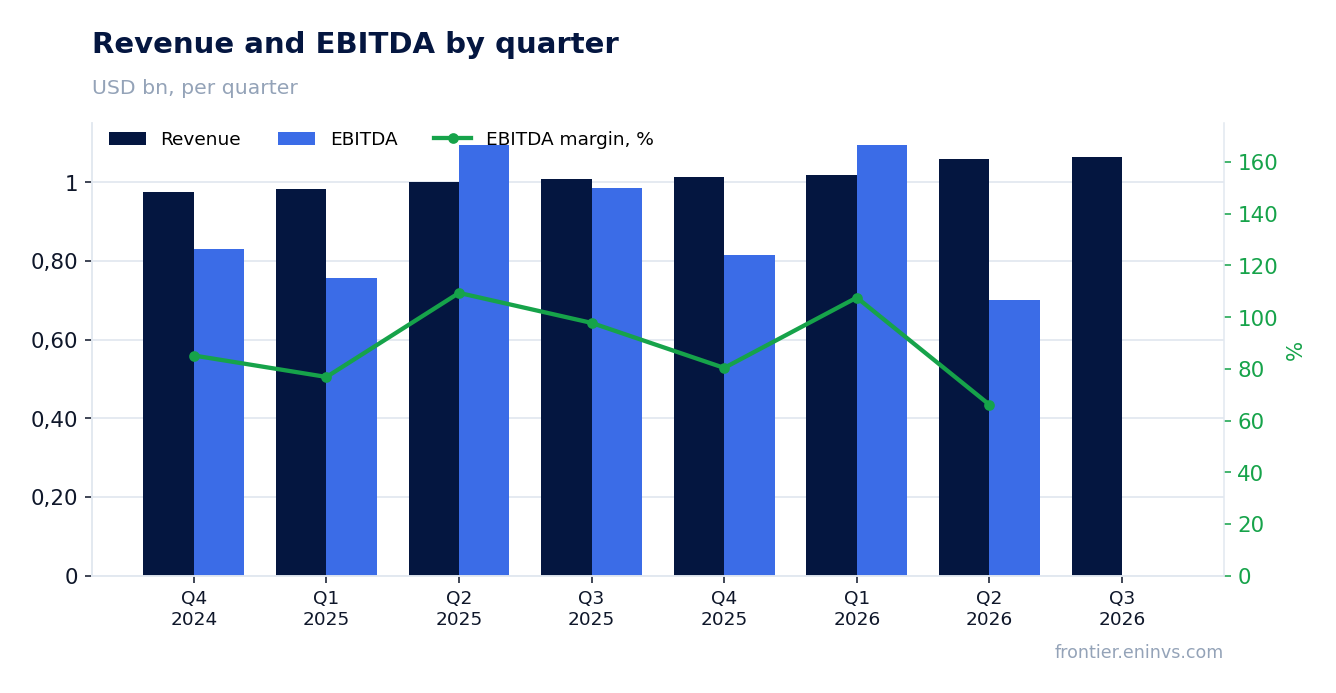
Revenue added 5.8% and has grown for six straight quarters, but the pace was roughly the same as the 5.7% a quarter earlier
Third-quarter 2026 revenue was $1,065.5 million versus $1,007.5 million a year earlier, up 5.8%. This is the sixth consecutive quarter of growth: 4.6% in Q2 2025, 4.4% in Q3, 3.8% in Q4, 3.5% in Q1 2026, 5.7% in Q2 and 5.8% in Q3. The pace was roughly the same as in the second quarter.
Within revenue, income from sales-type leases rose to $556.7 million from $531.8 million, and income from financing receivables, loans and securities to $482.6 million from $448.0 million. New leases contributed visibly: Clairvest Northfield Park brought $13.5 million, Golden Entertainment $21.8 million and PURE $2.9 million, none of which existed a year earlier.
Caesars Regional and Caesars Las Vegas receipts grew more modestly, to $140.5 million and $126.4 million respectively, and MGM Grand/Mandalay Bay to $82.2 million. Growth is coming from new partners rather than indexation of old contracts, which matters for the durability of the pace.
Net income fell 55.0% because of a $458.0 million non-cash allowance, not because of operations
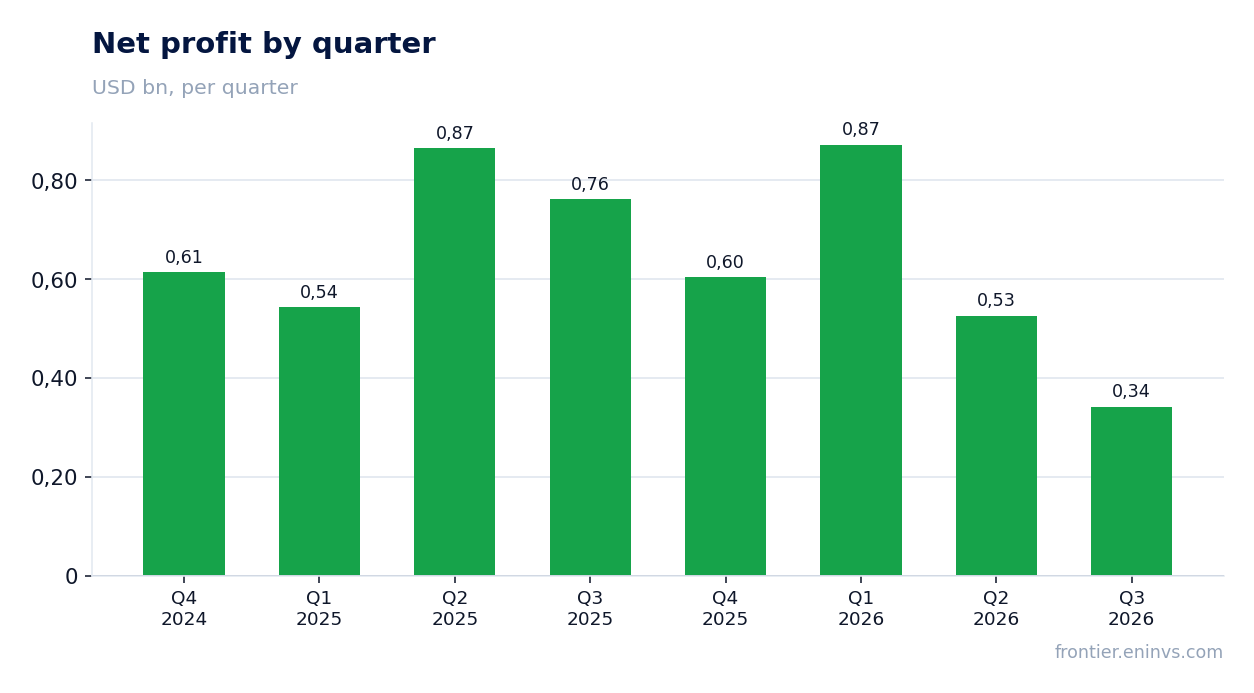
Net income attributable to common stockholders was $342.5 million versus $762.0 million a year earlier, down 55.0%. Per share it was $0.31 against $0.71. The report names the cause directly: the change in the CECL credit-loss allowance produced a $458.0 million charge versus a $20.2 million reversal a year earlier, an aggregate effect of $478.2 million.
The allowance is non-cash and unrelated to rental receipts: operating profit before the allowance rose. The net margin fell to 32.1% from 75.6%, but that is the consequence of an accounting charge, not of a deterioration in the business.
For a holder what matters more is that the allowance reflects the assessed credit quality of tenants and loans, not the current cash flow. The company itself gives no net income guidance, citing the impossibility of predicting the allowance.
AFFO rose 7.5% to $685.2 million, and it is AFFO, not net income, that funds the dividend
Adjusted funds from operations (AFFO) were $685.2 million versus $637.6 million a year earlier, up 7.5%. Per share it was $0.62 against $0.60, up 4.3%. The gap between the rates reflects a larger share count: the weighted average rose to 1,100.6 million from 1,068.4 million, including 24.3 million shares issued in the Golden Entertainment transaction.
AFFO strips out the non-cash allowance, so it shows the real capacity to pay the dividend. Operating cash flow was $655.2 million for the quarter and $2,579.0 million over the last twelve months. Capital expenditure is minimal: $2.7 million for the quarter, since the business is a landlord and requires no construction.
Adjusted EBITDA as calculated by the company was $879.8 million versus $825.6 million, up 6.6%. It is the only quarterly operating-profit measure in the report, and it confirms the business is growing despite the fall in net income.
The dividend was raised for a ninth consecutive year to $0.46 a quarter, up 2.2% year over year
On 3 September 2026 the company declared a quarterly dividend of $0.46 per share, its ninth consecutive annual increase since the IPO. The year-over-year increase is 2.2%. The payment was made on 8 October, totalling about $506.3 million.
With full-year AFFO under the raised guidance of $2.47–2.48 per share and annual payments of about $1.84, the payout ratio is roughly 74%. That is our estimate from the company's guidance and the declared rate, and it leaves room should the allowance rise or rental receipts slow.
We do not quote the yield on the current price: the share price is not in the facts. But dividend growth of 2.2% against AFFO-per-share growth of 4.3% means the company is raising the payout more slowly than the flow and building a cushion. A further rise in the credit-loss allowance, should it turn into actual tenant losses, could reduce the payout.
Net debt of $16.6 billion was almost unchanged over the quarter, and the 5.42% refinancing rate is below the coupons of the redeemed notes
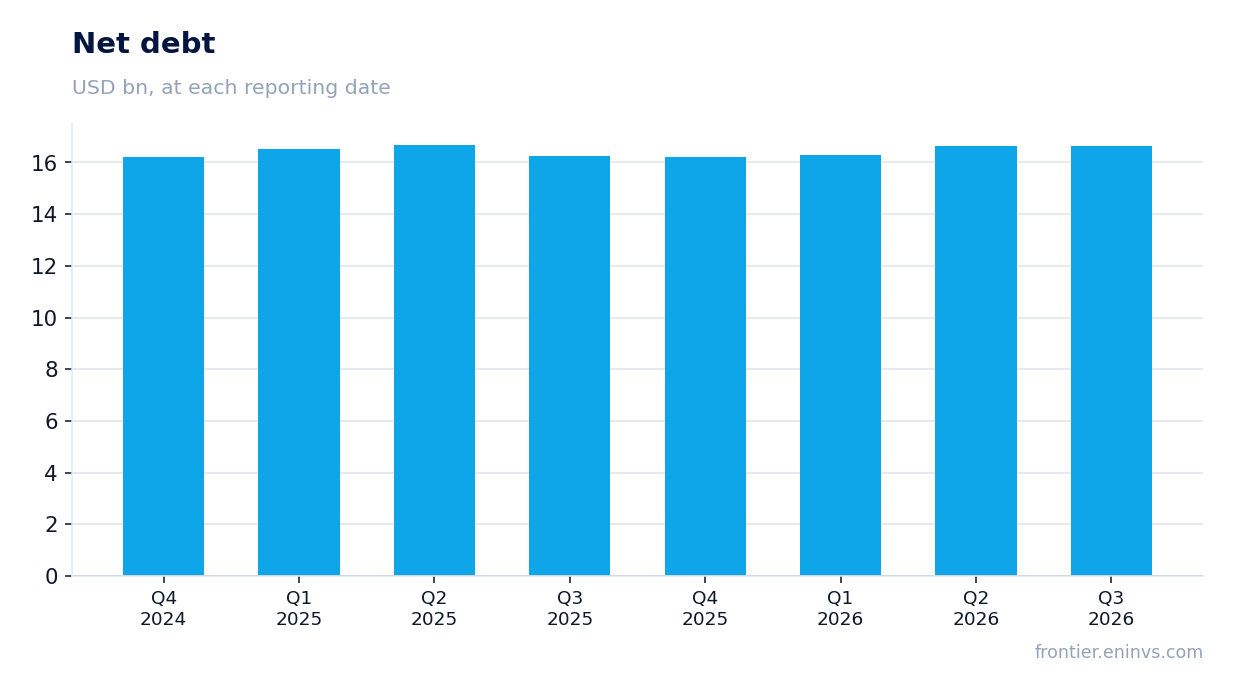
Net debt at 30 September 2026 was $16.6 billion versus $16.6 billion at 30 June, a zero change. Over the year from 30 September 2025 debt rose from $16.3 billion to $16.6 billion, an increase of $0.4 billion. Total debt is $17.2 billion, cash $270.3 million, and liquidity about $2.5 billion including the revolver.
In August the company issued $1.75 billion of senior notes: $900.0 million at 5.400% due 2031 and $850.0 million at 5.750% due 2036. The weighted average rate is 5.570%, and the adjusted rate after swaps and locks is 5.422%. Proceeds redeemed the 2026 maturities with coupons of 4.500% and 4.250%, so the refinancing raises the cost of debt but clears all of the year's maturities.
Interest expense for the quarter was $215.0 million versus $210.3 million, a small increase. Operating cash flow of $655.2 million covers interest more than three times, and that is the main argument for debt resilience.
Full-year 2026 AFFO guidance was raised to $2,695–2,705 million, or $2.47–2.48 per share
The company raised its full-year 2026 AFFO guidance to $2,695–2,705 million, or $2.47–2.48 per share, from the prior $2,675–2,695 million and $2.45–2.47. The guidance assumes a weighted average share count of 1,090.2 million.
For the nine months AFFO was $2,015.7 million, so meeting guidance requires about $680–690 million in the fourth quarter. That is close to the third-quarter level of $685.2 million, so the guidance looks achievable without acceleration.
The guidance excludes possible acquisitions without announced closing dates and other one-off transactions. The Highfield deal for the Canadian racinos will add $7.5 million of annual base rent, but closing is expected only in Q4 2026 or Q1 2027.
A $2.0 billion buyback was authorised after the reporting date and supports the valuation
On 27 October 2026 the board approved a share repurchase programme of up to $2.0 billion running to 30 September 2029. The programme does not obligate any particular volume and may be suspended.
The buyback size is comparable to full-year guided AFFO of $2,695–2,705 million, meaning the company is prepared to direct almost the entire annual flow to repurchases if it sees undervaluation. That is a signal of management confidence, but also competition for capital with the dividend and acquisitions.
We do not quote a valuation multiple: the facts contain neither a share price nor EV/EBITDA nor a historical average. Whether the share is cheap can be judged only from the dividend yield and AFFO dynamics, and both support a rather attractive view.
Valuation on the latest reported figures
| Metric | Value |
|---|---|
| Operating cash flow (LTM) | 2.58 bn |
| ROE | 4.7% |
Bottom line
The report's strength remains cash flow: AFFO rose 7.5% to $685.2 million, operating cash flow over twelve months was $2,579.0 million, and the dividend was raised for a ninth consecutive year. The 55.0% fall in net income is accounting-driven, from a $458.0 million non-cash allowance, and does not reflect a deterioration in the rental business. The question for a holder is different: net debt of $16.6 billion is barely falling, and refinancing at 5.42% raises the cost of servicing. AFFO guidance was raised to $2,695–2,705 million, and the $2.0 billion buyback supports the valuation. The verdict is rather attractive: the dividend yield and cash-flow growth outweigh the debt load, but a further rise in the allowance or revenue growth slowing below 5% would change the picture.
Open the company's financial profile VICI →
See also: market overview · valuation map · stock screeners