Vertiv Holdings Co: revenue up 61.2%, but orders are growing twice as fast and the stock already trades above its own history

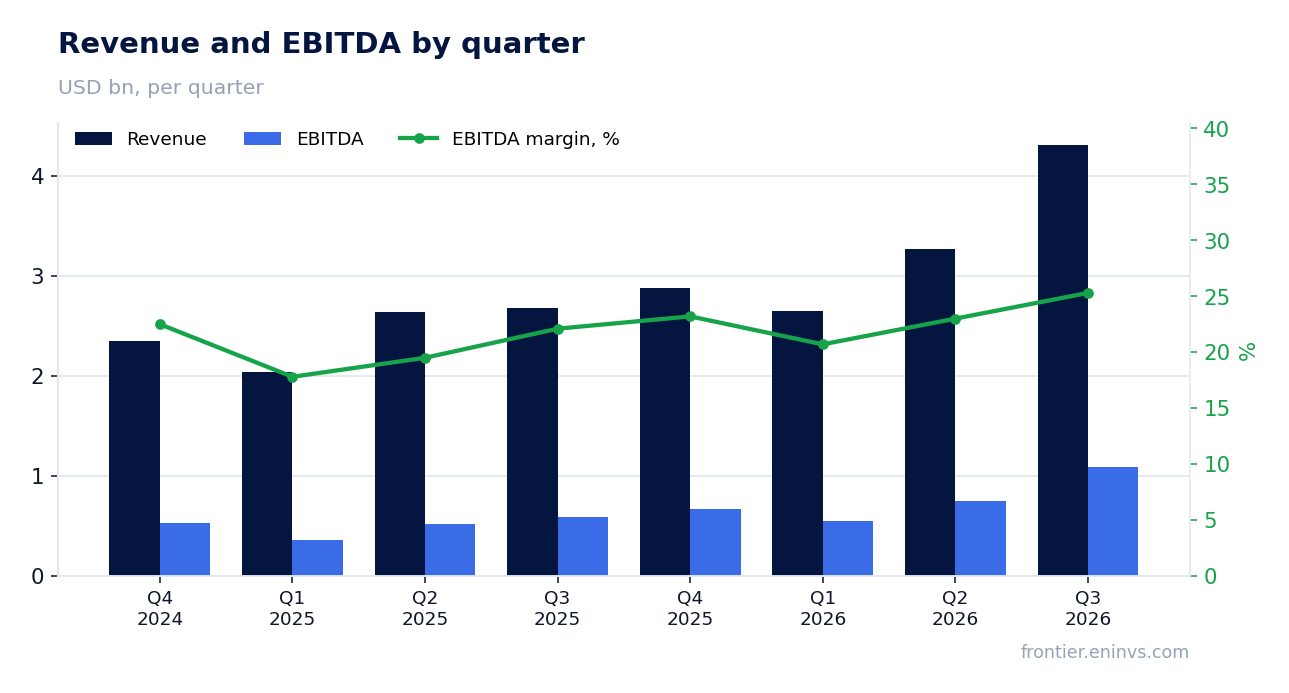
On 28 October Vertiv Holdings Co reported third-quarter 2026 results. Revenue reached $4,312.8 million, up 61.2% year on year, EBITDA was $1,091.7 million, up 84.4%, and net profit $764.5 million, up 91.8%. Growth accelerated from the second quarter, when revenue added 24.1%, and the EBITDA margin rose to 25.3% from 22.1%. Yet the stock trades at EV/EBITDA of 30.2 against its own three-year average of 26.9, and at the current price it looks rather attractive than not – but only on the strength of growth that the multiple already discounts.
Key takeaways
— Revenue added 61.2%, largely on the Americas, where sales grew 74.5%
— Organic orders growth exceeded 100%, the main argument for the pace to hold
— The EBITDA margin rose to 25.3% on operating leverage, not on one-off items
— Net debt turned into net cash: from $1.6 billion on 30 September 2025 to minus $0.6 billion on 30 September 2026
— Free cash flow of $652.2 million rose 50%, but capital expenditure is growing faster than revenue
— The company raised full-year 2026 guidance across all key metrics, including revenue to $14,450–14,850 million
— The stock trades at 30.2 EV/EBITDA against its own three-year average of 26.9, and the portal model puts upside to fair value at +34%
Attractiveness
Key figures, USD bn
| Metric | Q3 2025 | Q3 2026 | Change |
|---|---|---|---|
| Revenue | 2.68 | 4.31 | +61.2% |
| EBITDA | 0.59 | 1.09 | +84.4% |
| Operating profit | 0.52 | 0.98 | +90.4% |
| Net profit | 0.40 | 0.76 | +91.8% |
| Operating cash flow | 0.51 | 0.79 | +56.1% |
| Capex | 0.05 | 0.14 | +207.7% |
| EBITDA margin | 22.1% | 25.3% | +3.2 pp |
| Net margin | 14.9% | 17.7% | +2.8 pp |
Revenue added 61.2%, largely on the Americas, where sales grew 74.5%
Third-quarter 2026 revenue reached $4,312.8 million against $2,675.8 million a year earlier. Growth of 61.2% is well above the 24.1% of the second quarter, so the acceleration was not confined to one segment but spread across geographies. Organic growth was 55.0%, with acquisitions adding about 6%.
The Americas contributed most: sales rose 74.5% to $2,988.8 million, or 66.2% organically. Asia Pacific grew 49.9% and EMEA 22.8%. Products grew faster than services, 65.8% against 41.5%, which reflects the build-out stage of data centres, when equipment is bought first.
For a holder the breadth matters more than the quarterly jump itself. The one weak region is EMEA, where nine-month revenue grew only 2.0% and fell 3.3% organically. As long as the Americas and Asia cover that gap the picture holds, but EMEA is where growth could stumble.
Organic orders growth exceeded 100%, the main argument for the pace to hold
The company reported organic orders growth of more than 100% year on year. This is not revenue or profit but customer commitments that will turn into sales in later periods. Orders, not reported revenue, explain why management speaks of the largest infrastructure build-out and its acceleration.
The balance sheet confirms it: deferred revenue rose to $4,120.5 million from $1,814.7 million at the end of 2025, and inventories to $3,288.4 million from $1,456.5 million. The company is building both stock and prepayments to serve the backlog. That consumes working capital but reduces the risk that revenue growth hits a production ceiling.
The flip side is that orders are volatile. One large customer can move the figure by tens of percent, and the market already prices in that the pace will hold. If orders growth slows, it will hit the 2026 forecast harder than any quarterly revenue miss.
The EBITDA margin rose to 25.3% on operating leverage, not on one-off items
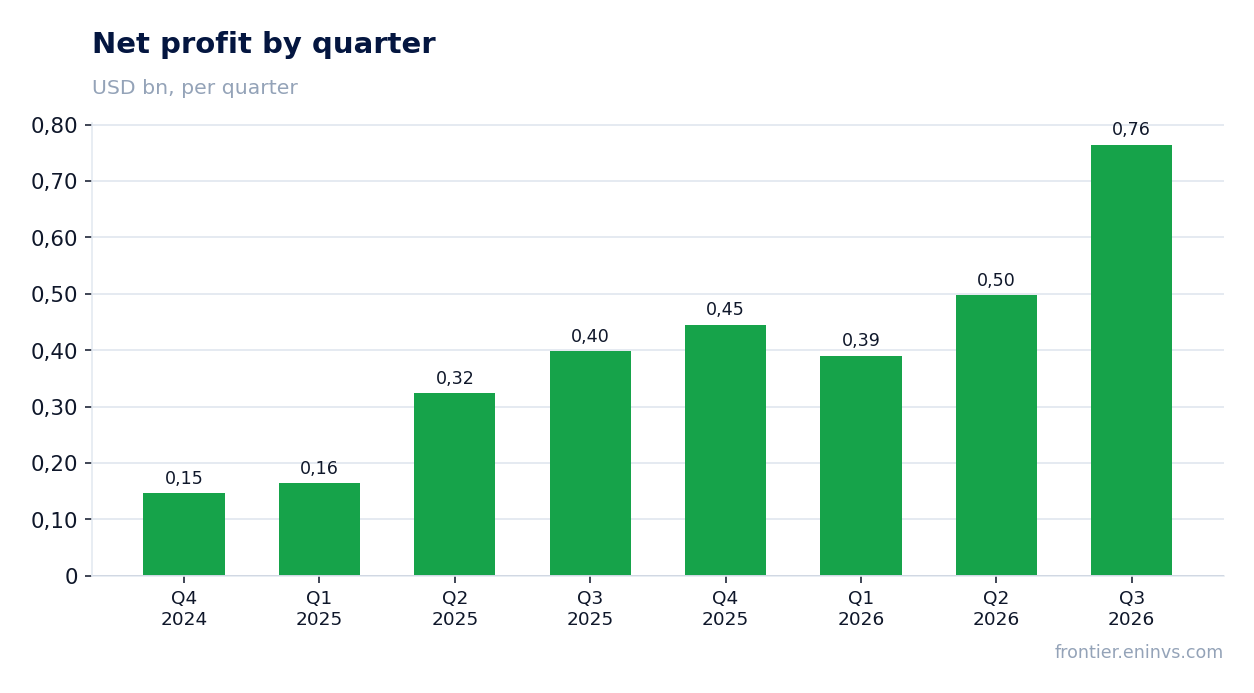
Third-quarter EBITDA reached $1,091.7 million, up 84.4% year on year, and the margin rose to 25.3% from 22.1%. Operating profit grew 90% to $983.8 million and net profit 91.8% to $764.5 million. The net margin was 17.7% against 14.9% a year earlier.
Adjusted operating margin, per the release, was 25.2%, up 290 basis points. The company attributes it to operating leverage on higher sales and manufacturing productivity, partly offset by mix and growth investments. The gap between reported and adjusted profit is small: $34.1 million of contingent consideration and $65.3 million of intangible amortisation.
So the margin expanded not on one-off items but because revenue is growing faster than fixed costs. That is the most durable kind of improvement, and also the most fragile: if growth slows, the leverage works in reverse.
Net debt turned into net cash: from $1.6 billion on 30 September 2025 to minus $0.6 billion on 30 September 2026
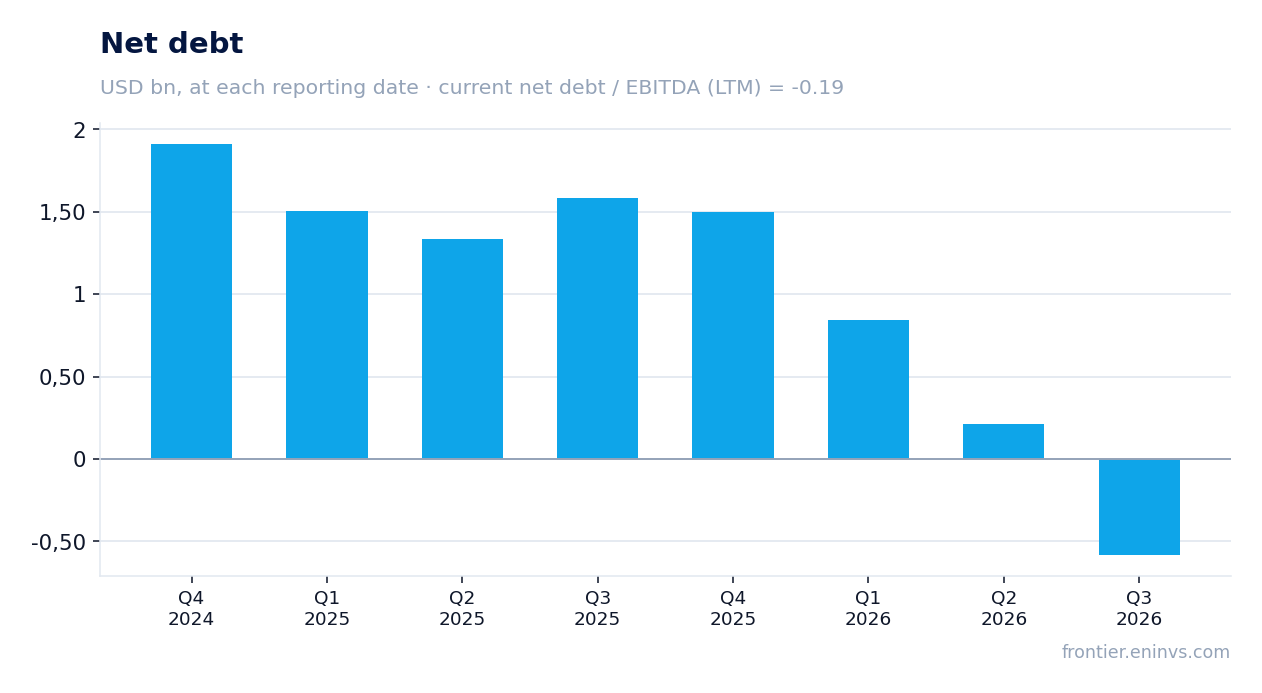
On 30 September 2026 net debt stood at minus $0.6 billion, meaning the company holds more cash than it owes. A year earlier, on 30 September 2025, net debt was $1.6 billion, and on 30 June 2026 it was $0.2 billion. Over the year the figure moved by minus $2.2 billion, over the quarter by minus $0.8 billion.
Net debt to EBITDA over the trailing twelve months is minus 0.19. Long-term debt remains: $2,925.1 million at quarter-end, but cash and short-term investments more than cover it. The company puts liquidity at $6.2 billion.
That cushion gives room to fund capital expenditure and acquisitions without new debt. It also means part of the money earns a low return, which is worth keeping in mind when judging return on capital.
Free cash flow of $652.2 million rose 50%, but capital expenditure is growing faster than revenue
Third-quarter operating cash flow was $794.0 million, up 64% year on year. Adjusted free cash flow was $652.2 million, up 50%. The difference is capital expenditure of $139.1 million and $2.7 million of capitalised software.
Capex rose from $45.2 million a year earlier, more than tripling. The company plans about 4.0% of revenue for the full year 2026, a direct consequence of expanding capacity for the growing order book. Free cash flow remains strong for now, but capex is the main line that could eat into future profit.
Working capital also absorbs cash: inventories rose by $766.9 million in the quarter and receivables by $631.9 million, partly offset by a $723.7 million increase in payables. That is normal for a company at the peak of growth, but it means profit-to-cash conversion will swing from quarter to quarter.
The company raised full-year 2026 guidance across all key metrics, including revenue to $14,450–14,850 million
Full-year 2026 guidance was raised across all key metrics. Revenue is expected at $14,450–14,850 million, organic growth of 37–39%, adjusted operating profit of $3,475–3,555 million and adjusted diluted EPS of $7.10–7.20. Adjusted free cash flow is guided at $2,600–2,800 million.
For the fourth quarter the company expects revenue of $4,313–4,513 million and organic growth of 49–51%. That is below the 61.2% of the third quarter but above the 24.1% of the second, so management assumes the high pace holds rather than reverses. Fourth-quarter adjusted operating margin is guided at 25.3–26.3%.
The $650 million revenue guidance increase is a strong signal because it comes on top of growth already delivered, not instead of it. But the market expects delivery, and any shortfall from the top end will be read as a sign of slowing.
The stock trades at 30.2 EV/EBITDA against its own three-year average of 26.9, and the portal model puts upside to fair value at +34%
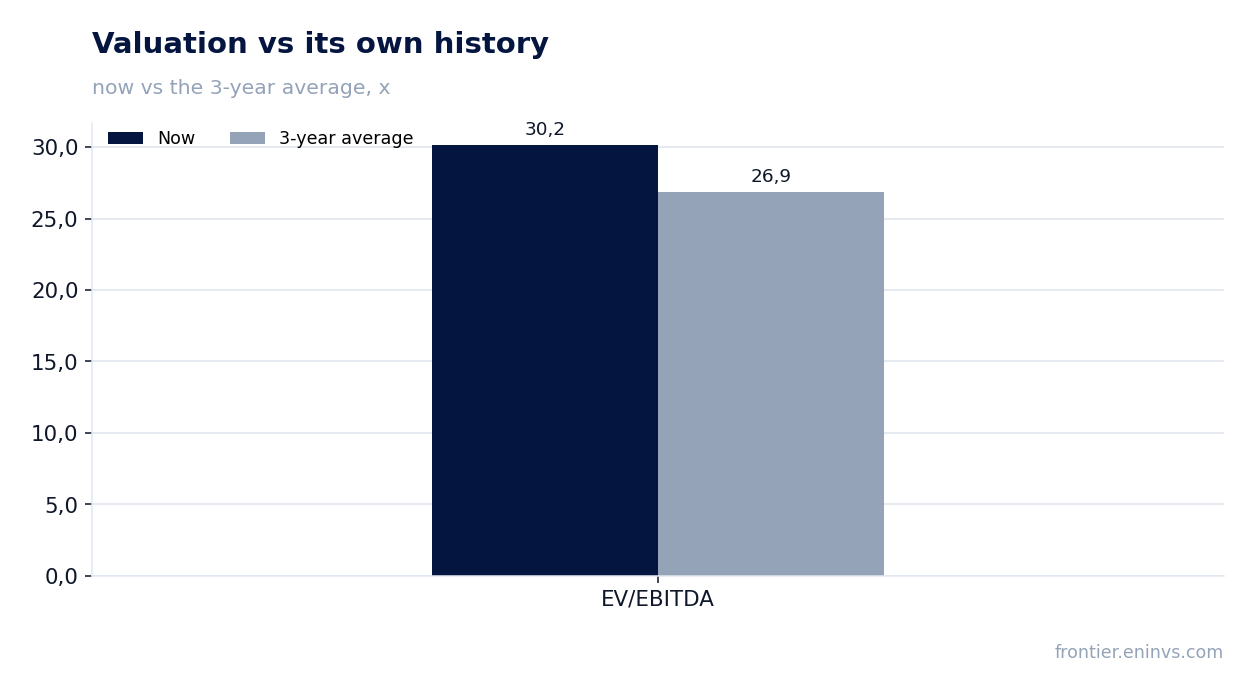
On trailing-twelve-month EV/EBITDA the stock trades at 30.2, 12% above its own three-year average of 26.9. The market values the company more richly than it has over the past three years. Trailing P/E is 44.3 and return on equity 59.6%.
The portal model puts upside to fair value at +34%. That is our own estimate, built on EBITDA growth and a target multiple, not a market consensus. It rests on profit growth continuing at rates close to the current ones.
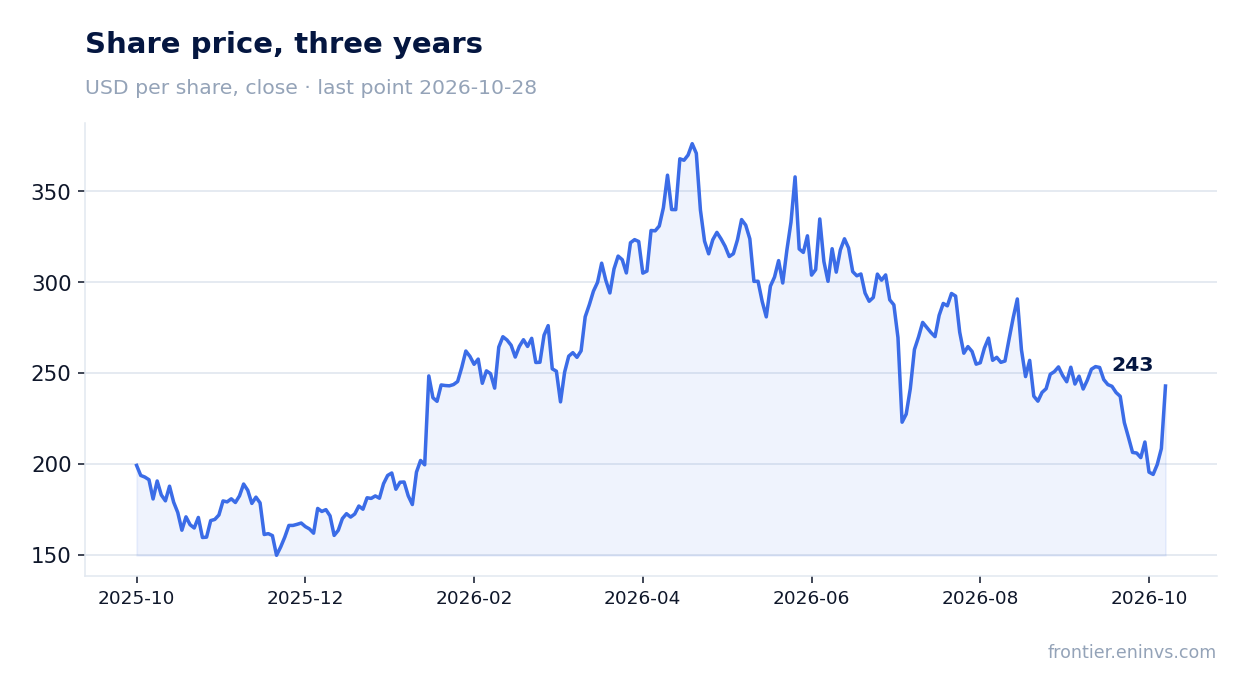
The market reaction to the release was strong: the stock added 16.5% on the day and has held that level since. Good news is therefore partly in the price. Trailing dividend yield is 0.1%, so the dividend is not an argument here but a formality.
Valuation on the latest reported figures
| Metric | Value |
|---|---|
| Market cap | 92.9 bn USD |
| P/E (LTM) | 44.3 |
| EV/EBITDA (LTM) | 30.2 |
| P/B | 23.58 |
| Net debt / EBITDA (LTM) | -0.19 |
| Operating cash flow (LTM) | 3.64 bn |
| ROE | 59.6% |
| Dividend yield (12m) | 0.1% |
| EV/EBITDA, 3-year average | 26.9 |
Bottom line
The quarter was strong across the board: revenue grew 61.2%, the EBITDA margin reached 25.3%, net profit rose 91.8%, and net debt turned into net cash of minus $0.6 billion. Growth accelerated from the second quarter and the company raised full-year 2026 guidance. But the stock already trades at 30.2 EV/EBITDA against its own three-year average of 26.9, and good news is partly in the price. The question for a holder now is not whether the quarter was good but whether orders growth above 100% holds – that will decide whether the company justifies its current valuation.
Open the company's financial profile VRT →
See also: market overview · valuation map · stock screeners