VERIZON COMMUNICATIONS INC: record EBITDA and margin expansion on a nearly flat top line — yet the stock fell after the release

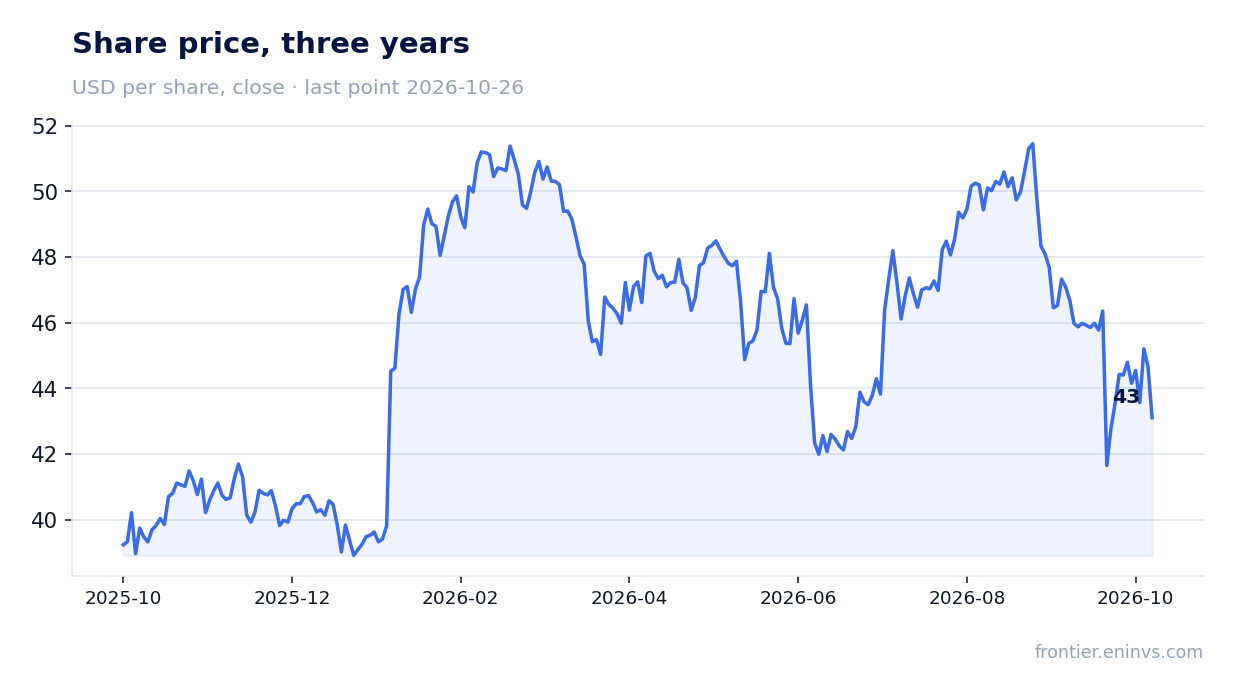
On 26 October VERIZON COMMUNICATIONS INC reported third-quarter 2026 results. Revenue came in at USD 34,313 million, up 1.5% year on year, adjusted EBITDA reached USD 13,800 million (+8.5%) and net profit was USD 5,198 million (+5.0%). The EBITDA margin rose to 40.2% from 37.6% a year earlier, while operating cash flow for the quarter was USD 11,500 million. Despite the strong figures, the share lost 3.5% after the release and was still at that level on 26 October; with an EV/EBITDA of 7.4 against its own three-year average of 7.7 and a dividend yield of 6.5%, the stock looks rather attractive, though a nearly flat top line and no growth in equipment revenue keep us from a higher rating.
Key takeaways
— Revenue grew only 1.5% — service revenue pulled up while equipment pulled down
— Record EBITDA of USD 13,800 million was achieved through lower device subsidies and equipment costs
— Net profit of USD 5,198 million contains almost no one-off items — unlike the previous quarter
— Free cash flow of USD 7,801 million rose 12.1% and covers the dividend
— A 6.5% dividend yield on a quarterly payout of USD 0.7075 per share is the main argument for the stock
— Leverage of 3.47x EBITDA LTM is a level the company services without strain
— The EV/EBITDA multiple of 7.4 is in line with its own three-year average of 7.7
Attractiveness
Key figures, USD bn
| Metric | Q3 2025 | Q3 2026 | Change |
|---|---|---|---|
| Revenue | 33.8 | 34.3 | +1.5% |
| EBITDA | 12.7 | 13.8 | +8.5% |
| Operating profit | 8.11 | 8.65 | +6.7% |
| Net profit | 4.95 | 5.20 | +5.0% |
| Operating cash flow | 11.3 | 11.5 | +2.1% |
| Capex | 4.31 | — | — |
| EBITDA margin | 37.6% | 40.2% | +2.6 pp |
| Net margin | 14.6% | 15.1% | +0.5 pp |
Revenue grew only 1.5% — service revenue pulled up while equipment pulled down
Revenue for the third quarter of 2026 was USD 34,313 million, up 1.5% year on year. This is an acceleration compared with the second quarter, when revenue declined 0.7% year on year. Within the quarter, however, the dynamics were mixed: mobility and broadband service revenue reached approximately USD 23.5 billion and grew 2.9%, while equipment revenue fell 9.0% to USD 5,116 million.
The company attributes the decline in equipment revenue to two factors: a significant reduction in upgrade volumes as customers keep their devices longer, and a strategic decision to cut device subsidies. This is part of a more disciplined model that management calls a structural transformation of the business. In the consumer segment, equipment revenue fell 10.3%, in the business segment — 1.6%.
Service revenue is growing sequentially: 1.6% in the first quarter, 2.8% in the second and 2.9% in the third. The company expects acceleration to approximately 4.0% in the fourth quarter of 2026. This is the key indicator, since service revenue forms the basis for EBITDA and cash flow.
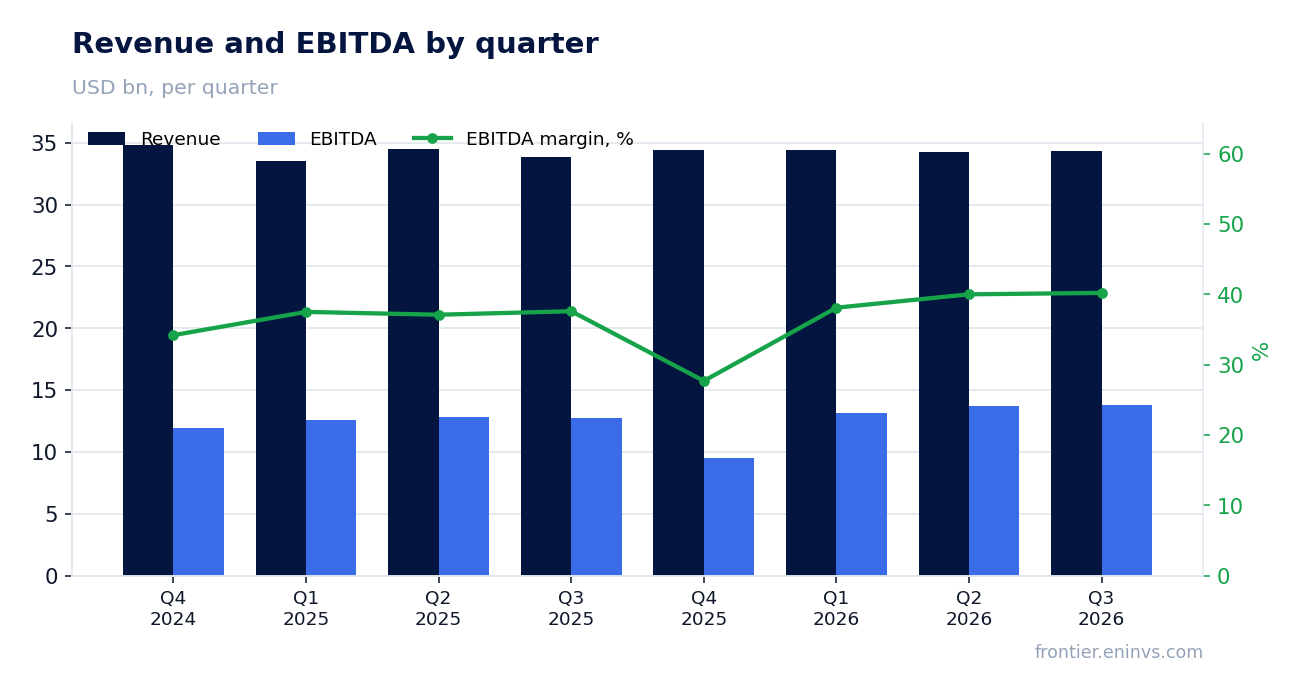
Record EBITDA of USD 13,800 million was achieved through lower device subsidies and equipment costs
Adjusted EBITDA for the third quarter of 2026 was USD 13,800 million, up 8.5% year on year and the highest quarterly result in the company's history. The EBITDA margin rose to 40.2% from 37.6% a year earlier. Such margin expansion on a nearly flat top line means cost reduction was the main contributor.
Cost of services rose 5.9% to USD 7,265 million, driven by network volume growth. However, cost of wireless equipment fell 10.2% to USD 5,823 million, matching the decline in equipment revenue and reflecting the retreat from aggressive subsidies. Selling, general and administrative expenses declined 3.5% to USD 7,480 million. In the consumer segment, EBITDA grew 6.5% at a 45.3% margin; in the business segment, 13.0% at a 27.6% margin.
The 2.6 percentage point margin expansion is not a one-off effect but the result of a changed model: the company subsidises devices less and relies more on customer retention through its loyalty programme. Promotional cost of acquisition fell 41% year on year, retention cost — 30%. Postpaid phone churn improved 4 basis points to 0.94%. This means customers leave less often and are acquired more cheaply.
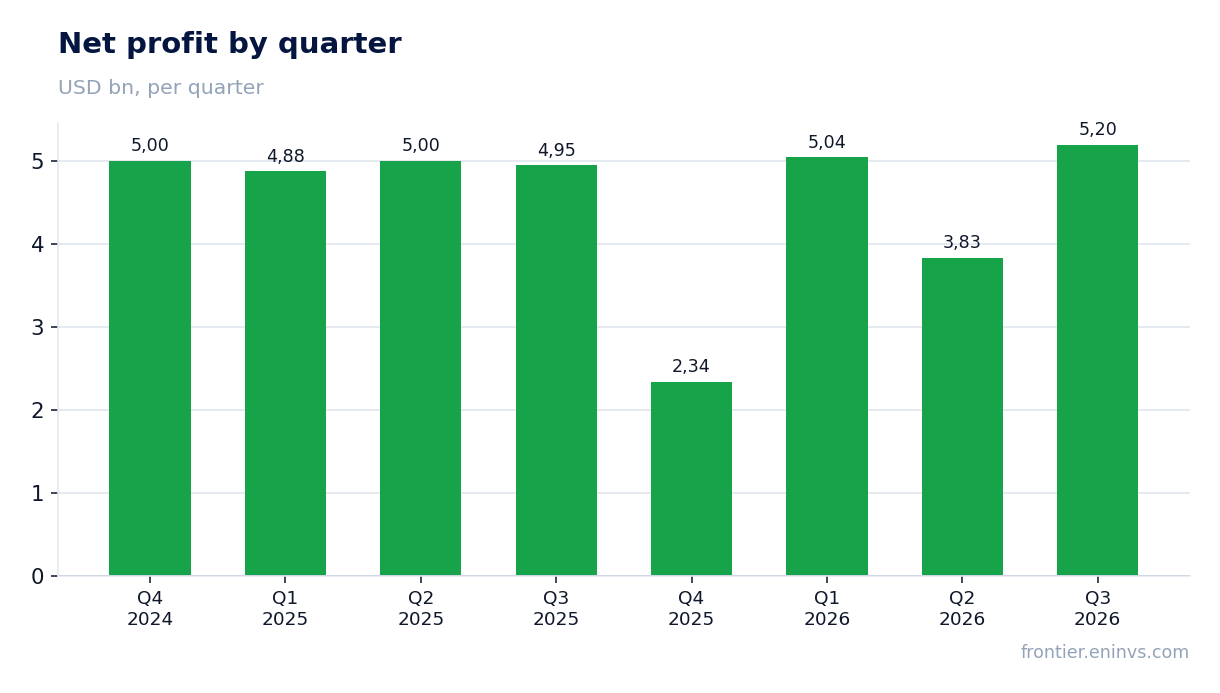
Net profit of USD 5,198 million contains almost no one-off items — unlike the previous quarter
Net profit attributable to Verizon shareholders for the third quarter of 2026 was USD 5,198 million, up 5.0% year on year. The net margin rose to 15.1% from 14.6%. Operating profit increased 6.7% to USD 8,650 million. This is a clean result, not distorted by large one-off write-offs.
For comparison: in the second quarter of 2026, net profit was USD 3,835 million and adjusted EBITDA was USD 13,700 million. The gap between the quarters is explained by one-off items in the second quarter: severance charges (USD 397 million), acquisition and integration charges (USD 135 million), asset and business rationalisation charges (USD 258 million) and a loss on disposition of business (USD 746 million). In the third quarter there are almost no such items — only USD 57 million of integration charges.
Adjusted earnings per share were USD 1.31 versus USD 1.21 a year earlier, up 8.3%. Basic earnings per share were USD 1.25, up 6.8%. The number of shares outstanding fell to 4,145 million thanks to USD 4.0 billion of buybacks over nine months, which also supports earnings per share.
Free cash flow of USD 7,801 million rose 12.1% and covers the dividend
Operating cash flow for the third quarter of 2026 was USD 11,500 million, up 2.2% year on year. Capital expenditure fell to USD 3,716 million from USD 4,310 million a year earlier, allowing free cash flow to grow 12.1% to USD 7,801 million. Over nine months, free cash flow was USD 18,010 million, up 14.3%.
The company raised its full-year 2026 free cash flow guidance to USD 22,440–22,540 million, implying growth of 11.5–12.0% year on year. Capital expenditure guidance remains at USD 16.0–16.5 billion, including success-based investments for AI Connect. Over nine months, capital expenditure was USD 11,926 million, in line with the guidance.
Free cash flow comfortably covers the dividend: over nine months, USD 8,804 million went to dividends and USD 4,000 million to share buybacks. Total capital returned to shareholders was USD 12,800 million, up 49.0% year on year. The company reaffirmed its intention to repurchase up to USD 4.5 billion of shares for the full year.
A 6.5% dividend yield on a quarterly payout of USD 0.7075 per share is the main argument for the stock
For the third quarter of 2026, the company declared a quarterly dividend of USD 0.7075 per share. At the share price of USD 44.66 before the release, the trailing twelve-month dividend yield is 6.5%. This is a high level for the US equity market, where the yield on ten-year Treasury bonds has fluctuated around 4–5% in recent years.
Our estimate for the 2026 dividend is based on the current quarterly rate: four payments of USD 0.7075 give USD 2.83 per share. With adjusted earnings per share guidance of USD 5.04–5.06, the payout ratio is about 56%. This is a moderate level that leaves room for dividend growth and buybacks. The payout is covered by free cash flow: over nine months, dividends were USD 8,804 million against free cash flow of USD 18,010 million.
The dividend could be reduced if free cash flow falls below guidance. The main risks are capital expenditure above USD 16.5 billion, for example on expanding the fibre network to 40–50 million households in the medium term, or rising interest expense, which grew 19.0% over nine months to USD 5,875 million. However, the current level of dividend coverage by cash flow leaves a wide margin of safety.
Leverage of 3.47x EBITDA LTM is a level the company services without strain
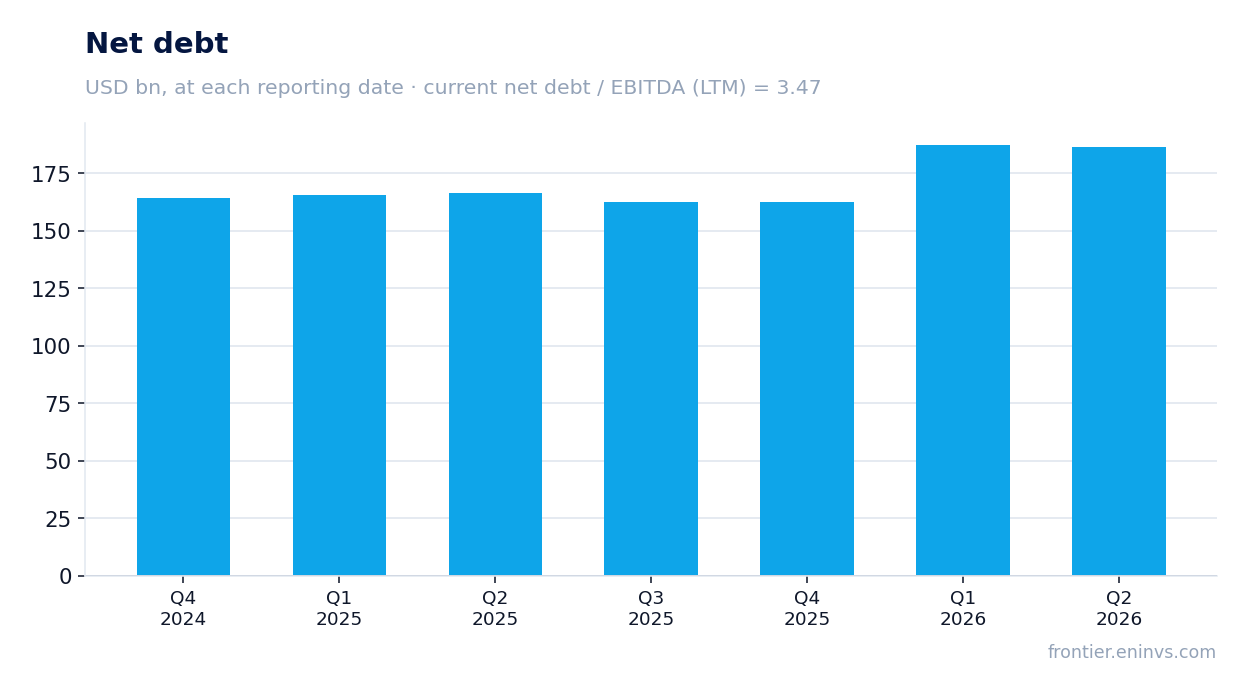
Net debt at the end of 2025 was USD 162,595 million. The ratio of net debt to EBITDA for the trailing twelve months is 3.47. This is a moderate level for a telecom company with stable cash flow. Interest expense for the third quarter of 2026 was USD 1,950 million, up 17.2% year on year due to higher rates and increased debt.
Total debt at the end of the third quarter of 2026 was USD 166,233 million, of which USD 136,095 million was unsecured debt. The company is actively refinancing: over nine months it raised USD 13,658 million of long-term borrowings and USD 13,773 million through securitisation, and repaid USD 17,349 million of long-term borrowings and USD 14,285 million of securitisation. Net unsecured debt declined to USD 123,721 million from USD 128,682 million at the end of the second quarter.
The ratio of net unsecured debt to adjusted EBITDA for the trailing twelve months is 2.3. This is a comfortable level that allows the company to maintain its investment-grade credit rating and access to capital markets. However, the 19.0% increase in interest expense over nine months is a factor that will weigh on profit in the coming quarters if rates remain high.
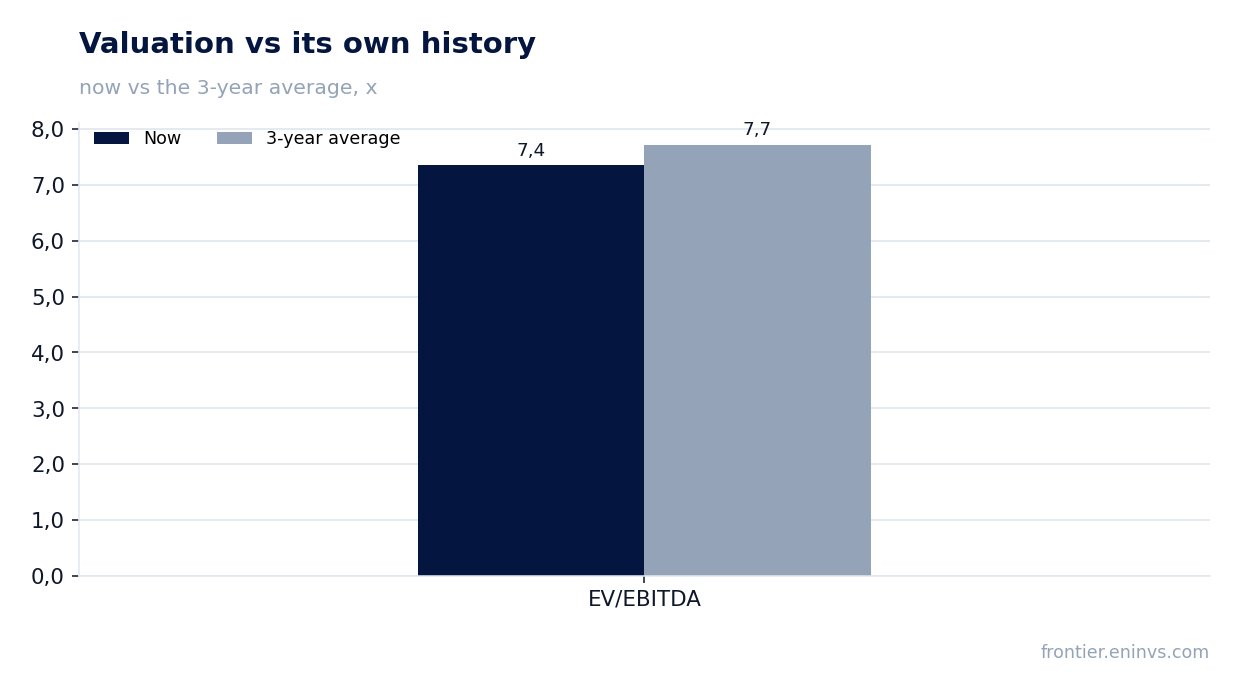
The EV/EBITDA multiple of 7.4 is in line with its own three-year average of 7.7
Based on the trailing twelve months, EV/EBITDA is 7.4, 5% below its own three-year average of 7.7. This means the stock is valued roughly as it has been on average over the past three years, without a premium or a discount. The trailing P/E is 11.1, corresponding to an earnings yield of about 9.0%. Return on equity is 14.6%.
Our fundamental valuation model, based on EBITDA growth and a target multiple, implies upside to fair value of minus 5%. This means that on the portal's model the stock trades slightly above its fair value, despite the low multiple. The reason is that EBITDA growth over the trailing twelve months was moderate, and the model accounts for sustainable growth rather than one-off effects.
A 6.5% dividend yield and a multiple in line with the historical average provide a basis for valuation. However, the absence of revenue growth and the decline in equipment revenue limit the potential for re-rating. A sustained increase in service revenue above 3% and further margin expansion would be needed to raise the valuation, while a slowdown in service revenue growth or higher capital expenditure would lower it.
Valuation on the latest reported figures
| Metric | Value |
|---|---|
| Market cap | 182 bn USD |
| P/E (LTM) | 11.1 |
| EV/EBITDA (LTM) | 7.4 |
| P/B | 1.72 |
| Net debt / EBITDA (LTM) | 3.47 |
| Operating cash flow (LTM) | 39.0 bn |
| ROE | 14.6% |
| Dividend yield (12m) | 6.5% |
| EV/EBITDA, 3-year average | 7.7 |
Bottom line
The strong point of the report was record EBITDA of USD 13,800 million and margin expansion to 40.2% — the result of abandoning subsidies and cutting equipment costs. Net profit of USD 5,198 million contains almost no one-off items, and free cash flow of USD 7,801 million rose 12.1% and comfortably covers the dividend. The weak spot is revenue: growth of only 1.5% with equipment down 9.0% shows the model depends on service revenue, which is growing at 2.9%. The EV/EBITDA multiple of 7.4 is in line with its own three-year average of 7.7, and the 6.5% dividend yield remains the main argument. On balance, the stock looks rather attractive, but a sustained increase in service revenue above 3% and further margin expansion are needed for a higher rating.
Open the company's financial profile VZ →
See also: market overview · valuation map · stock screeners