WESCO INTERNATIONAL INC: revenue accelerated to +16.6%, but the stock is already above its own history

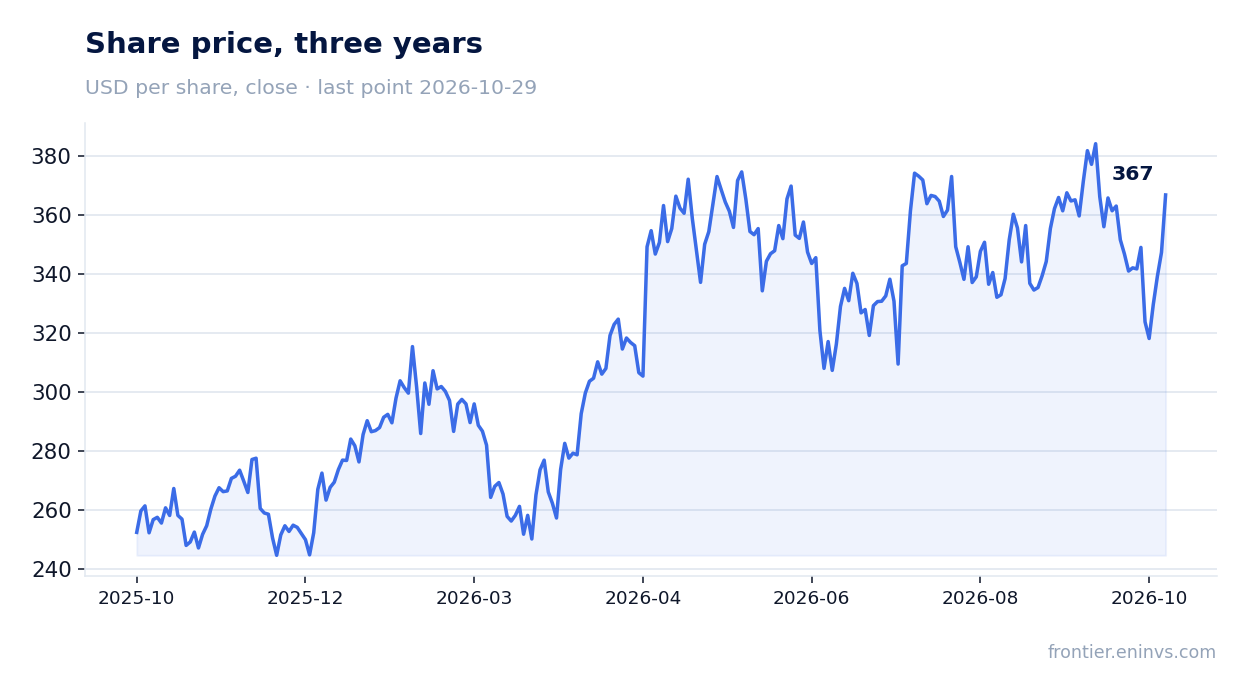
On 29 October WESCO INTERNATIONAL INC reported results for the third quarter of 2026. Revenue came in at USD 7,226.4 mn, up 16.6% year on year, EBITDA at USD 503.4 mn (+27.6%) and net profit at USD 267.8 mn (+42.8%). Growth accelerated from the second quarter, when revenue was adding 13.0%, and the EBITDA margin rose to 7.0% from 6.4%. Yet the trailing-twelve-month EV/EBITDA of 13.4x sits 28% above its own three-year average of 10.5x, so despite the strong operating momentum the share looks fairly valued rather than cheap.
Key takeaways
— Revenue added 16.6% year on year, faster than the 13.0% of the second quarter
— EBITDA grew 27.6%, outpacing revenue, and the margin rose to 7.0% from 6.4%
— Net profit grew 42.8%, with the net margin reaching 3.7%
— Operating cash flow of USD 193.9 mn covered capital expenditure of USD 29.1 mn with room to spare
— Net debt fell from USD 5.9 bn on 30 September 2025 to USD 5.2 bn on 30 September 2026
— Net debt to trailing-twelve-month EBITDA stands at 2.88x – a moderate level
— EV/EBITDA of 13.4x is 28% above its own three-year average of 10.5x
Attractiveness
Key figures, USD bn
| Metric | Q3 2025 | Q3 2026 | Change |
|---|---|---|---|
| Revenue | 6.20 | 7.23 | +16.6% |
| EBITDA | 0.39 | 0.50 | +27.6% |
| Operating profit | 0.35 | 0.45 | +30.5% |
| Net profit | 0.19 | 0.27 | +42.8% |
| Operating cash flow | -0.08 | 0.19 | to profit |
| Capex | 0.01 | 0.03 | +120.5% |
| EBITDA margin | 6.4% | 7.0% | +0.6 pp |
| Net margin | 3.0% | 3.7% | +0.7 pp |
Revenue added 16.6% year on year, faster than the 13.0% of the second quarter
In the third quarter of 2026 revenue reached USD 7,226.4 mn, 16.6% more than a year earlier. That is an acceleration from the 13.0% growth of the second quarter and the best pace among the last six quarters. Sequentially, sales rose from USD 6,665.1 mn.
The acceleration comes against an already high base: in the third quarter of 2025 revenue was USD 6,199.1 mn and growing at 12.9%. The company did not merely hold double-digit growth but increased it, which for a distributor with a large turnover means a real inflow of orders rather than a low-base effect.
The next quarter matters for judging sustainability: if growth stays above 13%, it will confirm the acceleration is not one-off. For now, revenue dynamics are the strongest argument in the report.
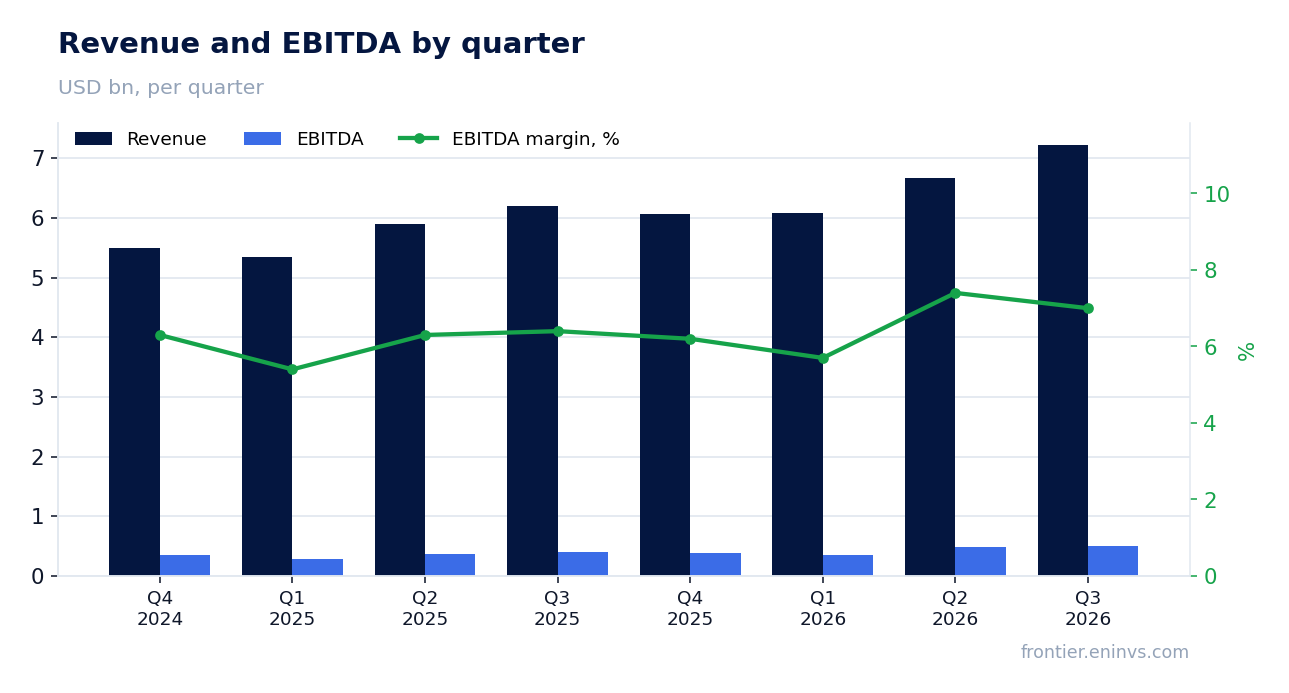
EBITDA grew 27.6%, outpacing revenue, and the margin rose to 7.0% from 6.4%
EBITDA for the third quarter of 2026 was USD 503.4 mn, 27.6% more than a year earlier. The metric grew almost twice as fast as revenue, and this showed up in the margin: 7.0% versus 6.4% a year earlier.
Operating profit was USD 450.8 mn. The gap between EBITDA and operating profit is small, so the main contribution to the margin improvement came from operating efficiency rather than one-off items below the operating line.
A 0.6 percentage point margin improvement on revenue above USD 7 bn delivers a tangible increase in absolute EBITDA. This combination – accelerating sales plus margin expansion – is what makes the quarter strong.
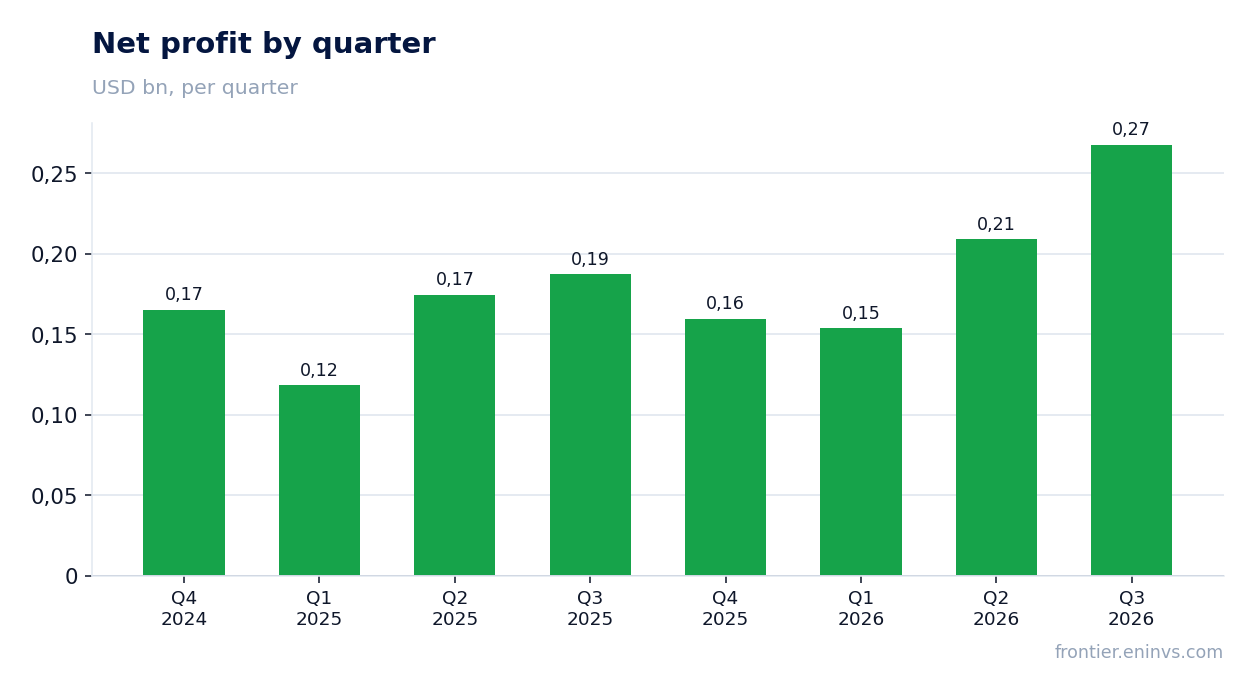
Net profit grew 42.8%, with the net margin reaching 3.7%
Net profit for the third quarter of 2026 was USD 267.8 mn, 42.8% more than a year earlier. The net margin rose to 3.7% from 3.0%.
Profit grew faster than EBITDA, which implies improvement below the operating line as well – likely from lower interest costs as debt was reduced. Over the trailing twelve months net profit was USD 790.4 mn.
A 3.7% net margin is a normal level for a distributor, and its 0.7 percentage point increase shows the company is converting operating improvement into shareholder profit.
Operating cash flow of USD 193.9 mn covered capital expenditure of USD 29.1 mn with room to spare
Operating cash flow for the third quarter of 2026 was USD 193.9 mn against capital expenditure of USD 29.1 mn. Free cash flow therefore remains positive and substantial relative to profit.
Capital expenditure is small – about 0.4% of revenue, typical for a distributor that does not need large plants. This allows almost all operating cash flow to go towards debt reduction and shareholder payouts.
Over the trailing twelve months operating cash flow was USD 737.2 mn. The stability of cash flow is an important condition for servicing debt and dividends.
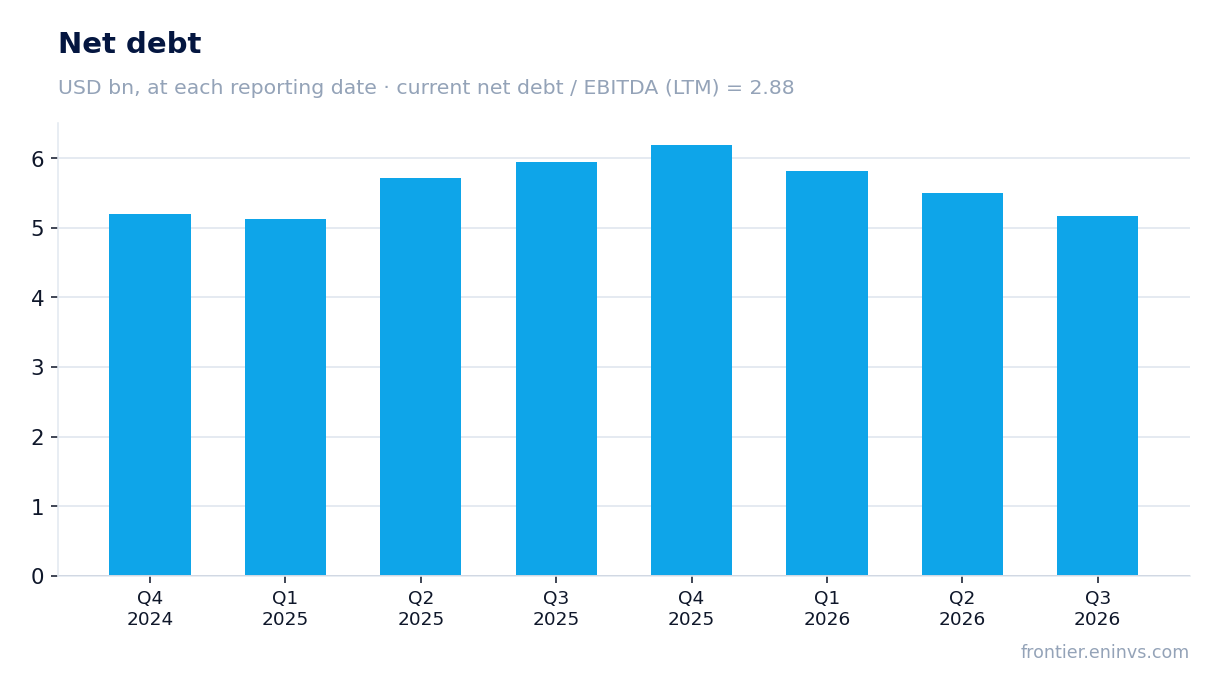
Net debt fell from USD 5.9 bn on 30 September 2025 to USD 5.2 bn on 30 September 2026
Net debt on 30 September 2026 was USD 5.2 bn versus USD 5.9 bn on 30 September 2025 – a reduction of USD 0.8 bn over the year. During the quarter the figure fell from USD 5.5 bn on 30 June 2026.
The ratio of net debt to trailing-twelve-month EBITDA stands at 2.88x. That is a moderate level for a company with a market capitalisation of USD 17.8 bn and leaves room for manoeuvre.
Debt reduction alongside growing EBITDA is the main factor that allowed profit to outpace operating profit. Further deleveraging will support profit in the coming quarters as well.
Net debt to trailing-twelve-month EBITDA stands at 2.88x – a moderate level
The ratio of net debt to trailing-twelve-month EBITDA is 2.88x. For a distributor this is a comfortable level: debt is serviced and cash flow covers interest with room to spare.
Importantly, debt reduction is happening alongside EBITDA growth, so the numerator falls while the denominator rises. That amplifies the effect, but we state the ratio only as a level – no prior-period comparison is available in the facts.
If current dynamics persist, leverage does not look like a constraint on dividends or investment.
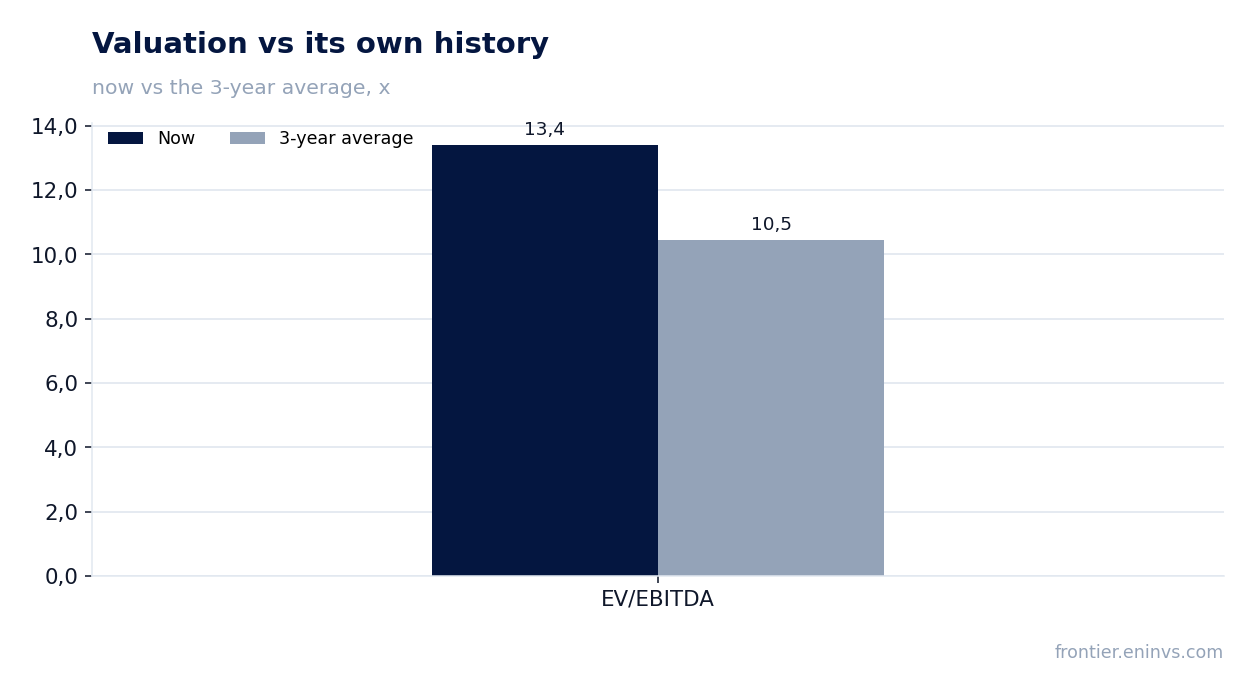
EV/EBITDA of 13.4x is 28% above its own three-year average of 10.5x
The trailing-twelve-month EV/EBITDA multiple is 13.4x against its own three-year average of 10.5x. The stock trades 28% above its history, meaning the market has already priced in strong results.
The trailing-twelve-month P/E is 22.6x and return on equity is 20.1%. For a company with such a return on capital the premium to its own history is explicable, but it limits the scope for further re-rating.
On the portal's model, fair value implies upside of +31% to the current price. This is our own estimate, not a market consensus, and it rests on EBITDA growth and a target multiple.
Valuation on the latest reported figures
| Metric | Value |
|---|---|
| Market cap | 17.8 bn USD |
| P/E (LTM) | 22.6 |
| EV/EBITDA (LTM) | 13.4 |
| P/B | 3.55 |
| Net debt / EBITDA (LTM) | 2.88 |
| Operating cash flow (LTM) | 0.74 bn |
| ROE | 20.1% |
| Dividend yield (12m) | 0.5% |
| EV/EBITDA, 3-year average | 10.5 |
Bottom line
The quarter was strong across all operating lines: revenue accelerated to 16.6%, EBITDA grew 27.6%, the margin expanded and net debt fell to USD 5.2 bn. Cash flow covers capital expenditure with a large margin, and the 2.88x debt-to-EBITDA ratio is not a concern. The main question for a holder is price: EV/EBITDA of 13.4x is 28% above its own three-year history, and the market has already priced in part of the success. On the portal's model the upside is +31%, but it requires current growth rates to persist. The verdict is rather attractive: the business is performing well, but the share is not cheap.
Open the company's financial profile WCC →
See also: market overview · valuation map · stock screeners