WESTERN DIGITAL CORP: revenue up 55.5%, but profit barely moved – one-offs in the prior year absorbed the growth

On 22 October WESTERN DIGITAL CORP reported results for the first quarter of fiscal 2027 (ended 2 October 2026). Revenue came in at $4,381.0m, operating profit at $2,046.0m, net profit at $1,779.0m. Year over year revenue rose 55.5% while net profit added only 50.5%, because the prior-year quarter carried a one-off gain on the retained Sandisk interest. At 26.4x EV/EBITDA the share trades above its own three-year average of 21.6x, so the verdict is neutral: the strong operating growth is already in the price.
Key takeaways
— Gross margin climbed to 57.8% from 43.5% – pricing power, not just volume, drove the growth
— Net profit added only 50.5% because the prior-year quarter carried a one-off gain on the retained Sandisk interest
— Operating cash flow of $1,604.0m covered capex of $227.0m and $1,001.0m of buybacks
— The company raised its quarterly dividend by 17% to $0.175 per share, but the yield remains symbolic
— EV/EBITDA of 26.4x is 22% above its own three-year average of 21.6x – the share is more expensive than its history
— On the portal's model the upside to fair value is +36%
Attractiveness
Key figures, USD bn
| Metric | Q4 2025 | Q4 2026 | Change |
|---|---|---|---|
| Revenue | 2.82 | 4.38 | +55.5% |
| EBITDA | 0.88 | — | — |
| Operating profit | 0.79 | 2.05 | +158.3% |
| Net profit | 1.18 | 1.78 | +50.5% |
| Operating cash flow | 0.67 | 1.60 | +138.7% |
| Capex | 0.07 | — | — |
| EBITDA margin | 31.2% | — | — |
| Net margin | 41.9% | 40.6% | -1.3 pp |
Revenue for the first quarter of fiscal 2027 was $4,381.0m against $2,818.0m a year earlier, up 55.5%. Sequentially it rose 17% from $3,747.0m in the fourth quarter of fiscal 2026.
The year-over-year rate slowed: revenue grew 55.5% in the first quarter of fiscal 2026 but 43.8% in the reported quarter. That is still very strong growth, but no longer acceleration.
The company attributes the dynamics to robust demand from hyperscalers and cloud providers and to exabyte shipment growth. The release states plainly that volume and improved pricing drove the increase.
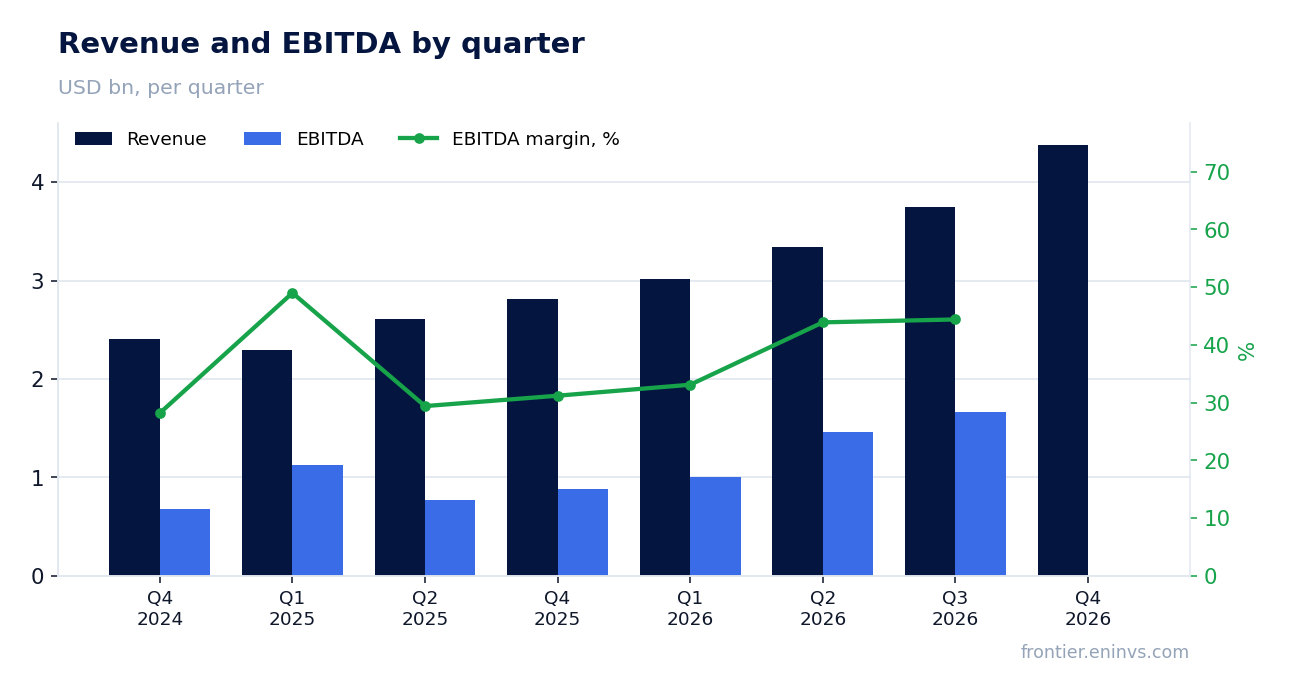
Gross margin climbed to 57.8% from 43.5% – pricing power, not just volume, drove the growth
GAAP gross margin was 57.8% against 43.5% a year earlier, up 1,430 basis points. The non-GAAP margin was 58.1%.
Operating margin rose to 46.7% from 28.1%: operating expenses added only $53.0m while revenue added $1,563.0m. Most of the profit increase came from gross margin, not from cost savings.
Non-GAAP operating margin reached 49.1% against 30.4% a year earlier. For a hard-drive maker that level reflects tight supply and strong pricing.
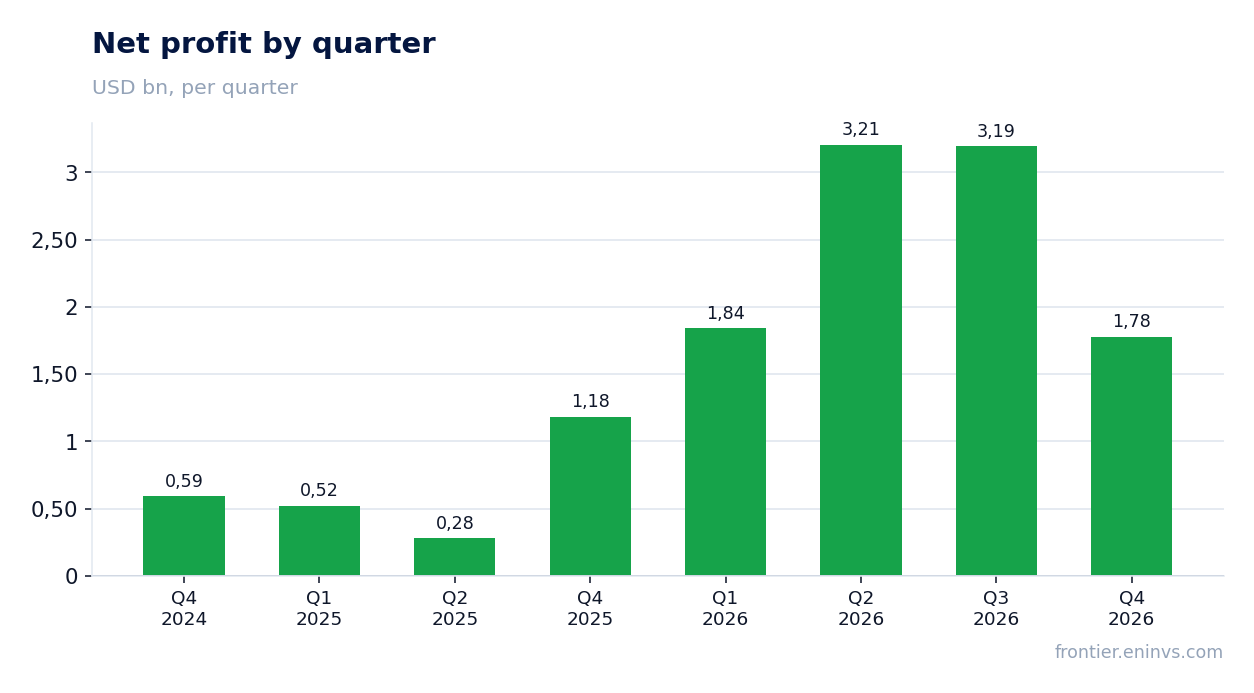
Net profit added only 50.5% because the prior-year quarter carried a one-off gain on the retained Sandisk interest
Net profit was $1,779.0m against $1,182.0m a year earlier, up 50.5%. The net margin slipped to 40.6% from 41.9%.
The gap is explained by a one-off: the first quarter of fiscal 2026 included a $611.0m gain on the mark-to-market of the retained Sandisk interest. Without it the prior-year base would have been lower and the current profit growth would look markedly stronger.
There were no such items in the reported quarter: other income and expense was minus $8.0m. Non-GAAP net income matched GAAP at $1,779.0m.
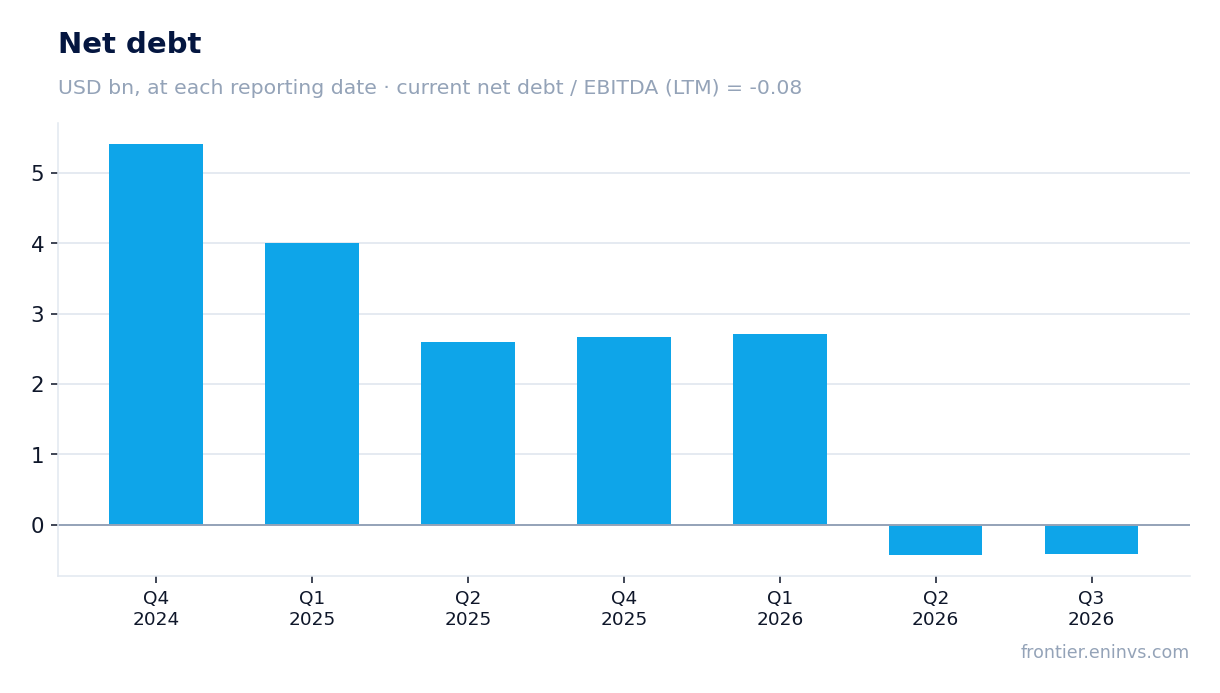
Operating cash flow of $1,604.0m covered capex of $227.0m and $1,001.0m of buybacks
Operating cash flow for the quarter was $1,604.0m against $672.0m a year earlier. Free cash flow was $1,377.0m after $227.0m of capex.
The company spent $1,001.0m on buybacks and $56.0m on dividends. A further $570.0m went to settle convertible notes, while $300.0m of new debt was raised.
Cash on the balance sheet fell to $1,314.0m from $1,579.0m at the fiscal year-end. Net debt at the latest reporting date was negative at minus $388.0m, meaning cash exceeds debt.
The company raised its quarterly dividend by 17% to $0.175 per share, but the yield remains symbolic
The board declared a quarterly dividend of $0.175 per share, 17% above the previous level. Payment is set for 17 December 2026 to holders of record on 4 December.
The trailing twelve-month dividend yield is 0.16%. At that yield the dividend is not an argument for the share: the company returns capital mainly through buybacks, on which it spent $1,001.0m in the quarter.
The dividend increase reflects management's confidence in cash flow, but for an income-oriented investor the stock does not fit: the payout is small relative to the price and to profit.
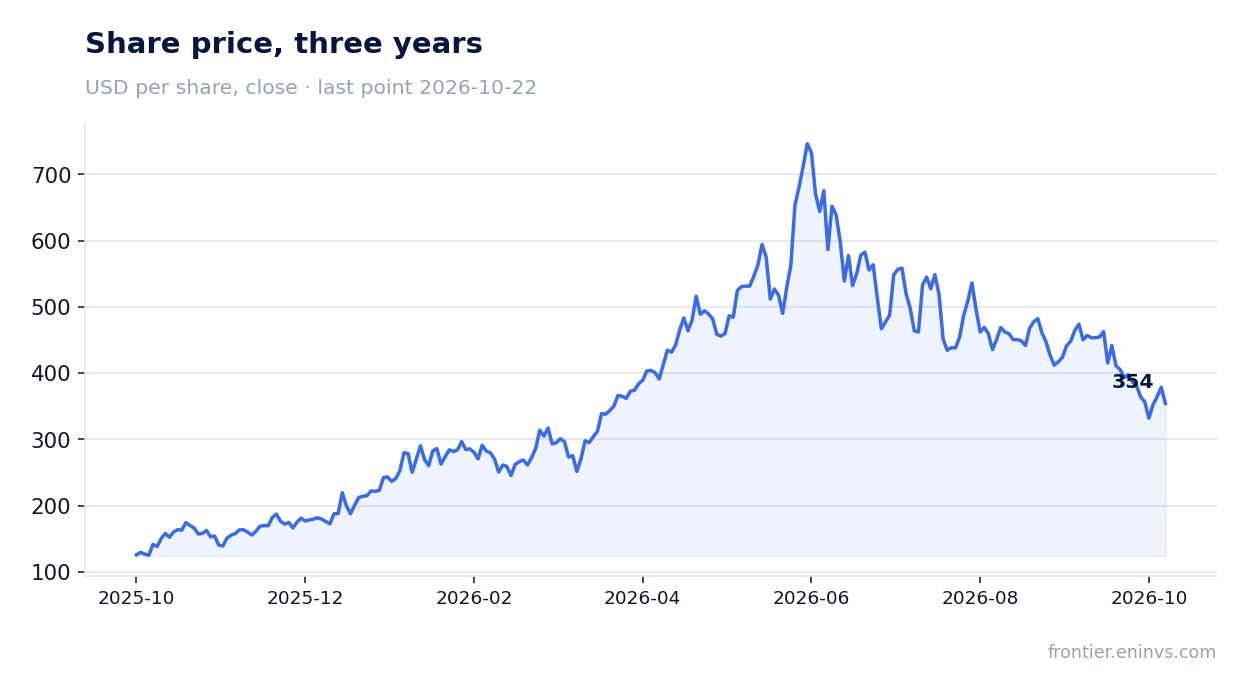
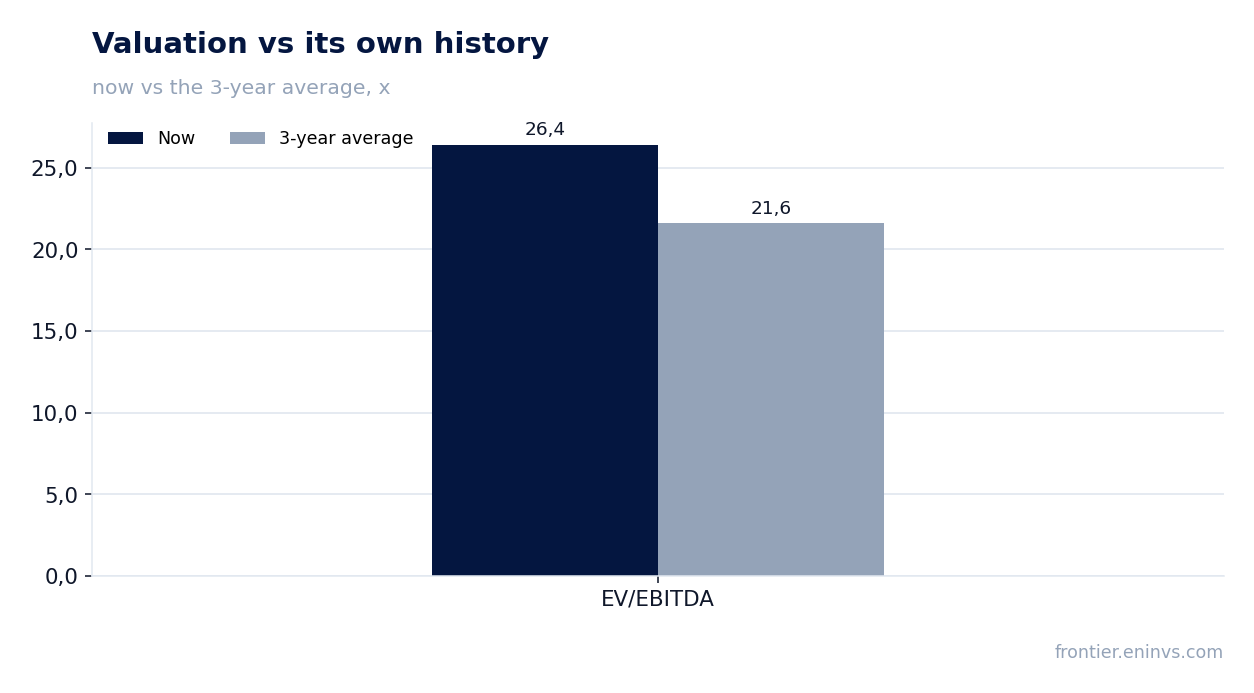
EV/EBITDA of 26.4x is 22% above its own three-year average of 21.6x – the share is more expensive than its history
EV/EBITDA for the trailing twelve months is 26.4x against its own three-year average of 21.6x, 22% above. On this multiple the share is more expensive than its three-year average.
The trailing P/E is 12.8x. The gap between a high EV/EBITDA and a moderate P/E comes from the capital structure: net debt is negative, and trailing profit includes one-off gains on the Sandisk stake.
Return on equity is 78.1%, but it is inflated by the same one-offs and by negative net debt. The earnings-based valuation looks softer than the EBITDA-based one, and that gap is the main question for the multiples.
On the portal's model the upside to fair value is +36%
On the portal's model, which compares EBITDA growth at a target multiple with market capitalisation, the upside to fair value is +36%. That is our own estimate, not a market consensus and not a target price.
The model rests on strong EBITDA and cash flow growth. But the market has already reacted to the report with a decline: the share fell 6.4% on the release day and is down the same 6.4% from then to 22 October.
The reaction shows investors expected more from a quarter with 55.5% revenue growth. The gap between the model and the market lies in the durability of the margin: if it holds near 58%, the model's upside materialises; if not, the market is right.
Valuation on the latest reported figures
| Metric | Value |
|---|---|
| Market cap | 128 bn USD |
| P/E (LTM) | 12.8 |
| EV/EBITDA (LTM) | 26.4 |
| P/B | 14.42 |
| Net debt / EBITDA (LTM) | -0.08 |
| Operating cash flow (LTM) | 4.86 bn |
| ROE | 78.1% |
| Dividend yield (12m) | 0.2% |
| EV/EBITDA, 3-year average | 21.6 |
Bottom line
The quarter was strong operationally: revenue rose 55.5%, gross margin added 1,430 basis points, operating profit doubled. But net profit added only 50.5% because the prior-year quarter carried a $611.0m one-off gain on the Sandisk stake – without it profit growth would have been markedly higher. Cash flow of $1,604.0m covered both capex and $1,001.0m of buybacks, and net debt remains negative. The question for a holder now is not operating results but price: EV/EBITDA of 26.4x is above its own three-year average of 21.6x, and the market has already marked the share down 6.4% after the report. The verdict is neutral: the growth is real, but it is already paid for in the valuation.
Open the company's financial profile WDC →
See also: market overview · valuation map · stock screeners