World Kinect: revenue up 41.3% but EBITDA margin compressed to 0.8%, and the multiple sits 8.5x above its own history
On 29 October World Kinect reported third-quarter 2026 results. Revenue rose 41.3% year on year to USD 13,270.7 million, EBITDA added 17.9% to USD 101.9 million and net profit 47.9% to USD 38.0 million. Revenue growth decelerated from +50.3% in the second quarter, the EBITDA margin compressed to 0.8% from 0.9% a year earlier, and EV/EBITDA LTM stands at 59.2 against its own three-year average of 6.9. The share looks unattractive at the current price: revenue growth is not converting into margin, and the multiple is far from its historical level.
Key takeaways
— Revenue rose 41.3% year on year, but growth decelerated from 50.3% in the second quarter
— EBITDA margin compressed to 0.8% from 0.9% because revenue grew faster than EBITDA (+17.9%)
— One-off items added to profit: adjusted EBITDA of 127.1 million versus GAAP 101.9 million
— Free cash flow of 164.4 million on operating cash flow of 175.2 million and capex of 10.8 million
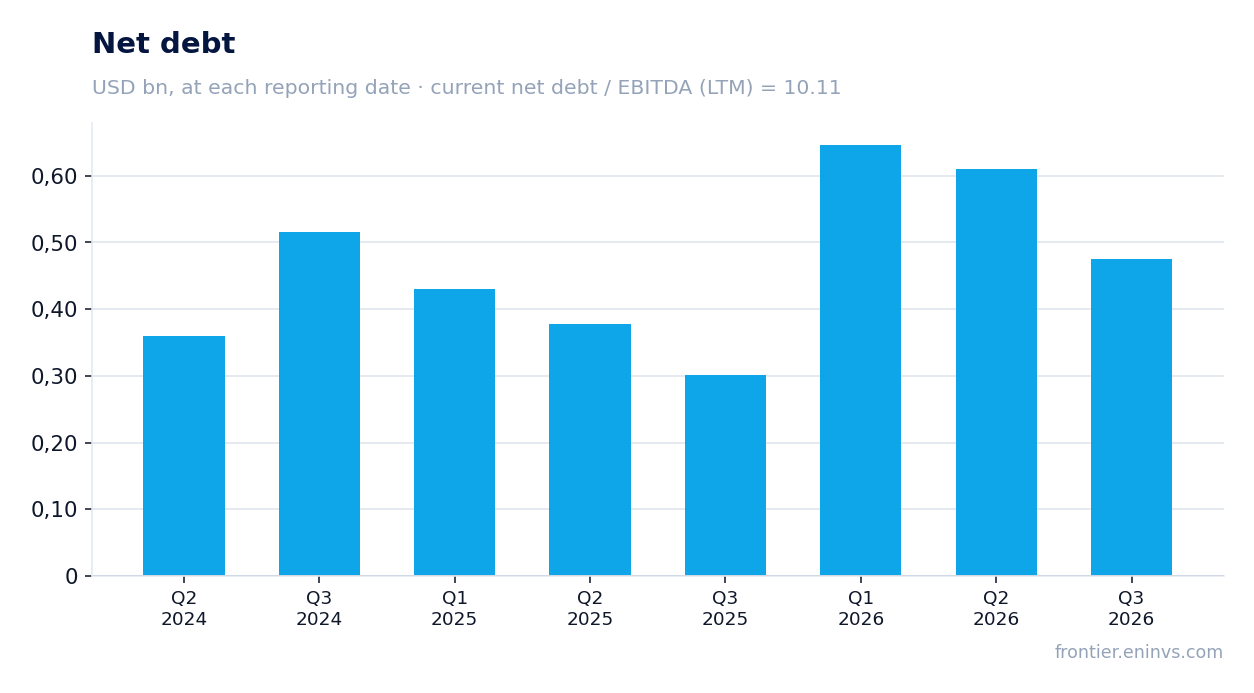
— Net debt of 475.3 million against LTM EBITDA of 47.0 million gives a ratio of 10.11 – a level, not a direction
— Dividend yield of 2.26% with 11.7 million paid in the quarter
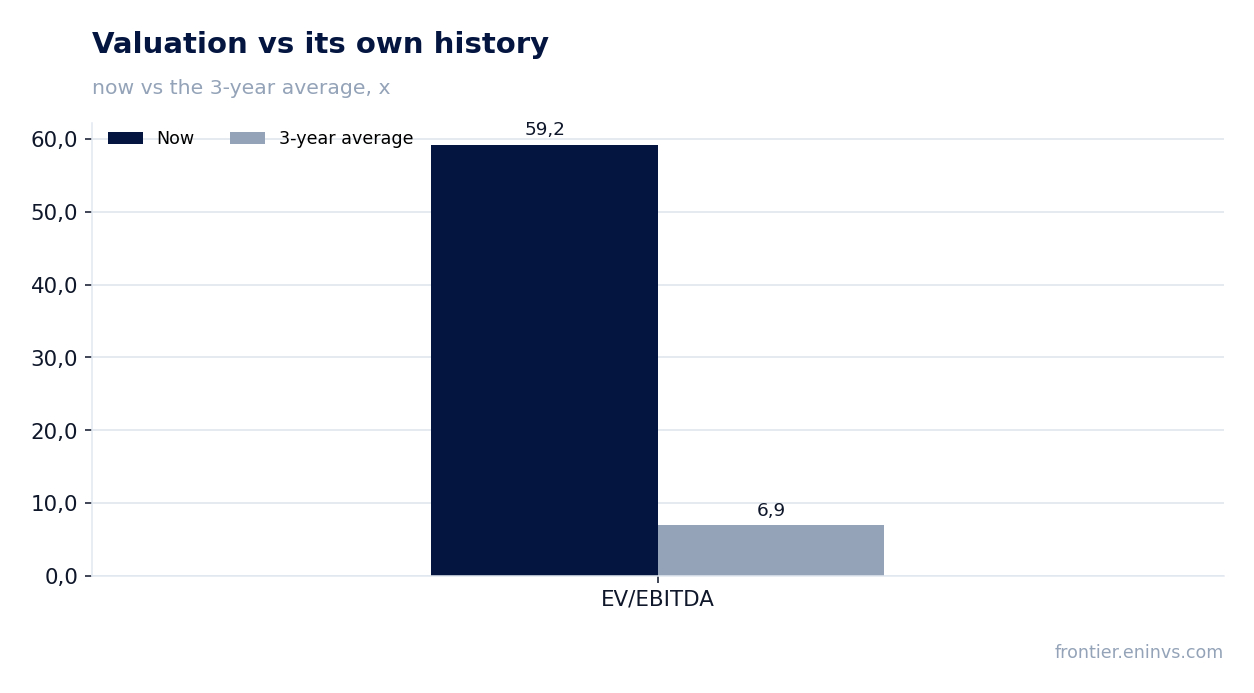
— EV/EBITDA LTM of 59.2 versus a three-year average of 6.9 – the share is 753% above its own history
Attractiveness
Key figures, USD bn
| Metric | Q3 2025 | Q3 2026 | Change |
|---|---|---|---|
| Revenue | 9.39 | 13.3 | +41.3% |
| EBITDA | 0.09 | 0.10 | +17.9% |
| Operating profit | 0.06 | 0.08 | +27.3% |
| Net profit | 0.03 | 0.04 | +47.9% |
| Operating cash flow | 0.12 | 0.18 | +50.9% |
| Capex | 0.01 | 0.01 | -23.4% |
| EBITDA margin | 0.9% | 0.8% | -0.1 pp |
| Net margin | 0.3% | 0.3% | +0.0 pp |
Revenue rose 41.3% year on year, but growth decelerated from 50.3% in the second quarter
Revenue in the third quarter of 2026 was USD 13,270.7 million, 41.3% above the level a year earlier. This is a marked deceleration from the second quarter, when growth reached 50.3%. Aviation and Marine were the main contributors: Aviation revenue rose to USD 7,647.7 million from USD 4,868.1 million, Marine to USD 2,767.3 million from USD 1,988.1 million.
Sales volumes, however, fell 6% to 4,038 million gallons, meaning revenue growth came from prices and mix rather than physical volume. In Aviation volume was almost flat (1,850.3 million gallons versus 1,829.1 million), while Land and Marine volumes declined. This dynamic means the company is selling less fuel at higher prices, which limits the durability of growth.
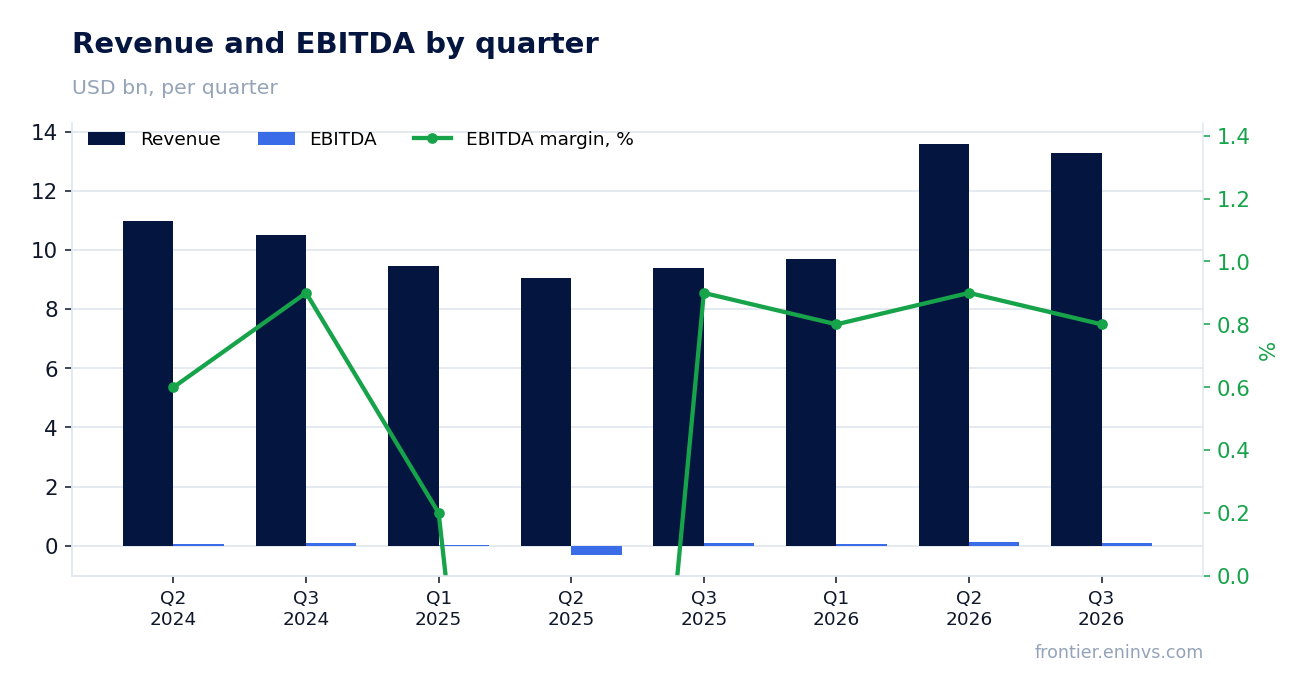
EBITDA margin compressed to 0.8% from 0.9% because revenue grew faster than EBITDA (+17.9%)
EBITDA in the reported quarter was USD 101.9 million, up 17.9% year on year, while revenue grew 41.3%. As a result, the EBITDA margin fell to 0.8% from 0.9% a year earlier. Operating profit rose to USD 80.1 million from USD 62.9 million, but its growth rate (+27%) also lags revenue growth.
The margin compression is explained by the cost structure: cost of revenue grew faster than revenue, and operating expenses rose 11% to USD 208.0 million. Within operating expenses, compensation and benefits fell to USD 107.0 million, but general and administrative expenses rose to USD 101.6 million from USD 69.5 million. The rise in administrative expenses is partly linked to the acquisition of Universal Trip Support Services, closed in the fourth quarter of 2025.
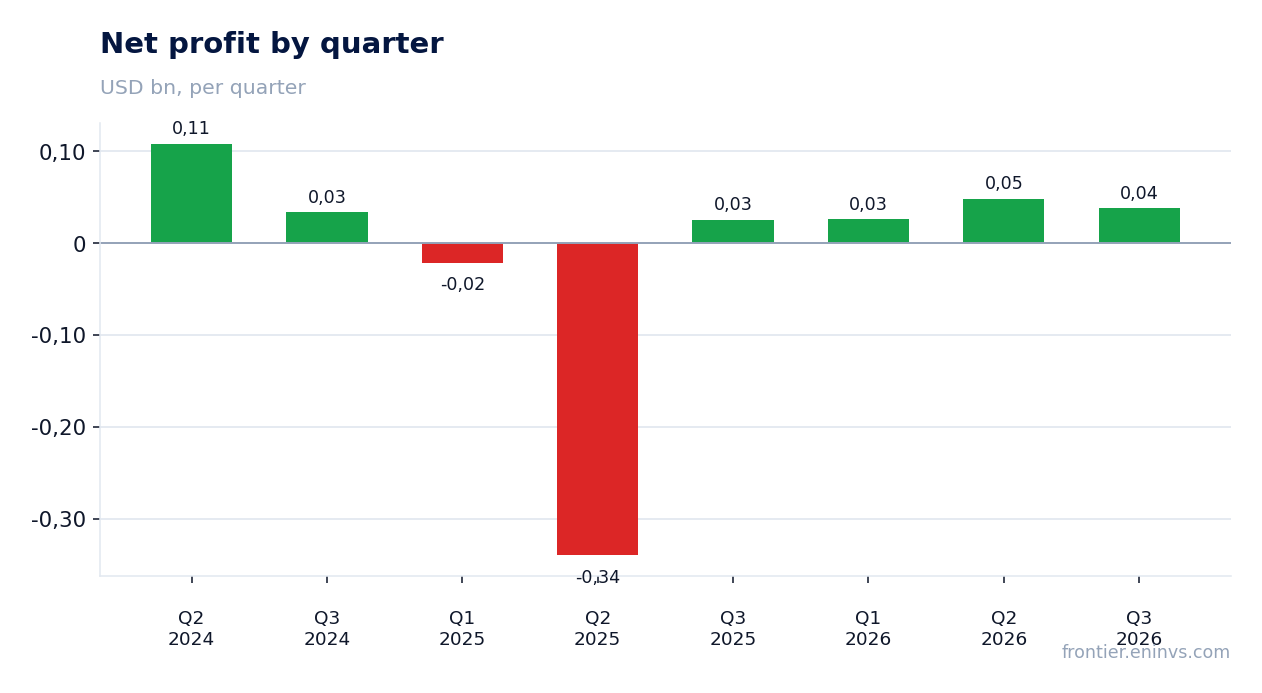
One-off items added to profit: adjusted EBITDA of 127.1 million versus GAAP 101.9 million
Adjusted EBITDA was USD 127.1 million versus USD 101.9 million under GAAP. The USD 25.2 million difference includes USD 23.2 million for a credit-loss provision on exits from non-core businesses, USD 1.3 million of integration costs and USD 0.8 million of Finnish bid error costs. Adjusted profit also includes the removal of non-cash items such as a USD 4.3 million gain on the sale of a business.
Adjusted net profit was USD 50.8 million, or USD 0.99 per share, versus GAAP USD 38.0 million and USD 0.70 per share. The gap between GAAP and adjusted profit means a significant part of the profit improvement is tied to one-off items rather than operations. For assessing business durability, the dynamics of GAAP figures matter more, and they show more modest growth.
Free cash flow of 164.4 million on operating cash flow of 175.2 million and capex of 10.8 million
Operating cash flow in the third quarter was USD 175.2 million, capital expenditure USD 10.8 million and free cash flow USD 164.4 million. This is a strong result against USD 116.1 million of operating flow a year earlier. The main inflow came from a USD 511.1 million increase in accounts payable, which partly financed a USD 243.2 million rise in receivables and a USD 163.6 million rise in inventories.
This cash-flow profile means the company is funding working capital through suppliers rather than its own cash. If revenue growth slows, this source may dry up and cash flow would return to a more modest level. Capex remains low at USD 10.8 million for the quarter, below USD 14.1 million a year earlier, which supports free flow but does not build a base for future growth.
Net debt of 475.3 million against LTM EBITDA of 47.0 million gives a ratio of 10.11 – a level, not a direction
Net debt at 30 September 2026 was USD 475.3 million. Compared with 30 June 2026 it fell from USD 610.8 million to USD 475.3 million, while over the year it rose from USD 301.6 million at 30 September 2025. The ratio of net debt to LTM EBITDA is 10.11. This is a high level reflecting a weak LTM EBITDA base (USD 47.0 million) due to the loss in the second quarter of 2025.
Interest expense for the quarter was USD 30.8 million versus USD 25.9 million a year earlier. With quarterly EBITDA of USD 101.9 million, interest consumes about 30% of operating profit. The high debt-to-EBITDA ratio limits financial flexibility and increases vulnerability to rising rates. The USD 135.5 million reduction in debt over the quarter is partly linked to strong cash flow, but the durability of this reduction depends on the repeatability of such flow.
Dividend yield of 2.26% with 11.7 million paid in the quarter
In the third quarter of 2026 the company paid dividends of USD 11.7 million. The trailing twelve-month dividend yield is 2.26%. With a market capitalisation of USD 2,124.2 million, annual payments are about USD 48 million. This is a moderate payout level that the company can sustain at current cash flow.
However, the dividend is not the main attraction: a 2.26% yield is below the yield on risk-free instruments and does not compensate for the risks of high debt and margin compression. The company also repurchased USD 89.3 million of shares in the first nine months of 2026, which together with dividends amounts to about USD 122 million of capital returned. With free cash flow of USD 69.1 million over nine months, payouts exceed the flow, which is funded through debt or cash balances.
EV/EBITDA LTM of 59.2 versus a three-year average of 6.9 – the share is 753% above its own history
EV/EBITDA LTM is 59.2 versus a three-year average of 6.9. This is 753% above the company's own history. The gap is explained by the low LTM EBITDA base (USD 47.0 million), which is distorted by the loss in the second quarter of 2025. At present the multiple does not reflect the company's operating profitability and makes the share expensive relative to its historical levels.
On the portal's model, which factors in EBITDA growth and a target multiple, the upside of the share to fair value is +7%. This is a modest upside that does not compensate for the risks of high debt and margin compression. For comparison, at the current price the share trades well above its historical valuation, which limits its appeal to an investor.
Valuation on the latest reported figures
| Metric | Value |
|---|---|
| Market cap | 2.12 bn USD |
| EV/EBITDA (LTM) | 59.2 |
| P/B | 1.62 |
| Net debt / EBITDA (LTM) | 10.11 |
| Operating cash flow (LTM) | 0.14 bn |
| ROE | 12.0% |
| Dividend yield (12m) | 2.3% |
| EV/EBITDA, 3-year average | 6.9 |
Bottom line
The strong points of the report were free cash flow of USD 164.4 million and revenue growth of 41.3%, but these achievements are partly supported by one-off items and growth in accounts payable. The EBITDA margin compressed to 0.8%, and the net debt to LTM EBITDA ratio of 10.11 remains high. The share trades at EV/EBITDA LTM of 59.2 versus a three-year average of 6.9, making it expensive relative to its own history. The verdict is unattractive: revenue growth is not converting into margin, and the multiple leaves no room for error.
Open the company's financial profile WKC →
See also: market overview · valuation map · stock screeners