UZ_TRUST: revenue accelerated to +48.3%, but profit lagged – margin compressed by 6.7 pp

In its Q3 2026 report, UZ_TRUST posted revenue of 817,027.3 mn UZS, operating profit of 316,512.6 mn UZS and net profit of 262,964.1 mn UZS. Revenue grew 48.3% year on year – faster than the prior quarter (+29.0%) – but net profit added only 22.6%, and the net margin fell to 32.2% from 38.9% a year earlier. At a P/E LTM of 11.8 and a dividend yield of 6.1%, the share looks rather attractive, but the margin compression is the main counterargument.
Key takeaways
— Revenue accelerated to +48.3% year on year, but profit grew only 22.6% – the margin did not hold
— Net margin fell to 32.2% from 38.9%, and the entire revenue gain went into costs
— Operating profit of 316,512.6 mn UZS on revenue of 817,027.3 mn UZS implies an operating margin of 38.7%
— Over the trailing twelve months, net profit was 1,015,063.9 mn UZS on revenue of 1,545,400.0 mn UZS
— A 6.1% dividend yield against a P/E LTM of 11.8 keeps the payout the main argument for the share
— On the portal's model, the upside to fair value is estimated at +9%
Attractiveness
Key figures, UZS bn
| Metric | Q3 2025 | Q3 2026 | Change |
|---|---|---|---|
| Revenue | 551 | 817 | +48.3% |
| Operating profit | — | 317 | — |
| Net profit | 215 | 263 | +22.6% |
| Net margin | 38.9% | 32.2% | -6.7 pp |
Revenue accelerated to +48.3% year on year, but profit grew only 22.6% – the margin did not hold
In Q3 2026, revenue was 817,027.3 mn UZS, up 48.3% year on year. That is markedly faster than in Q2 2026, when growth was 29.0%: the acceleration is confirmed by comparing the two reported quarters.
Net profit for the same quarter was 262,964.1 mn UZS, up only 22.6% year on year. The gap between revenue and profit dynamics means costs grew faster than income, and that is the central fact of the report.
For a holder, what matters more than revenue growth itself is that it no longer converts into profit with the same force. Accelerating revenue alongside decelerating profit signals either price cuts or extra costs, the nature of which the report does not disclose.
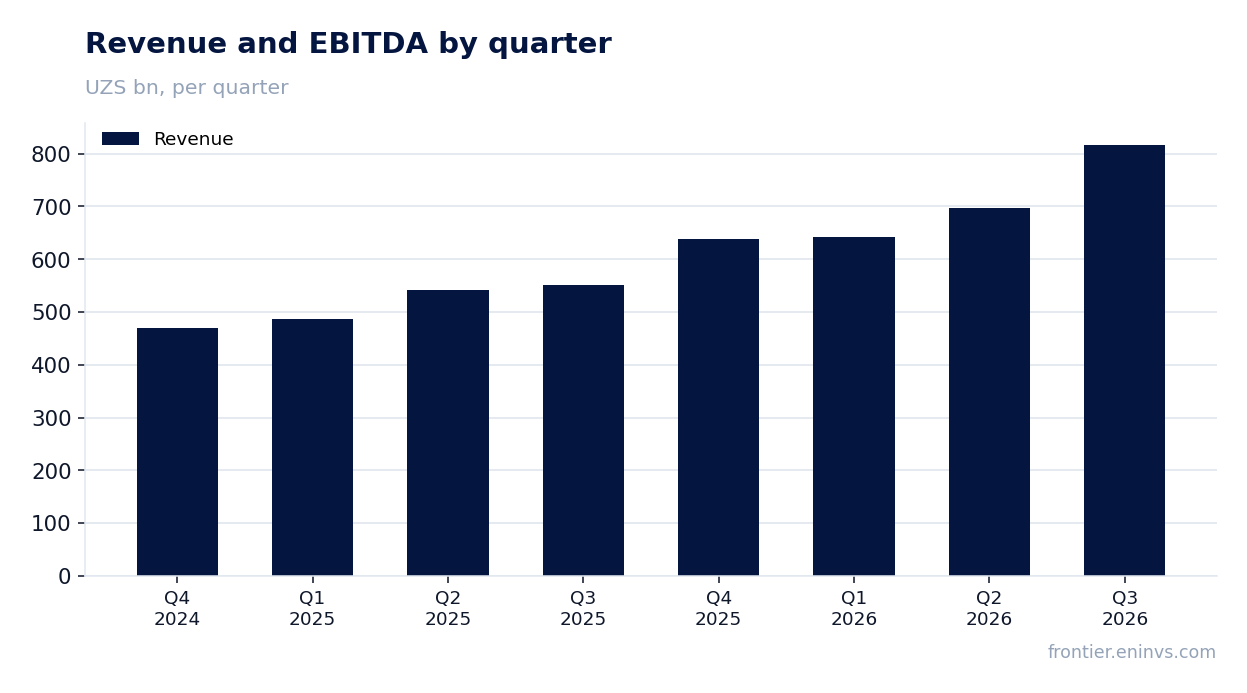
Net margin fell to 32.2% from 38.9%, and the entire revenue gain went into costs
The net margin in Q3 2026 was 32.2% against 38.9% a year earlier. A 6.7 percentage point compression is the price of the revenue acceleration.
With revenue of 817,027.3 mn UZS and net profit of 262,964.1 mn UZS, each percentage point of margin is worth about 8.2 bn UZS of profit. Losing 6.7 pp means that at last year's margin, profit would have been materially higher than reported.
The report gives no cost-line breakdown, so the specific cause of the compression cannot be named. All that is visible is that operating profit of 316,512.6 mn UZS on revenue of 817,027.3 mn UZS implies a 38.7% operating margin – pressure on profit therefore arises below the operating line or in operating costs the report does not separately disclose.
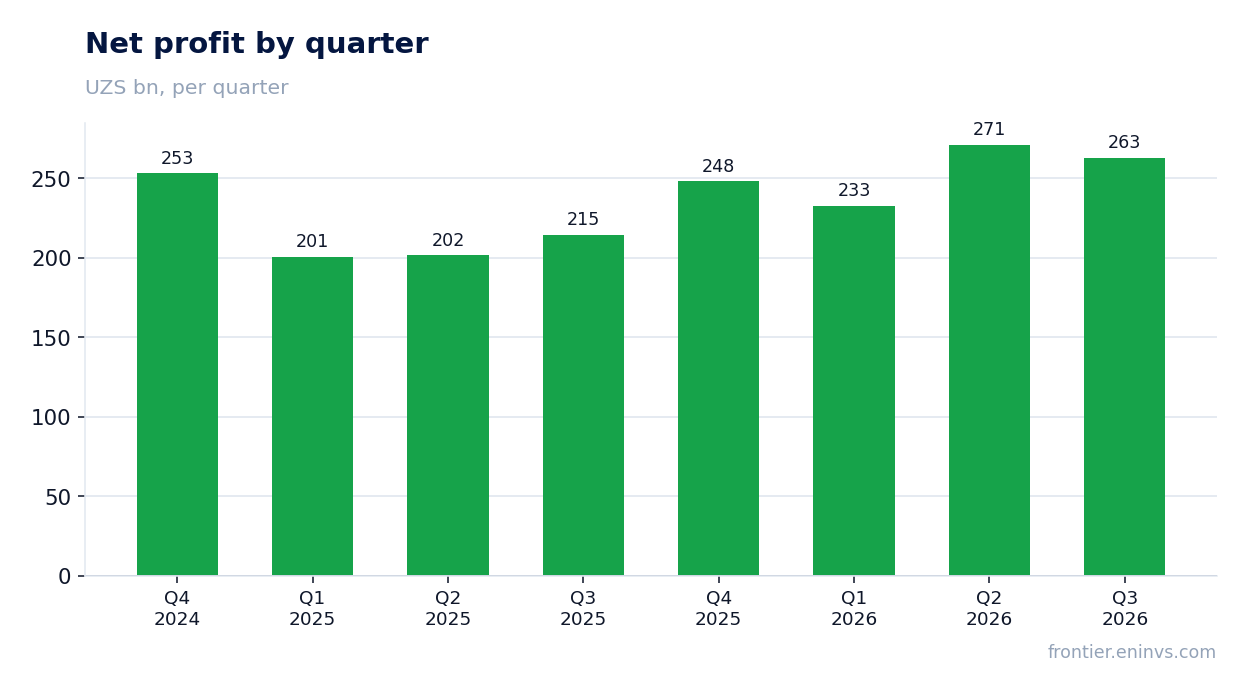
Operating profit of 316,512.6 mn UZS on revenue of 817,027.3 mn UZS implies an operating margin of 38.7%
Operating profit in Q3 2026 was 316,512.6 mn UZS. That is 11.1% more than in Q2 2026 (289,154.0 mn UZS), but operating profit growth quarter on quarter is more modest than revenue growth over the same period.
The 38.7% operating margin sits 6.5 pp above the net margin. The gap between operating and net profit (53,548.5 mn UZS) is interest, taxes and other items below the operating line.
For assessing business resilience, the operating margin matters more than the net one: it is not distorted by one-off items below the operating line. At 38.7%, it shows the core business remains highly profitable, and the net margin compression occurs at the level of financial and tax items.
Over the trailing twelve months, net profit was 1,015,063.9 mn UZS on revenue of 1,545,400.0 mn UZS
The trailing twelve months give a steadier picture than a single quarter: revenue of 1,545,400.0 mn UZS and net profit of 1,015,063.9 mn UZS. The net margin over that period is 65.7%, above the quarterly 32.2%.
The gap between the LTM margin and the quarterly one reflects a higher profit share in revenue in earlier quarters. This confirms the margin compression is a recent phenomenon rather than a stable feature of the business.
The P/E of 11.8 rests on LTM profit. If the quarterly margin compression persists, annual profit will come in below the LTM figure, and the forward multiple will be above 11.8.
A 6.1% dividend yield against a P/E LTM of 11.8 keeps the payout the main argument for the share
The trailing twelve-month dividend yield is 6.1%. Against a market capitalisation of 12,000,759.5 mn UZS, that corresponds to payouts of about 728.5 bn UZS, or roughly 72% of LTM profit of 1,015,063.9 mn UZS.
Our estimate for the current year's dividend assumes the payout ratio stays near 72% and profit stays close to the LTM level. On that base, the payout will remain within 6% of the current price. The main risk to it is further margin compression: if the 32.2% quarterly margin becomes the norm, annual profit will fall below LTM and the dividend will shrink proportionally.
A 6.1% yield is comparable to the risk-free rate but offers little premium over it. For a share with rising revenue and a compressing margin, that is not enough to offset the uncertainty around profit.
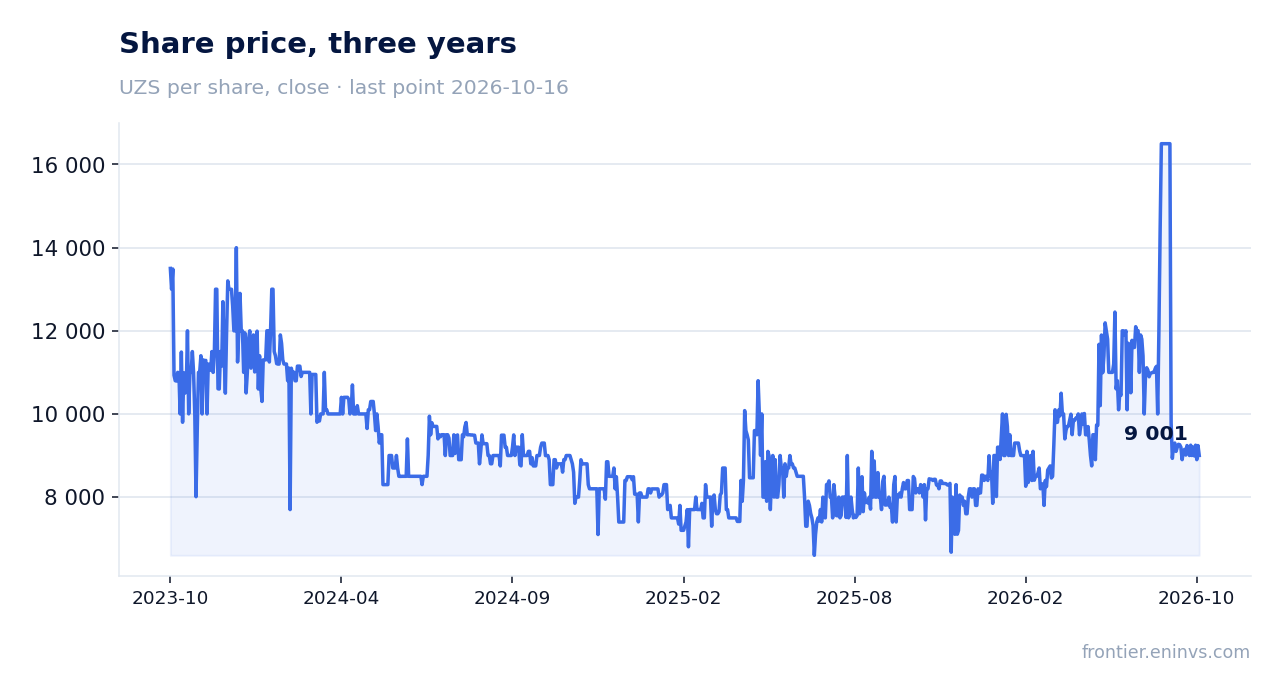
On the portal's model, the upside to fair value is estimated at +9%
On the portal's model, which compares ROE of 8.6% with P/B, the upside to fair value is estimated at +9%. This is the portal's own estimate, not a market consensus or a target price.
A P/E LTM of 11.8 against an ROE of 8.6% means the market pays a moderate price for earnings, but the return on capital is also low. A low ROE combined with a modest multiple leaves little room for re-rating without profit growth.
The +9% upside is moderate. It materialises if profit holds at the LTM level; with the margin compression seen in Q3, fair value on the model would be lower.
Valuation on the latest reported figures
| Metric | Value |
|---|---|
| Market cap | 12 001 bn UZS |
| P/E (LTM) | 11.8 |
| P/B | 4.11 |
| ROE | 8.6% |
| Dividend yield (12m) | 6.1% |
Bottom line
The report's strength remains revenue: acceleration to +48.3% year on year and a 38.7% operating margin show the core business is growing and highly profitable. The weakness is the conversion of that growth into profit: the net margin fell to 32.2% from 38.9%, and profit grew only 22.6%. A 6.1% dividend yield and a P/E of 11.8 against a +9% upside on the portal's model support the valuation but do not outweigh the risk of further margin compression. The verdict is rather attractive: the share is inexpensive and pays a dividend, but an upgrade needs a margin reversal, while a downgrade needs only the margin to stay at the quarterly level.
Open the company's financial profile TRUST →
See also: market overview · valuation map · stock screeners