Advantage Energy: revenue fell 4% while EBITDA doubled – a 106.6% margin that production did not produce
Advantage Energy reported a 4% year-on-year decline in third-quarter 2026 revenue to $103.4m, while EBITDA rose 109.5% to $110.2m and the margin reached 106.6% against 48.8% a year earlier. Net profit was $40.2m at a 38.9% margin, net debt fell to $139.2m, and the trailing-twelve-month EV/EBITDA of 6.2 sits against the company's own three-year average of 7.8. The share trades below its own history, but the gap between revenue and EBITDA makes the quarterly result an unreliable base for valuation – the stock looks rather attractive only if the next report confirms the margin is sustainable.
Key takeaways
— Third-quarter revenue fell 4.0% year on year after 23.5% growth in the second – a deceleration, not a reversal
— EBITDA rose 109.5% on falling revenue, and a 106.6% margin means the profit did not come from sales
— Net profit of $40.2m at a 38.9% margin – the quarter rests on a line below operating profit
— Net debt fell from $0.6bn on 30 June to $0.1bn on 30 September, with net debt/EBITDA LTM at 0.46
— EV/EBITDA LTM of 6.2 against the company's own three-year average of 7.8 – the share is 21% cheaper than its history
— On the portal's model, re-pricing EBITDA at current commodity prices implies 20% downside to fair value
Attractiveness
Key figures, USD bn
| Metric | Q3 2025 | Q3 2026 | Change |
|---|---|---|---|
| Revenue | 0.11 | 0.10 | -4.0% |
| EBITDA | 0.05 | 0.11 | +109.5% |
| Operating profit | 0.01 | 0.06 | +416.8% |
| Net profit | — | 0.04 | — |
| Operating cash flow | 0.06 | 0.07 | +20.3% |
| EBITDA margin | 48.8% | 106.6% | +57.8 pp |
| Net margin | — | 38.9% | — |
Third-quarter revenue fell 4.0% year on year after 23.5% growth in the second – a deceleration, not a reversal
Third-quarter 2026 revenue was $103.4m, 4.0% below a year earlier. In the second quarter the same measure grew 23.5%, so the quarter-on-quarter trend flipped from growth to decline: $146.99m in the second quarter against $103.38m in the third.
The first quarter of 2026 was also weak at minus 2.4% year on year, so the third quarter extends the line rather than breaking it. Within the year revenue is uneven: $150.4m in the first quarter, $147.0m in the second and $103.4m in the third.
What matters for valuation is not the 4% decline itself but that it comes with rising EBITDA. That divergence means the quarter's profit is not formed by sales volume, and the next report must show whether revenue holds at this level.
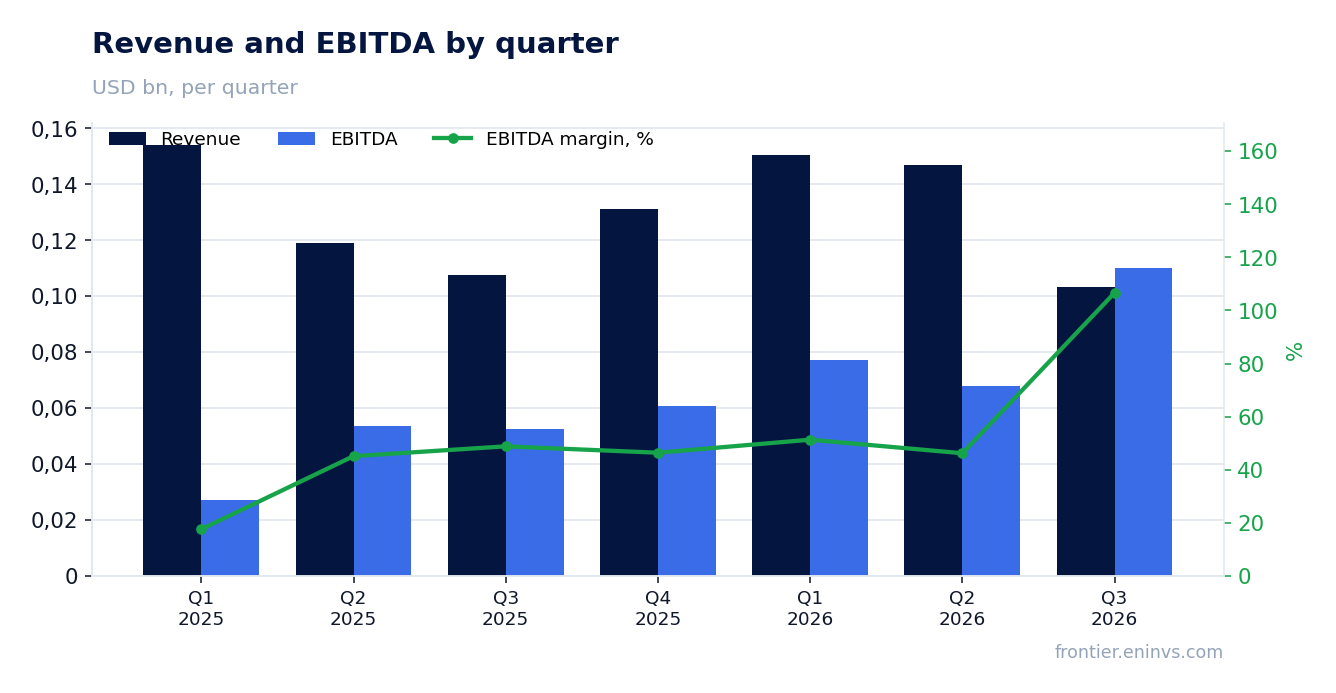
EBITDA rose 109.5% on falling revenue, and a 106.6% margin means the profit did not come from sales
Third-quarter 2026 EBITDA was $110.2m against $52.6m a year earlier, up 109.5%. On revenue of $103.4m that gives a 106.6% margin against 48.8% in the third quarter of 2025.
A margin above 100% means EBITDA exceeds revenue. That cannot result from ordinary operations: it requires a line that lifts the result beyond sales, and the quarterly report does not disclose its nature.
Operating profit was $63.8m, well below EBITDA, so roughly $46m of costs – mainly depreciation – sit between the two lines. For an investor this means the cash part of the quarter's result is materially smaller than EBITDA suggests.

Net profit of $40.2m at a 38.9% margin – the quarter rests on a line below operating profit
Third-quarter 2026 net profit was $40.2m at a 38.9% margin. That is below operating profit of $63.8m, so about $23.7m went below the operating line – to interest, taxes and other items.
Over the trailing twelve months net profit was $37.9m on revenue of $504.7m and EBITDA of $302.9m. The quarterly $40.2m is therefore almost equal to the full year: one quarter delivered more than the whole preceding year.
This points directly to the one-off nature of the quarterly profit. The sustainable base for valuation is the annual one, not the quarterly: $37.9m over twelve months against a market capitalisation of $1,307.6m gives a P/E LTM of 34.5, and that level, not the quarterly one, should underpin the calculation.
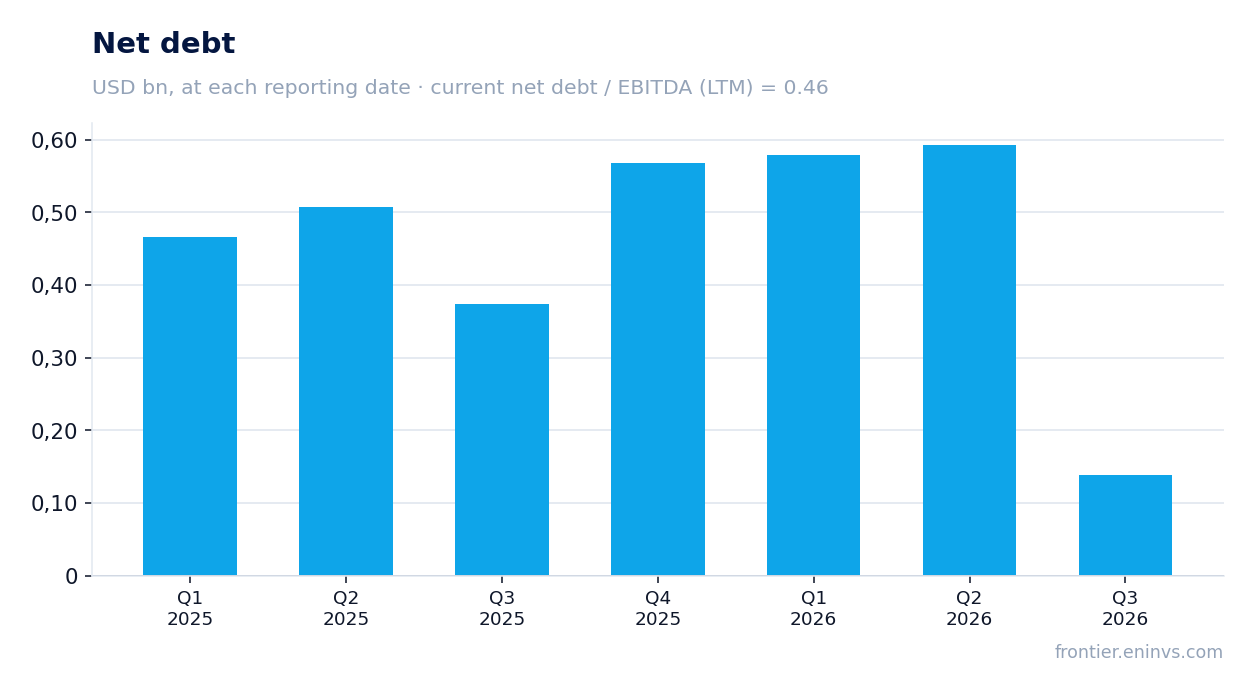
Net debt fell from $0.6bn on 30 June to $0.1bn on 30 September, with net debt/EBITDA LTM at 0.46
Net debt on 30 September 2026 was $139.2m. From 30 June it fell from $0.6bn to $0.1bn – a $0.5bn reduction in the quarter; over the year, from 30 September 2025, the decline was $0.2bn, from $0.4bn to $0.1bn.
Net debt to trailing-twelve-month EBITDA is 0.46. That is a low level: debt is less than half of annual EBITDA and creates no pressure on the income statement through interest.
Operating cash flow was $69.9m in the third quarter and $283.7m over twelve months. The quarterly inflow is below EBITDA of $110.2m, consistent with the gap between EBITDA and operating profit: part of the result does not turn into cash in the same quarter.
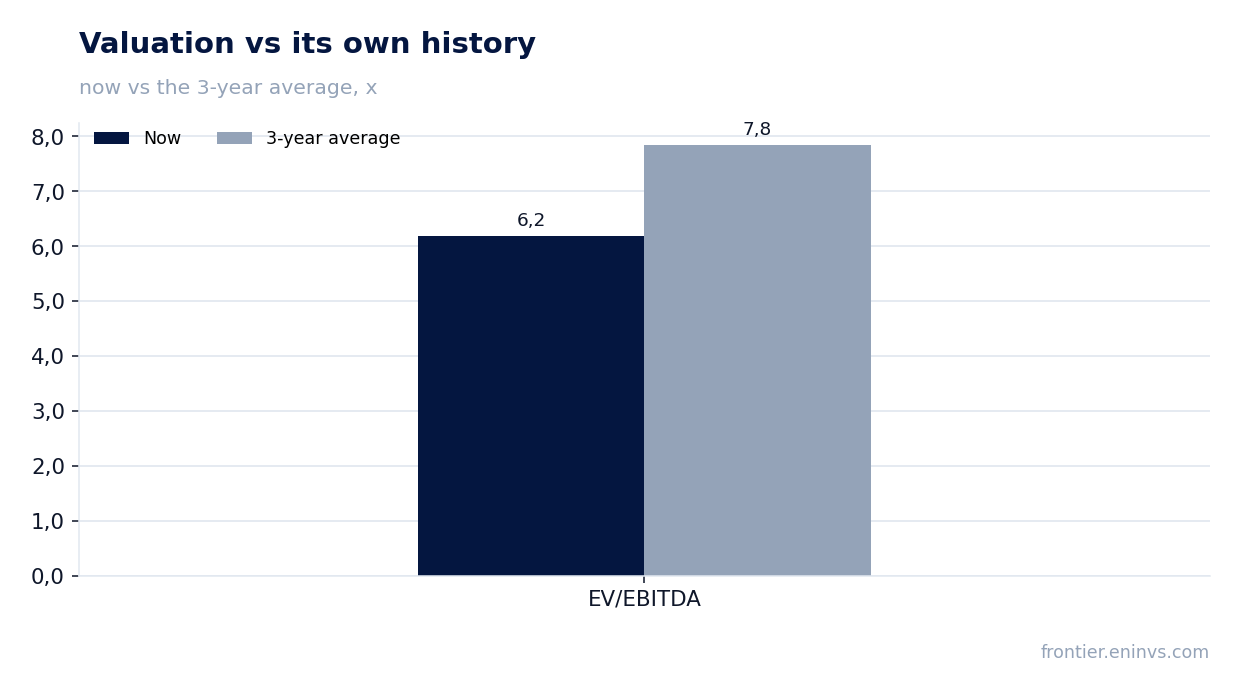
EV/EBITDA LTM of 6.2 against the company's own three-year average of 7.8 – the share is 21% cheaper than its history
Trailing-twelve-month EV/EBITDA is 6.2 against the company's own three-year average of 7.8 for this multiple. The share trades 21% below its history, and this is the only valid comparison: no external industry benchmarks are in our data.
P/E LTM is 34.5 on trailing-twelve-month net profit of $37.9m and a market capitalisation of $1,307.6m. Return on equity is 12.9%, which at this P/E means earnings are richly valued relative to their current level.
The gap between the two multiples reflects the structure of the result: trailing EBITDA of $302.9m is large against profit of $37.9m because of depreciation and lines below operating profit. EV/EBITDA looks at the cash base, P/E at residual earnings, and the latter currently looks expensive.
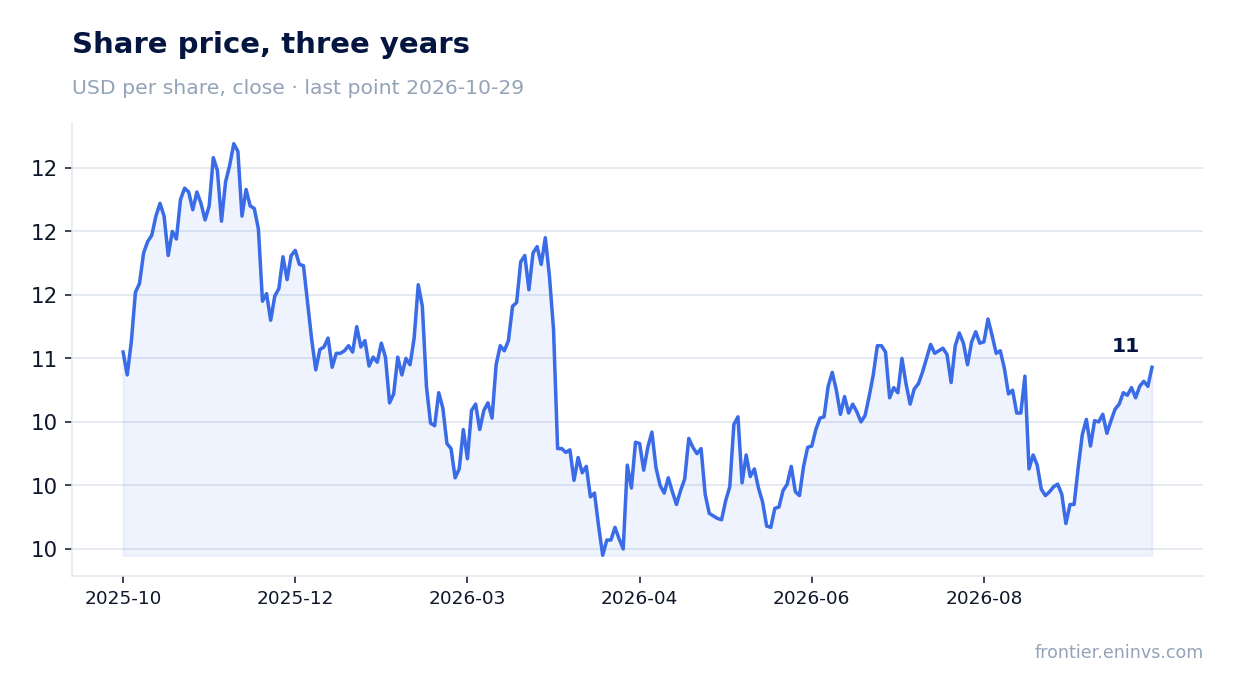
On the portal's model, re-pricing EBITDA at current commodity prices implies 20% downside to fair value
Our own model re-prices EBITDA at current commodity prices and values it at a target EV/EBITDA. On that basis fair value comes out 20% below the current market price – this is the portal's model output, not a market consensus and not a target price.
The reason it diverges from the historical multiple is that the trailing base includes a quarter with a 106.6% margin. If that quarter's EBITDA was one-off, the annual base is overstated and the current 6.2 multiple looks lower than it really is.
The model and the history comparison point in opposite directions: on the multiple the share is cheaper than itself, on the cash-flow re-pricing it is dearer. Only the next report, showing sustainable EBITDA without one-offs, can resolve that.
Valuation on the latest reported figures
| Metric | Value |
|---|---|
| Market cap | 1.31 bn USD |
| P/E (LTM) | 34.5 |
| EV/EBITDA (LTM) | 6.2 |
| P/B | 1.06 |
| Net debt / EBITDA (LTM) | 0.46 |
| Operating cash flow (LTM) | 0.28 bn |
| ROE | 12.9% |
| EV/EBITDA, 3-year average | 7.8 |
Bottom line
The balance sheet remains the strong side: net debt fell from $0.6bn on 30 June to $0.1bn on 30 September, with net debt/EBITDA LTM at 0.46. But profit of $40.2m and EBITDA of $110.2m on revenue of $103.4m almost certainly contain a one-off component, and trailing net profit of $37.9m confirms it. EV/EBITDA of 6.2 against a three-year average of 7.8 argues cheapness, yet the portal's model implies 20% downside to fair value and P/E LTM of 34.5 is expensive. The question for a holder now is not debt but whether the 106.6% margin repeats – until the next report the share deserves a cautious rather than a confident view.
Open the company's financial profile AAV →
See also: market overview · valuation map · stock screeners