Aker BP: revenue accelerated to +49%, but the 110.3% EBITDA margin rests on one-offs
Aker BP reported third-quarter 2026 results: revenue of USD 3,872.0 mn (+49.0% YoY), EBITDA of USD 4,272.5 mn (+104.5%) and net profit of USD 986.4 mn (+245.5%). Growth accelerated from +42.0% in the second quarter, but EBITDA exceeded revenue and operating profit came in USD 495.0 mn below EBITDA – a sign of one-off items in the report rather than sustainable operating momentum. With EV/EBITDA at 2.6 versus its own three-year average of 2.1 and a –34% fair-value gap on the portal's model, the share looks rather unattractive at the current level.
Key takeaways
— Revenue grew 49.0% YoY, accelerating from 42.0% in the second quarter
— EBITDA of USD 4,272.5 mn exceeded revenue, while operating profit lagged it by USD 495.0 mn
— Net profit of USD 986.4 mn rose 3.5x, but the 25.5% net margin is half the EBITDA margin
— Leverage at 0.5x LTM EBITDA is low, but net debt itself rose from USD 5.3 bn to 6.1 bn over the year
— The 4.9% dividend yield rests on LTM profit of USD 2,119.9 mn
— EV/EBITDA of 2.6 is 22% above its own three-year average of 2.1
— The portal's model puts fair value 34% below the market
Attractiveness
Key figures, USD bn
| Metric | Q3 2025 | Q3 2026 | Change |
|---|---|---|---|
| Revenue | 2.60 | 3.87 | +49.0% |
| EBITDA | 2.09 | 4.27 | +104.5% |
| Operating profit | 1.47 | 3.78 | +156.1% |
| Net profit | 0.29 | 0.99 | +245.5% |
| Operating cash flow | 2.02 | 2.43 | +20.3% |
| EBITDA margin | 80.4% | 110.3% | +29.9 pp |
| Net margin | 11.0% | 25.5% | +14.5 pp |
Revenue grew 49.0% YoY, accelerating from 42.0% in the second quarter
In the third quarter of 2026 Aker BP's revenue reached USD 3,872.0 mn, up 49.0% year on year. Growth was 42.0% in the second quarter, so the pace accelerated. This is the second consecutive quarter of double-digit growth after a 4.9% decline in the first quarter.
The acceleration rests on a low base: third-quarter 2025 revenue was USD 2,598.5 mn. The sequential rise from USD 3,597.5 mn in the second quarter of 2026 is also visible, but the year-on-year rate looks more impressive precisely because of the weak year-ago quarter.
The facts do not disclose whether volumes, prices or the exchange rate drove the increase. What is clear is that the company sold noticeably more than a year ago, and this is the best quarterly result in the available series.
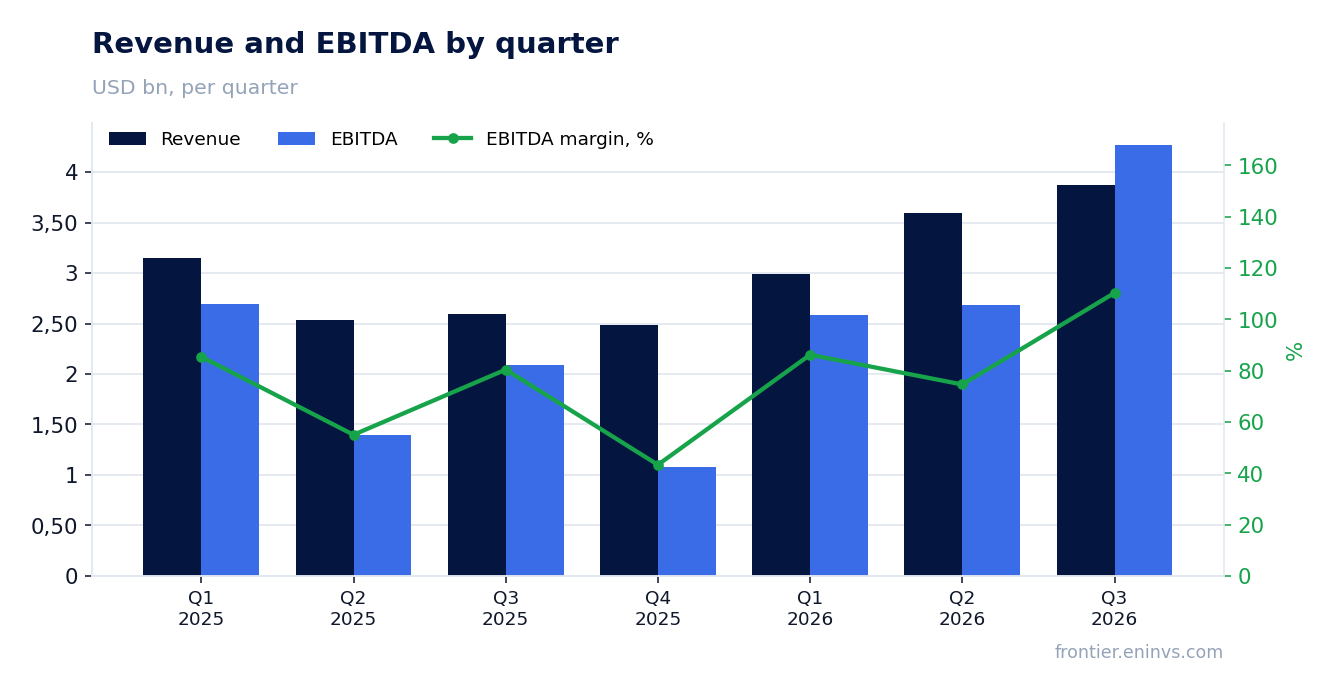
EBITDA of USD 4,272.5 mn exceeded revenue, while operating profit lagged it by USD 495.0 mn
Third-quarter EBITDA was USD 4,272.5 mn – more than revenue of USD 3,872.0 mn. Such a ratio is only possible with large non-cash or one-off items above operating profit that the company adds back to EBITDA.
Operating profit was USD 3,777.5 mn, i.e. USD 495.0 mn below EBITDA. The gap between them is depreciation and, given the scale, one-off write-offs or revaluations that the facts do not break out.
The 110.3% EBITDA margin versus 80.4% a year earlier looks like an improvement, but with revenue below EBITDA it reflects the structure of the report rather than rising efficiency. Operating profit is the safer basis for judging sustainable profitability.
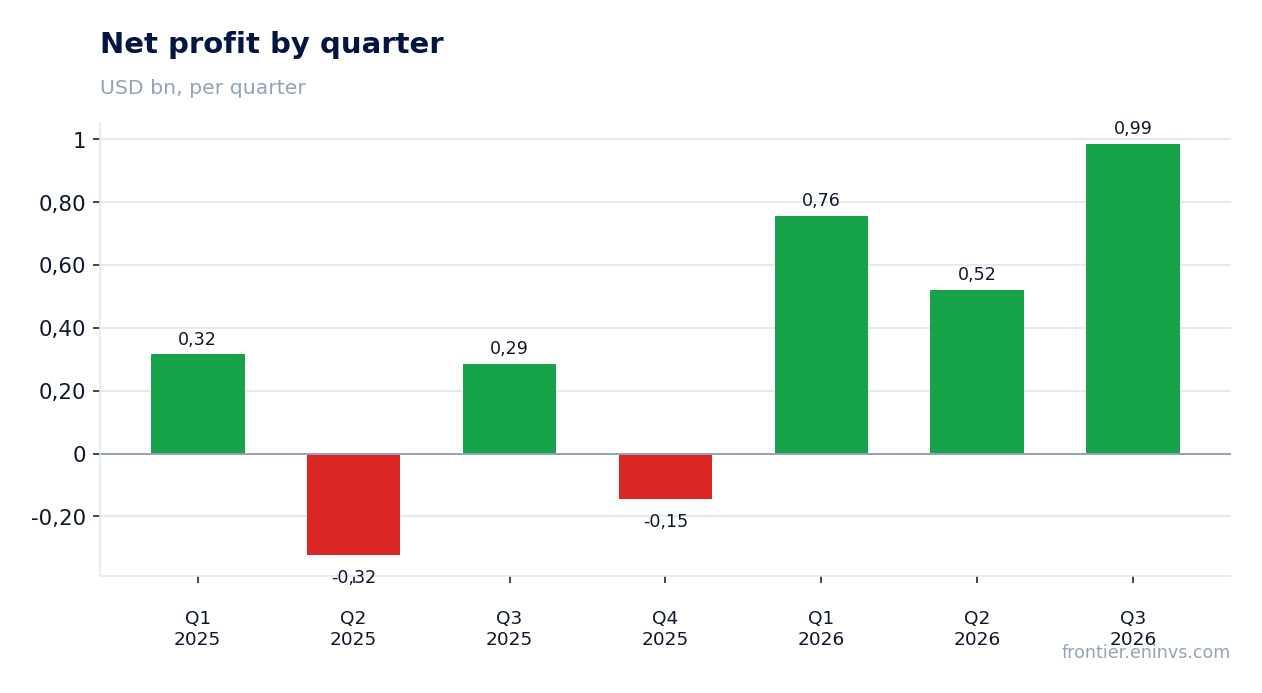
Net profit of USD 986.4 mn rose 3.5x, but the 25.5% net margin is half the EBITDA margin
Third-quarter net profit was USD 986.4 mn versus USD 285.5 mn a year earlier, up 245.5%. The net margin rose from 11.0% to 25.5%.
Between EBITDA of USD 4,272.5 mn and net profit of USD 986.4 mn sit depreciation, interest and taxes, which absorb about three-quarters of EBITDA. That is a normal structure for an oil and gas company with heavy depreciation, but it shows how far the bottom line is from the operating result.
LTM profit of USD 2,119.9 mn against a market capitalisation of USD 26,052.0 mn gives a P/E of 12.3. That is a moderate valuation, but it rests on profit in which third-quarter one-offs play a visible role.
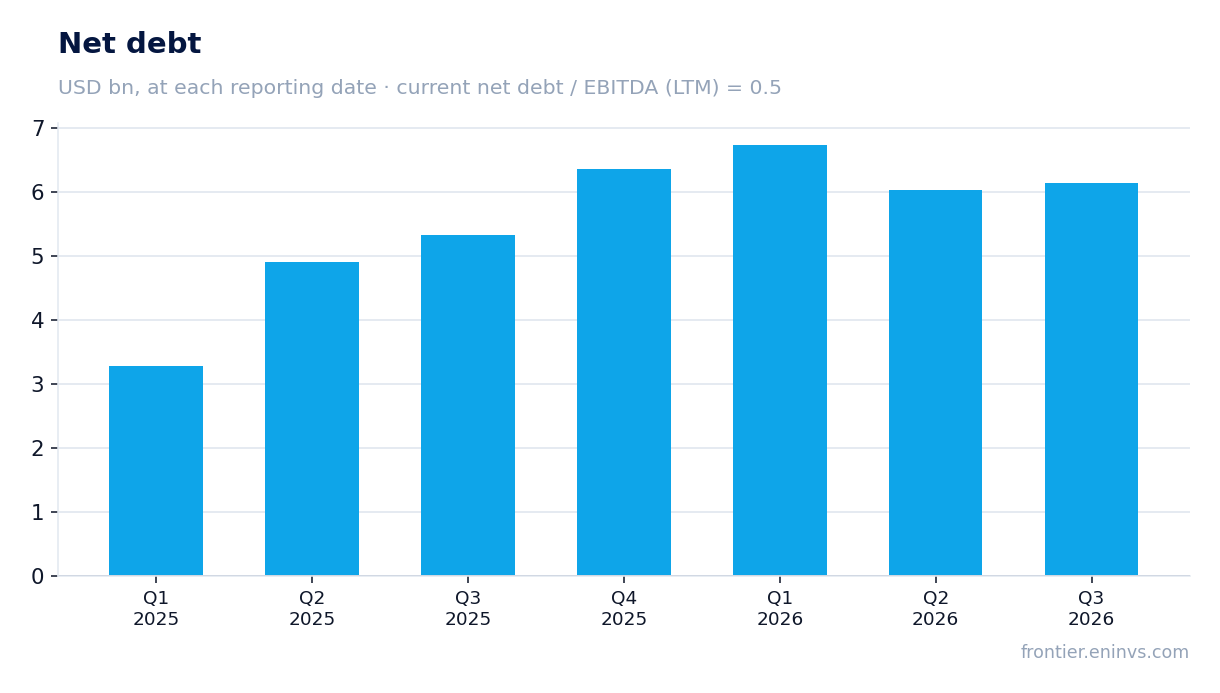
Leverage at 0.5x LTM EBITDA is low, but net debt itself rose from USD 5.3 bn to 6.1 bn over the year
Net debt at 30 September 2026 was USD 6,136.7 mn, or USD 6.1 bn. Against LTM EBITDA of USD 12,367.6 mn that is 0.5x – low leverage for the sector.
Over the quarter net debt rose from USD 6.0 bn on 30 June to USD 6.1 bn on 30 September; over the year, from USD 5.3 bn on 30 September 2025 to USD 6.1 bn. The USD 0.8 bn increase, alongside quarterly operating cash flow of USD 2,432.8 mn, means investment and shareholder payouts exceeded cash generation.
The facts give the debt/EBITDA ratio only at its current level, so no direction of leverage can be inferred. A level of 0.5x does not by itself threaten the dividend, but the USD 0.8 bn rise in net debt over the year is worth watching.
The 4.9% dividend yield rests on LTM profit of USD 2,119.9 mn
The trailing twelve-month dividend yield is 4.9%. Payouts rest on LTM profit of USD 2,119.9 mn and LTM operating cash flow of USD 9,154.6 mn, which cover the dividend.
Our estimate for the 2026 dividend is based on LTM profit and the current yield: if payouts stay at last year's level, the yield will remain around 4.9%. The key condition is holding profit at the LTM level, and in the third quarter it leaned visibly on one-off items.
A 4.9% yield is lower than one might expect from an oil and gas company trading at 2.6x EV/EBITDA. If the third-quarter one-offs do not repeat, profit and hence the dividend base may be smaller, putting the payout under pressure.
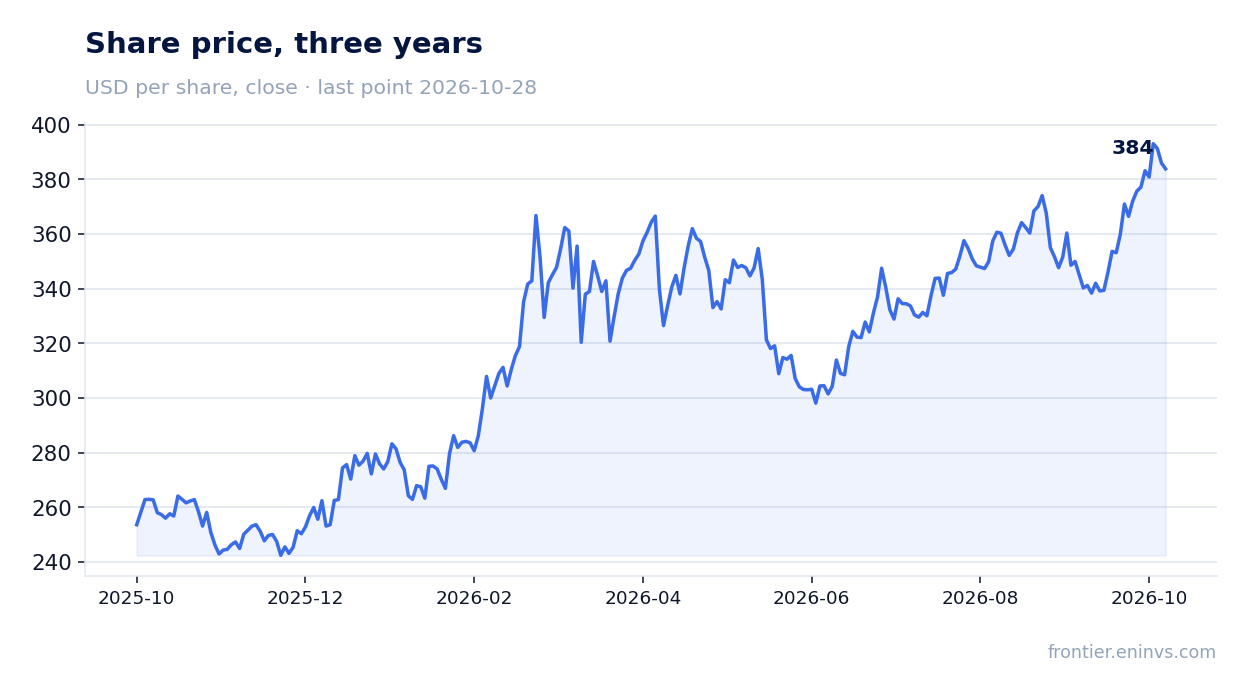
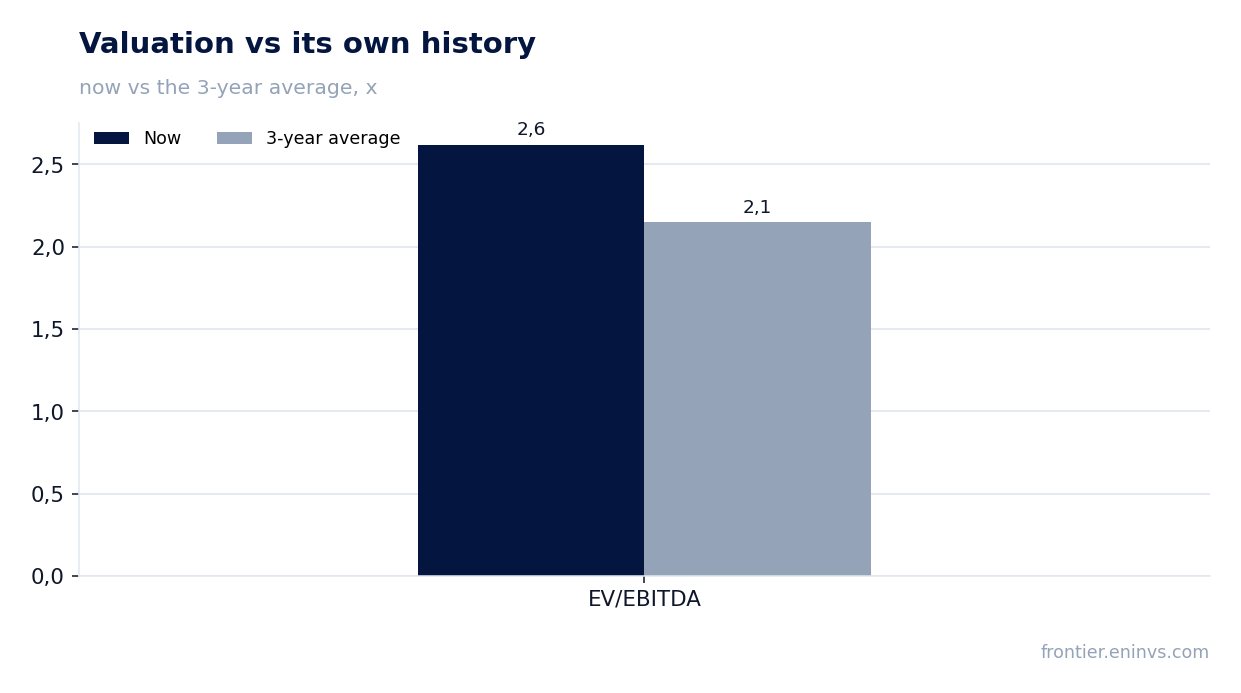
EV/EBITDA of 2.6 is 22% above its own three-year average of 2.1
LTM EV/EBITDA is 2.6 against its own three-year average of 2.1. The share trades 22% above its three-year average – the most direct argument against buying at the current level.
The multiple is low in absolute terms, but for Aker BP it is above its usual range. The reason is that LTM EBITDA of USD 12,367.6 mn includes the third-quarter one-offs, which inflate the denominator and therefore understate the multiple. Without them EV/EBITDA would be higher.
A P/E of 12.3 and ROE of 33.1% look attractive, but ROE rests on the same profit with one-off items. Valuation on earnings and on EBITDA diverge, and that divergence is the main question for the share.
The portal's model puts fair value 34% below the market
On the portal's model, which re-prices EBITDA at current commodity prices at a target EV/EBITDA, fair value is 34% below the market. This is our own estimate, not a market consensus.
The gap arises because the market is paying for EBITDA inflated by third-quarter one-offs. Re-pricing EBITDA at current prices without those items would put the multiple above 2.6, and the discount to fair value would disappear.
The model's estimate is a directional indicator, not a verdict. It says that at current commodity prices the market is pricing in more than the cash flow delivers.
Valuation on the latest reported figures
| Metric | Value |
|---|---|
| Market cap | 26.1 bn USD |
| P/E (LTM) | 12.3 |
| EV/EBITDA (LTM) | 2.6 |
| P/B | 2.32 |
| Net debt / EBITDA (LTM) | 0.50 |
| Operating cash flow (LTM) | 9.15 bn |
| ROE | 33.1% |
| Dividend yield (12m) | 4.9% |
| EV/EBITDA, 3-year average | 2.1 |
Bottom line
The strong side of the report remains revenue: USD 3,872.0 mn and acceleration to +49.0% YoY. But EBITDA of USD 4,272.5 mn exceeded revenue, and operating profit lagged EBITDA by USD 495.0 mn – a visible part of the result is built on one-off items. Leverage at 0.5x LTM EBITDA is low, but net debt itself rose from USD 5.3 bn to 6.1 bn over the year. With EV/EBITDA at 2.6 versus a three-year average of 2.1 and the portal model at –34%, the share looks rather unattractive at the current level.
Open the company's financial profile AKRBP →
See also: market overview · valuation map · stock screeners