Athabasca Oil: revenue up 35.7%, but profit added only 9.6% as margin compressed

On 25 November Athabasca Oil reported results for the third quarter of 2026. Revenue came in at USD 328.2 mn, up 35.7% year on year, operating profit at USD 154.7 mn, and net profit at USD 55.4 mn (+9.6% year on year). Revenue growth accelerated from the second quarter, when it fell 5.4%, but the net margin narrowed to 16.9% from 20.9% a year earlier. At an EV/EBITDA of 11.2 against its own three-year average of 5.4, the share looks more expensive than its history, so the verdict is neutral.
Key takeaways
— Revenue added 35.7% year on year, and growth accelerated after a 5.4% decline in the second quarter
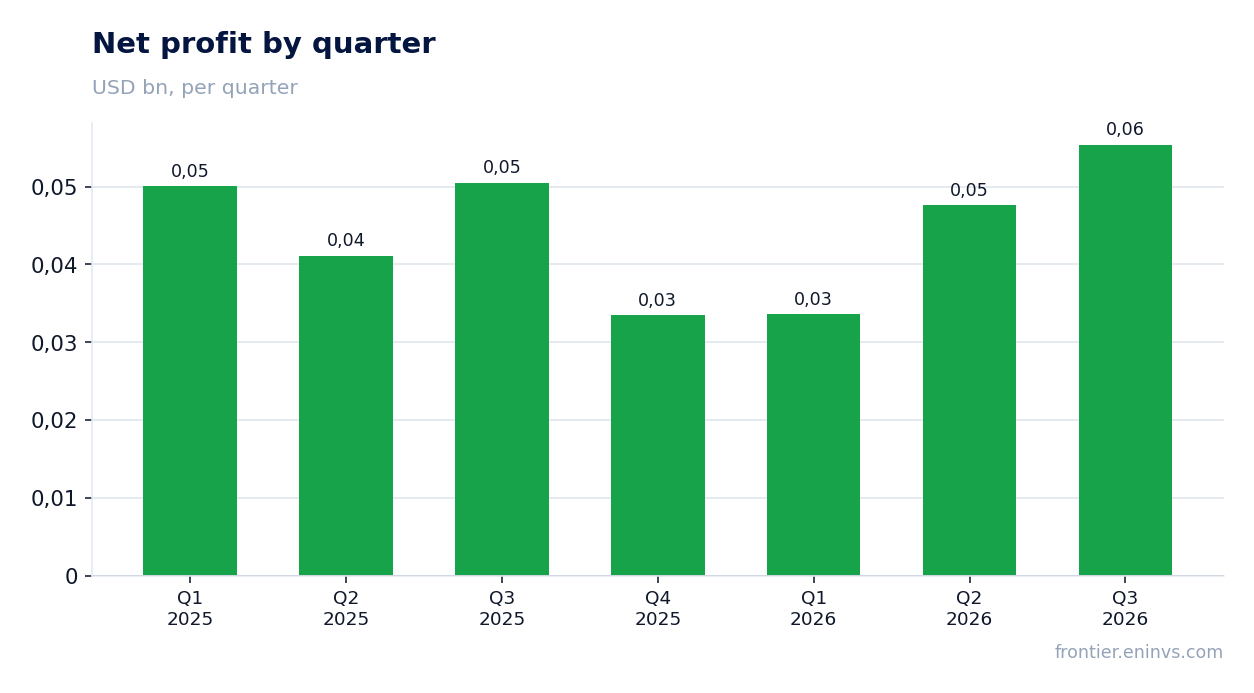
— Operating profit rose to USD 154.7 mn, but net profit added only 9.6% as the margin narrowed to 16.9%
— Net debt remains negative at minus USD 62.7 mn at the end of September 2026
— Net debt to LTM EBITDA stands at minus 0.18 – there is no debt burden
— EV/EBITDA of 11.2 is more than double its own three-year average of 5.4 – the share is pricier than its history
— On the portal's model, the upside to fair value is estimated at +55%
Attractiveness
Key figures, USD bn
| Metric | Q3 2025 | Q3 2026 | Change |
|---|---|---|---|
| Revenue | 0.24 | 0.33 | +35.7% |
| Operating profit | 0.11 | 0.15 | +40.4% |
| Net profit | 0.05 | 0.06 | +9.6% |
| Operating cash flow | 0.11 | 0.08 | -28.6% |
| Net margin | 20.9% | 16.9% | -4.0 pp |
Revenue added 35.7% year on year, and growth accelerated after a 5.4% decline in the second quarter
In the third quarter of 2026 Athabasca Oil's revenue reached USD 328.2 mn, up 35.7% from a year earlier. This is a marked acceleration: in the second quarter revenue fell 5.4% year on year, while in the first it grew 12.7%. Quarterly dynamics are uneven, but the latest report showed the strongest growth in the period under review.
Revenue is also above the previous quarter's USD 246.4 mn in Q2 2026. The quarter-on-quarter increase was about a third, which for an oil producer points to a combination of price and volume factors. The report does not break down grades and volumes in the data provided, so we limit ourselves to stating that the top line clearly accelerated.
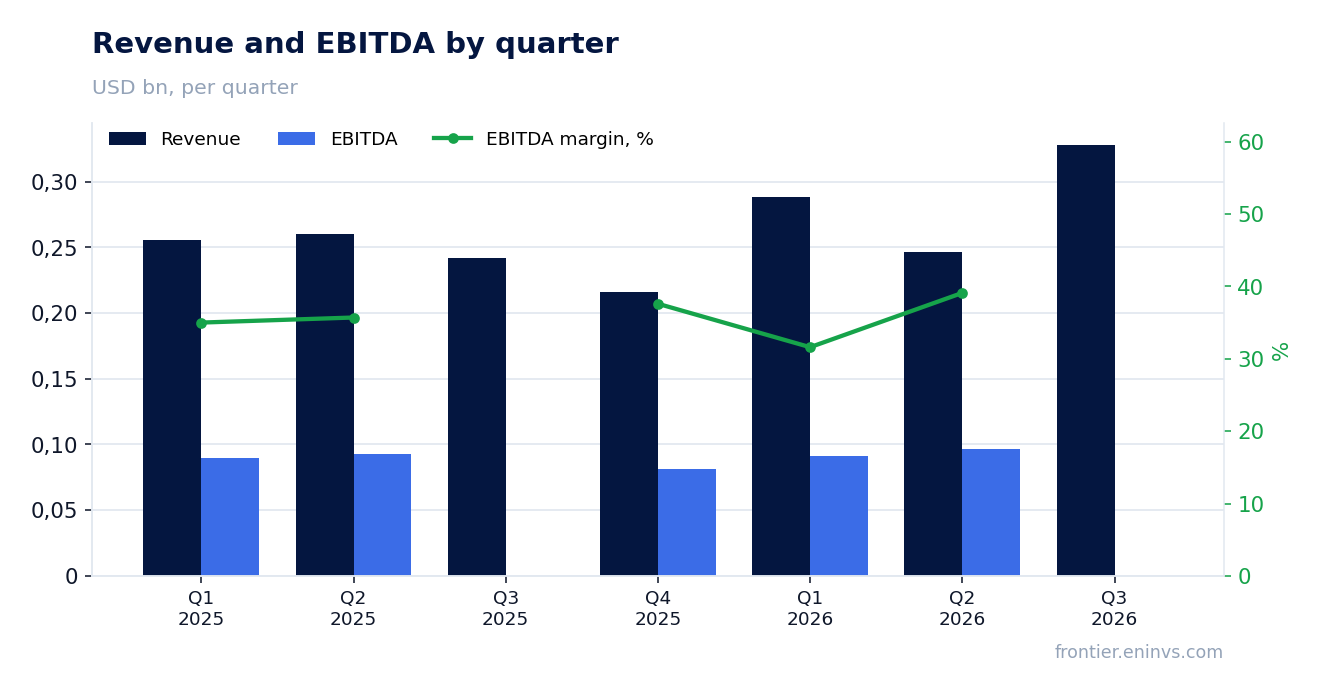
Operating profit rose to USD 154.7 mn, but net profit added only 9.6% as the margin narrowed to 16.9%
Operating profit in Q3 2026 was USD 154.7 mn versus USD 110.2 mn a year earlier. That is growth of more than 40%, meaning operating leverage worked harder than revenue. Net profit, however, rose only to USD 55.4 mn, or 9.6% year on year.
The gap between operating and net profit is explained by the fact that a year earlier net profit was relatively high on a lower operating result. The net margin in the reporting quarter was 16.9% versus 20.9% a year earlier. Margin compression amid revenue growth means that part of the profit was absorbed by lines below operating profit – likely taxes or financial costs, but the data provided do not disclose the exact cause.
For an investor, the key point is that revenue growth does not translate into profit one for one. Operating efficiency improved, but the bottom line came in more modestly than the top-line dynamics would suggest.
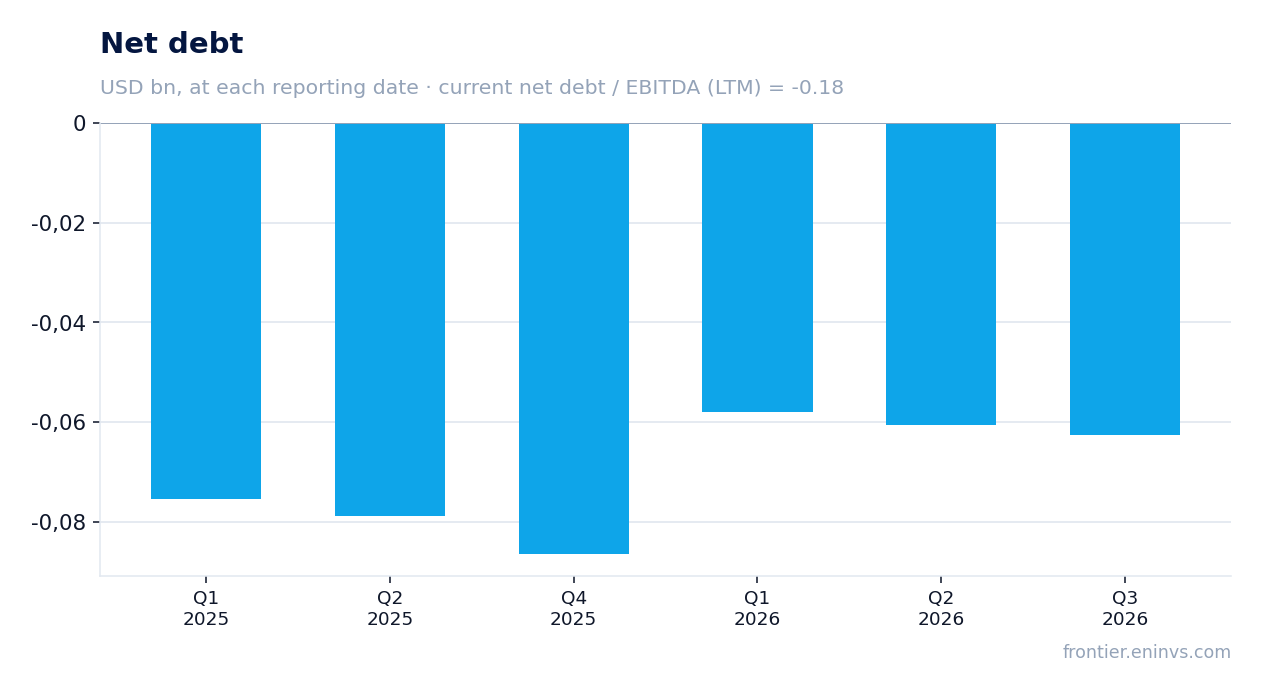
Net debt remains negative at minus USD 62.7 mn at the end of September 2026
As of 30 September 2026 Athabasca Oil's net debt stood at minus USD 62.7 mn, meaning the company holds cash in excess of its debt obligations. A year earlier, on 30 June 2025, the figure was minus USD 0.1 bn, and over 12 months the change was plus USD 0.0 bn – the level remained essentially unchanged.
Negative net debt means the company has no net debt burden. This provides resilience to oil price swings and freedom in capital allocation. Operating cash flow for the quarter was USD 81.6 mn, which covers current needs and leaves a buffer.
Net debt to LTM EBITDA stands at minus 0.18 – there is no debt burden
The ratio of net debt to EBITDA over the last 12 months is minus 0.18. The negative value confirms that the cash cushion exceeds debt. There is no historical data for comparison, so we limit ourselves to stating the level: there is no burden.
LTM EBITDA was USD 356.6 mn on LTM revenue of USD 974.0 mn. LTM net profit was USD 175.2 mn, and LTM operating cash flow was USD 351.4 mn. These figures characterise the company as consistently generating cash flow with no debt burden.
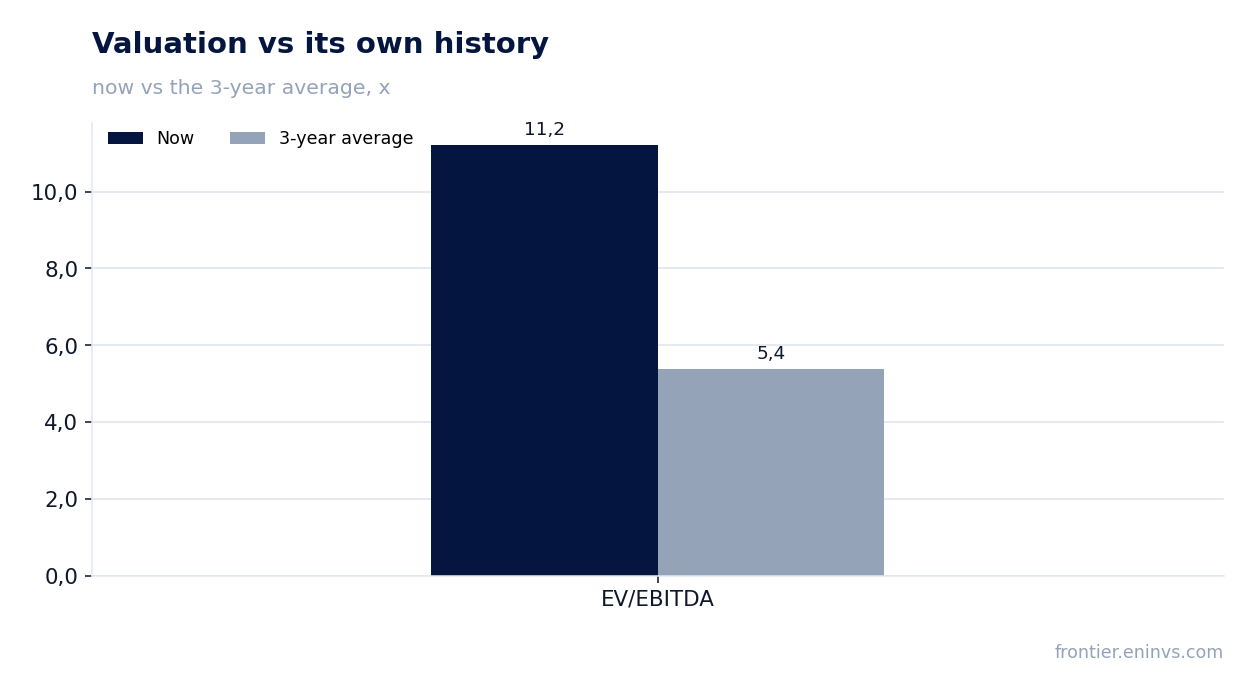
EV/EBITDA of 11.2 is more than double its own three-year average of 5.4 – the share is pricier than its history
The LTM EV/EBITDA multiple is 11.2, while its own three-year average is 5.4. The current value is 108% above the average, meaning the share trades materially more expensive than it usually has over the past three years. This is the key argument against buying at the current level.
The LTM P/E is 23.3, which against LTM net profit of USD 175.2 mn and a market capitalisation of USD 4,087.6 mn looks moderate, but there is no historical average for P/E in the data. The main benchmark is EV/EBITDA, and it clearly points to overvaluation relative to its own history.
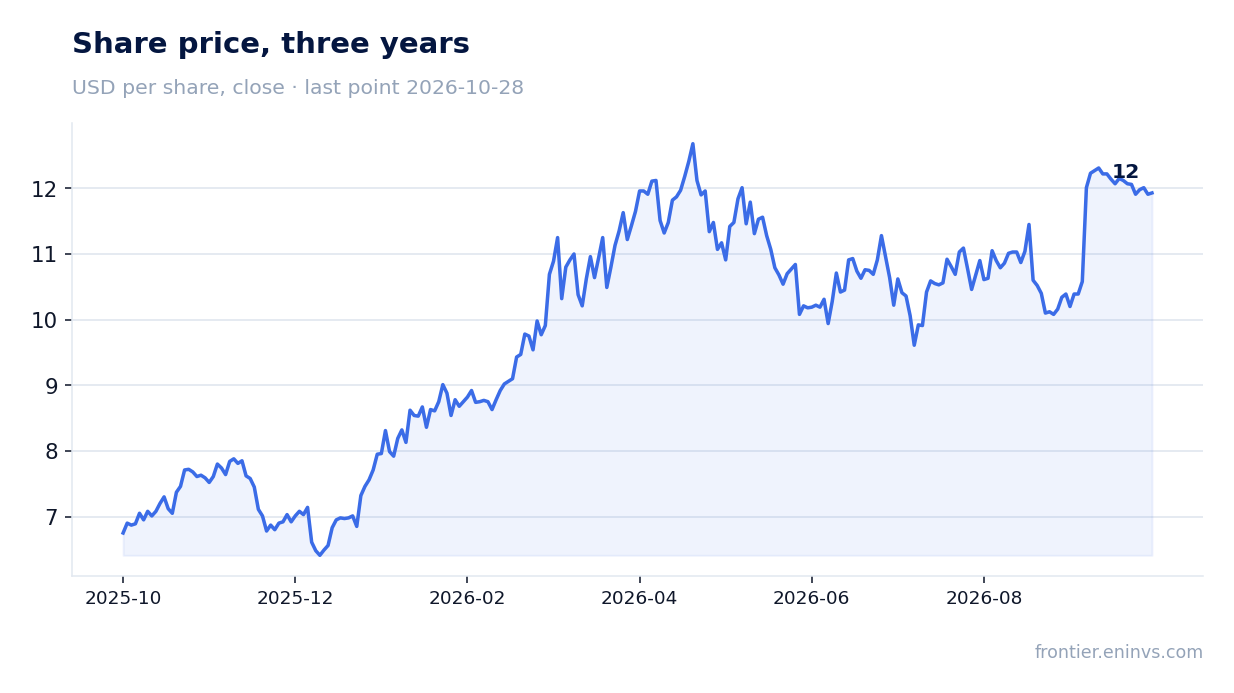
On the portal's model, the upside to fair value is estimated at +55%
On the portal's model, which re-prices EBITDA at current commodity prices at the target EV/EBITDA, the fair value of the share implies +55% upside to the current market price. This is our own estimate, not a market consensus and not a target price.
The model relies on current oil prices and the target multiple. If commodity prices stay at current levels and the company maintains operating efficiency, the upside could materialise. However, the current multiple of 11.2 already embeds an optimistic scenario, so the model's upside looks more like an indication of undervaluation relative to fair value than a near-term catalyst.
Valuation on the latest reported figures
| Metric | Value |
|---|---|
| Market cap | 4.09 bn USD |
| P/E (LTM) | 23.3 |
| EV/EBITDA (LTM) | 11.2 |
| P/B | 3.16 |
| Net debt / EBITDA (LTM) | -0.18 |
| Operating cash flow (LTM) | 0.35 bn |
| ROE | 14.4% |
| EV/EBITDA, 3-year average | 5.4 |
Bottom line
The strong side of the report was revenue growth of 35.7% and its acceleration after the second-quarter decline, along with operating profit of USD 154.7 mn. The weak spot is that net profit added only 9.6% and the margin narrowed to 16.9%. Net debt remains negative, providing financial resilience. The main question for a holder is valuation: EV/EBITDA of 11.2 against a three-year average of 5.4 means the share is pricier than its history, and the portal model's upside (+55%) does not offset this imbalance. The verdict is neutral: strong operating results are balanced by overvaluation relative to the company's own history.
Open the company's financial profile ATH →
See also: market overview · valuation map · stock screeners