Baker Hughes: revenue accelerated to +14.5% on the Chart acquisition, but net income fell by a third on one-off costs
On October 27, Baker Hughes reported third-quarter 2026 results. Revenue reached $8,025 million, up 14.5% year over year after a 2.4% decline in the prior quarter, adjusted EBITDA rose 28.3% to $1,415 million, while net income fell 32.5% to $411 million on Chart transaction costs and amortisation of acquired intangibles. The stock trades at 25.6 times trailing earnings and 11.6 times trailing EBITDA, the dividend yield is 1.6%, and the portal model implies 21% upside to fair value. With a record order backlog and accelerating revenue, the share looks rather attractive, though the gap between adjusted and net income needs checking in the next report.
Key takeaways
— Revenue accelerated to +14.5% year over year, with almost all the gain coming from the Chart acquisition
— Adjusted EBITDA rose 28.3%, but net income fell 32.5% on one-off costs
— A record order backlog of $46.4 billion secures revenue for years ahead
— Debt rose to $18.3 billion after the $14.2 billion deal, but cash covers almost a quarter
— Free cash flow of $769 million covers the dividend with room to spare
— The 1.6% dividend yield is modest against the policy rate, but the payout is protected by cash flow
— At 11.6 times EBITDA and 25.6 times earnings, there is room for re-rating if order growth holds
Attractiveness
Key figures, USD bn
| Metric | Q3 2025 | Q3 2026 | Change |
|---|---|---|---|
| Revenue | 7.01 | 8.03 | +14.5% |
| EBITDA | 1.10 | 1.42 | +28.3% |
| Operating profit | 0.82 | — | — |
| Net profit | 0.61 | 0.41 | -32.5% |
| Operating cash flow | 0.93 | 1.00 | +8.2% |
| Capex | 0.29 | — | — |
| EBITDA margin | 15.7% | 17.6% | +1.9 pp |
| Net margin | 8.7% | 5.1% | -3.6 pp |
Revenue accelerated to +14.5% year over year, with almost all the gain coming from the Chart acquisition
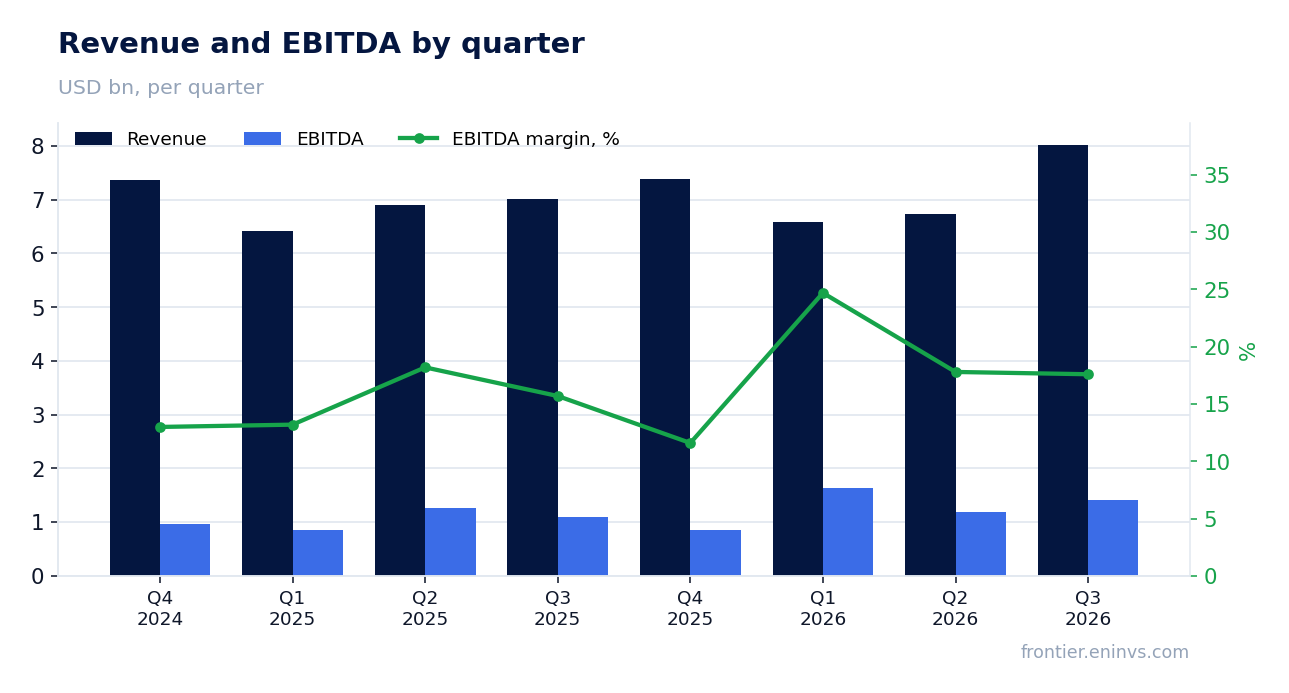
Revenue in the third quarter of 2026 reached $8,025 million, up 14.5% year over year after a 2.4% decline in the second quarter. The acceleration came almost entirely from consolidating Chart from July 16: the segment contributed $888 million of revenue, or about 87% of the full year-over-year increase of $1,015 million. Without Chart, revenue would have grown roughly 2%, in line with the prior quarters.
Organic growth came from Oilfield Services & Equipment and Industrial & Energy Technology. OFSE revenue rose 1% year over year to $3,660 million, IET – 3% to $3,477 million. Within IET, gas technology equipment fell 7% on the disposal of Precision Sensors & Instrumentation, while gas technology services grew 12%. OFSE geography shifted toward Europe, CIS and Africa, where revenue rose 29%, while the Middle East and Asia declined 13%.
The order backlog rose to $46.4 billion, of which $39.4 billion is in IET. Quarterly orders were $10.8 billion, a book-to-bill ratio of 1.3. This means the company is loaded with orders for several years ahead, and the current revenue acceleration is not a one-off spike but the start of converting the accumulated backlog.
Adjusted EBITDA rose 28.3%, but net income fell 32.5% on one-off costs
Adjusted EBITDA in the third quarter was $1,415 million, 28.3% above the year-earlier level. The EBITDA margin rose to 17.6% from 15.7%. Growth came from the Chart contribution, higher prices and cost-out initiatives, partly offset by inflation and a change in business mix.
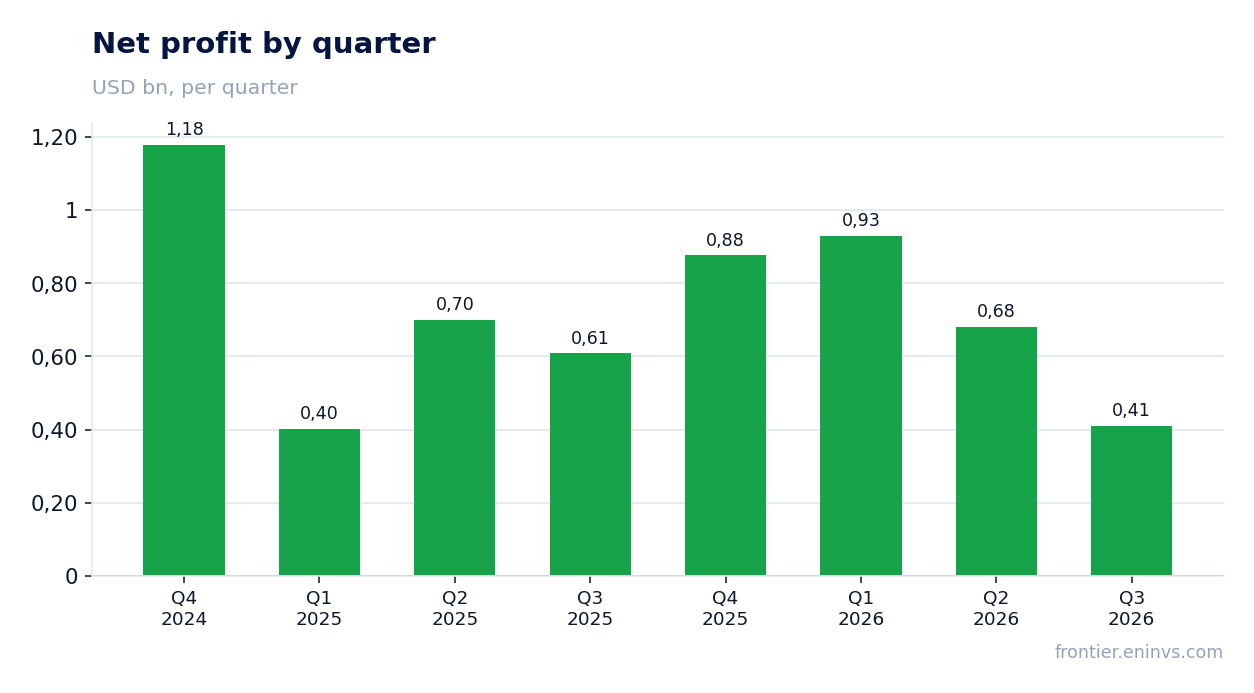
GAAP net income fell 32.5% to $411 million, and the net margin dropped to 5.1% from 8.7%. The gap is explained by one-off items: Chart transaction costs of $158 million, amortisation of acquired intangibles of $143 million, inventory step-up charges of $25 million, and restructuring of $28 million. Adjusted net income rose 2% to $695 million, and adjusted earnings per share were $0.70 versus $0.68 a year earlier.
The $284 million gap between adjusted and net income is the price of integrating Chart. As the deal is completed, these costs will disappear and net income will converge with adjusted income. For now, the market sees a one-third drop in profit, which explains the cautious reaction despite strong operating metrics.
A record order backlog of $46.4 billion secures revenue for years ahead
The order backlog rose to $46.4 billion, up $6.4 billion in the quarter. IET accounted for $39.4 billion, of which $16.5 billion is gas technology equipment and $16.8 billion is services. Chart added $3.6 billion. This backlog covers more than five quarters of current revenue and provides high visibility for 2027–2028.
Quarterly orders of $10.8 billion were the second-largest in IET's history. The company raised its full-year IET order guidance and its 2026–2028 Horizon 2 outlook to $50 billion plus. Drivers are data centres, space, LNG and gas infrastructure. Major contracts include 1.1 GW of gas turbines for a U.S. technology company and orders for Venture Global's Plaquemines project.
The record backlog reduces the risk of a revenue slowdown even if current orders temporarily dip. However, converting orders into revenue and cash depends on execution timelines and may stretch over several years. For an investor, this means the current valuation should rest on the company's ability to deliver contracts on time, not on one-off order spikes.
Debt rose to $18.3 billion after the $14.2 billion deal, but cash covers almost a quarter
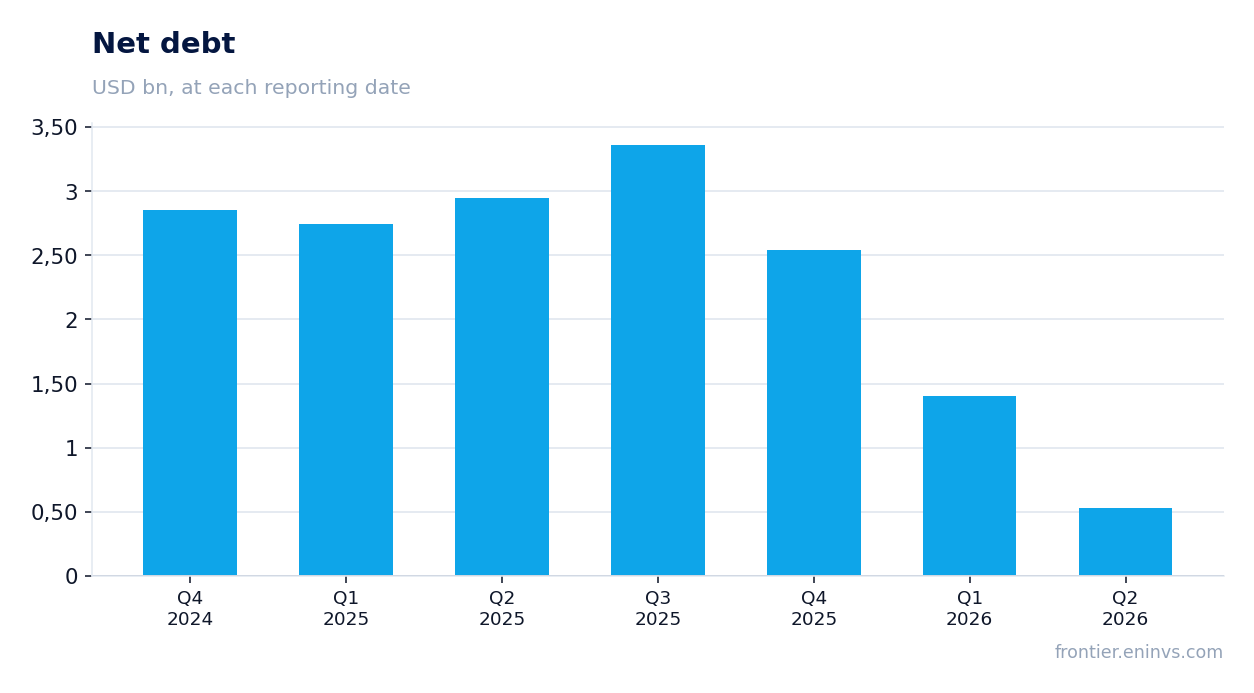
Net debt at the end of the third quarter was $18.3 billion versus $5.4 billion at the end of 2025. The increase reflects the $14.2 billion Chart acquisition, financed by $11.9 billion of long-term bond issuance and own cash. Cash and equivalents were $4.1 billion, covering about 22% of gross debt.
Interest expense rose to $177 million for the quarter versus $56 million a year earlier, reflecting servicing of the new debt. With trailing twelve-month EBITDA of $5.1 billion, the net debt to EBITDA ratio is about 3.6 – higher than before the deal but still manageable for a company with a record order backlog. Operating cash flow for the quarter was $1,005 million, enough to service debt without strain.
Leverage is the main risk after the deal. If cash flow stays at $3.6 billion on a trailing twelve-month basis, the company can reduce debt by about $1 billion a year after dividends. However, further acquisitions or a slowdown in converting orders into cash could require additional financing.
Free cash flow of $769 million covers the dividend with room to spare
Operating cash flow in the third quarter was $1,005 million, and free cash flow was $769 million after capital expenditures of $236 million. On a trailing twelve-month basis, operating cash flow was $3,583 million, enough to cover dividends of $228 million per quarter and capital expenditures. The company maintains discipline: capex remains around 3% of revenue.
The quarterly dividend was $0.23 per share, unchanged from a year earlier. With an annual payout of $0.92 and a price of $56, the dividend yield is 1.6%. This is modest against current rates, but the payout is protected by cash flow: free cash flow coverage exceeds 3 times. The company did not cut the dividend even during the Chart integration.
Free cash flow remains positive after the deal despite higher interest expense. This is an important signal: the company can simultaneously service debt, pay dividends and invest in growth. If the flow holds, management has room for further debt reduction or higher payouts.
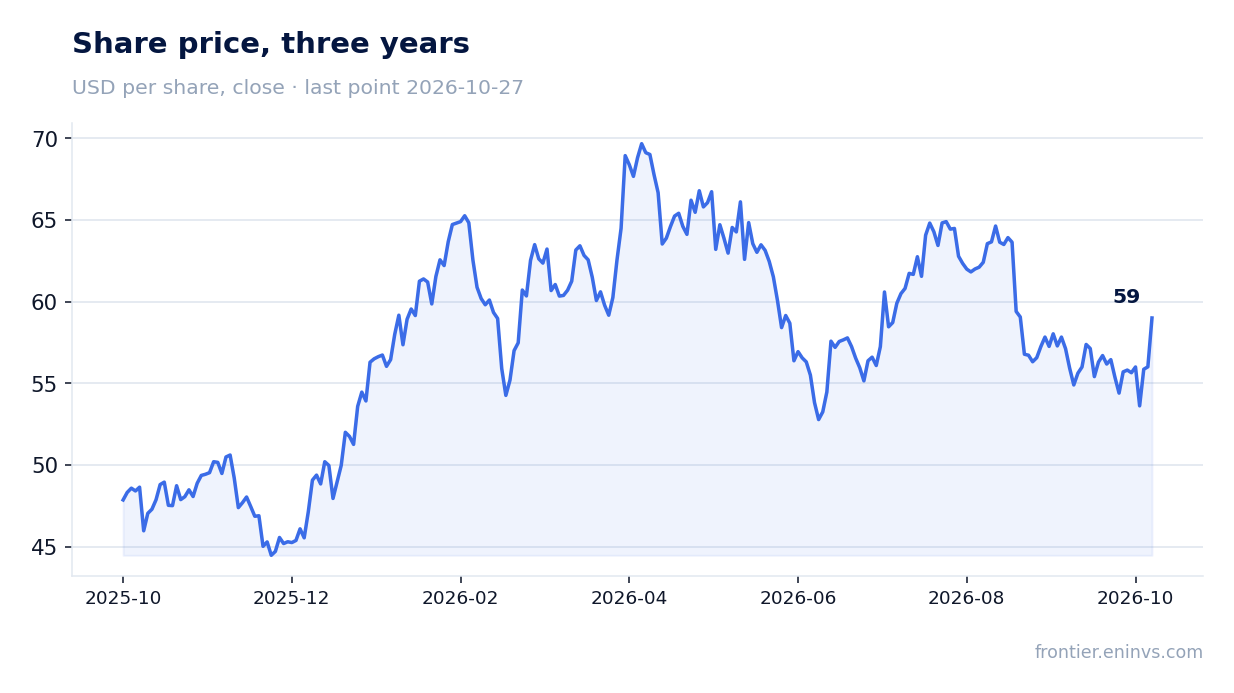
The 1.6% dividend yield is modest against the policy rate, but the payout is protected by cash flow
The latest payment was $0.23 per share for the third quarter of 2026, $0.92 for the year. At a price of $56, the yield is 1.6%. This is below many oil and gas sector names and well below the current policy rate. However, stability of the payout matters more than size: the company pays quarterly and did not cut the dividend during the Chart integration.
Our estimate for the 2026 dividend is $0.92 per share, flat on last year. The payout rests on adjusted net income of $2,289 million over the trailing twelve months and free cash flow of $3,583 million. The payout ratio to free cash flow is about 25%, leaving a margin of safety. The risk of a cut is low as long as cash flow remains positive.
A 1.6% yield is not the main argument for the stock. For a dividend-focused investor, the name may look less attractive than fixed-income instruments. However, combined with revenue and backlog growth, the dividend is a pleasant addition rather than the basis of the investment case.
At 11.6 times EBITDA and 25.6 times earnings, there is room for re-rating if order growth holds
The stock trades at 11.6 times EV/EBITDA and 25.6 times P/E on a trailing twelve-month basis. Return on equity is 13.9%. For a company with a record order backlog and accelerating revenue, these multiples look moderate. The portal model values fair value at 21% upside to the current price, reflecting a re-pricing of EBITDA at current commodity prices.
A comparison of the current multiple with its own three-year history is not possible – the FACTS contain no averages. However, relative to revenue growth of 14.5% and EBITDA growth of 28.3%, the valuation does not look stretched. The market, judging by the reaction to the report (+5.3% on the publication day and +5.3% since), is gradually acknowledging the strength of operating results.
The main risk to the valuation is the gap between adjusted and net income. If one-off Chart integration costs prove prolonged, P/E will stay high and the discount to fair value will not materialise. Conversely, completing the integration and growing cash flow could lead to a re-rating toward the portal model.
Valuation on the latest reported figures
| Metric | Value |
|---|---|
| Market cap | 58.6 bn USD |
| P/E (LTM) | 25.6 |
| EV/EBITDA (LTM) | 11.6 |
| Operating cash flow (LTM) | 3.58 bn |
| ROE | 13.9% |
| Dividend yield (12m) | 1.6% |
Bottom line
The strong side of the report is revenue acceleration to 14.5% and a record order backlog of $46.4 billion, which provides visibility for years ahead. The weak side is the 32.5% drop in net income on one-off Chart integration costs, and the rise in debt to $18.3 billion. The 1.6% dividend is protected by cash flow but is not the main argument. At 11.6 times EBITDA and 25.6 times earnings, there is room for re-rating if the company completes the integration and sustains order growth. The verdict is rather attractive: operating results are strong, but the gap between adjusted and net income needs confirmation in the next quarter.
Open the company's financial profile BKR →
See also: market overview · valuation map · stock screeners