Crescent Energy: profit tripled, but net debt added $1.5bn over the year
Crescent Energy reported second-quarter 2026 results. Revenue rose 55.3% year on year to $1,394.95m, EBITDA by 149.3% to $938.99m, and net profit by 221.6% to $492.77m. The EBITDA margin climbed to 67.3% from 41.9% a year earlier, while net debt at 30 June stood at $4.9bn against $3.4bn a year earlier. With an EV/EBITDA of 3.79 and the portal model pointing to 51% upside, the share looks attractive, though the rise in debt and the one-off nature of part of the profit need checking in the next report.
Key takeaways
— Revenue accelerated to +55.3% year on year from +24.5% a quarter earlier
— EBITDA rose 149.3% and its margin climbed to 67.3% from 41.9%
— Net profit of $492.77m includes one-off items that will not repeat
— Operating cash flow of $706.79m covers capital expenditure of $330.93m
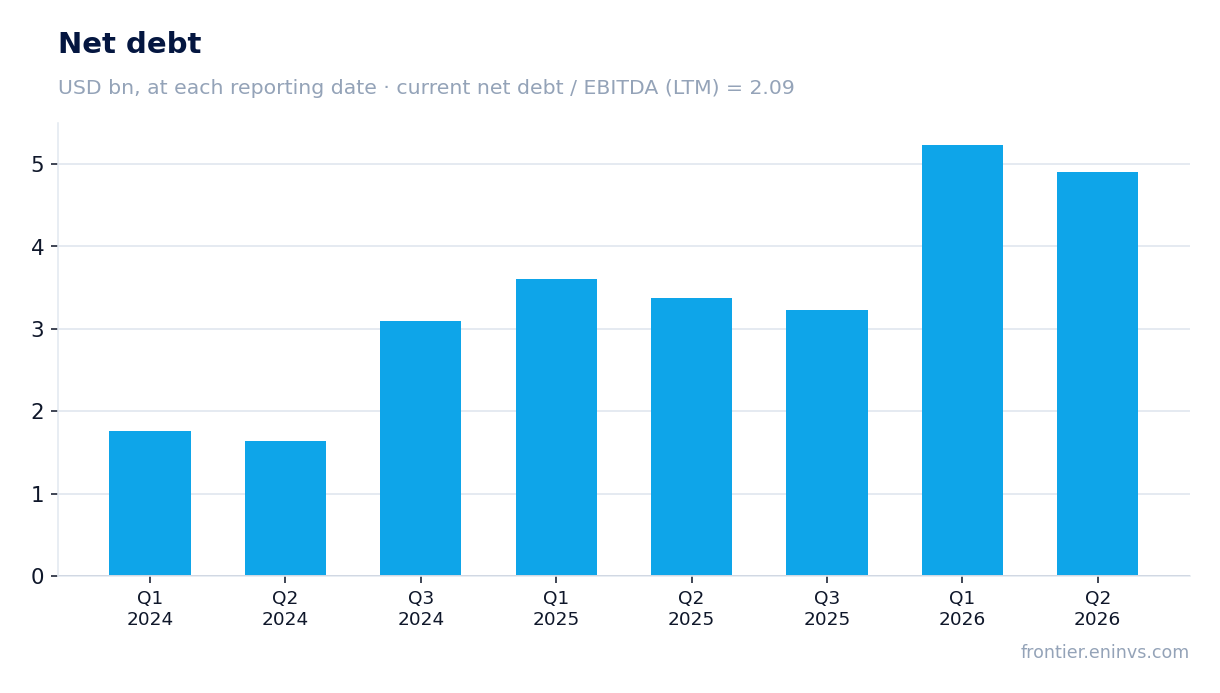
— Net debt rose to $4.9bn from $3.4bn a year earlier, with net debt/EBITDA LTM at 2.09
— At EV/EBITDA 3.79 and P/E LTM 61.60, valuation is low on cash flow but high on profit
— The portal model points to 51% upside to the current price
Attractiveness
Key figures, USD bn
| Metric | Q2 2025 | Q2 2026 | Change |
|---|---|---|---|
| Revenue | 0.90 | 1.39 | +55.3% |
| EBITDA | 0.38 | 0.94 | +149.3% |
| Operating profit | 0.08 | 0.58 | +629.6% |
| Net profit | 0.15 | 0.49 | +221.6% |
| Operating cash flow | 0.50 | 0.71 | +41.7% |
| Capex | 0.28 | 0.33 | +19.5% |
| EBITDA margin | 41.9% | 67.3% | +25.4 pp |
| Net margin | 17.1% | 35.3% | +18.2 pp |
Revenue accelerated to +55.3% year on year from +24.5% a quarter earlier
In the second quarter of 2026, Crescent Energy's revenue reached $1,394.95m, up 55.3% year on year. This marks a clear acceleration from the first quarter, when growth was 24.5%. A quarter earlier revenue was $1,182.83m, so sequential growth is also evident.
The acceleration is mainly explained by the low base of the second quarter of 2025, when revenue was $897.98m. Energy prices were lower then, and the company posted more modest results. Revenue is now growing faster than the average of the last four quarters, confirming an improvement in market conditions.
For this dynamic to hold, oil and gas prices need to stay at current levels. If they fall, revenue growth could slow, as it did in the third quarter of 2025, when growth was 16.3%.
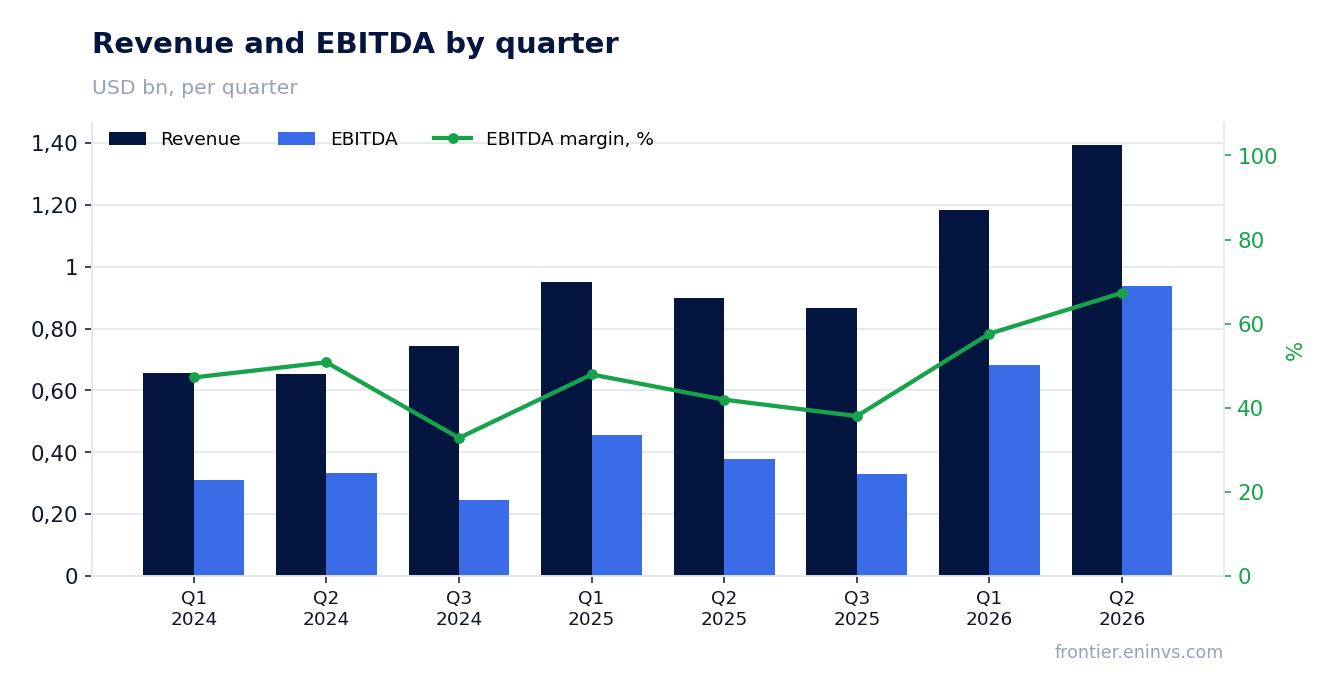
EBITDA rose 149.3% and its margin climbed to 67.3% from 41.9%
EBITDA in the second quarter of 2026 was $938.99m, up 149.3% year on year. The EBITDA margin reached 67.3% against 41.9% a year earlier. Such margin growth means revenue rose faster than costs, and operating leverage worked at full force.
Operating profit was $580.99m, also significantly above last year's level. The main contributor to margin growth was lower unit costs of production and maintenance, along with favourable prices. The company does not disclose cost line details, but such a sharp improvement in profitability suggests that most of the additional revenue flowed to profit.
Net profit reached $492.77m, with a net margin of 35.3% against 17.1% a year earlier. However, part of this profit may be one-off in nature, which is important to consider when assessing the sustainability of the result.
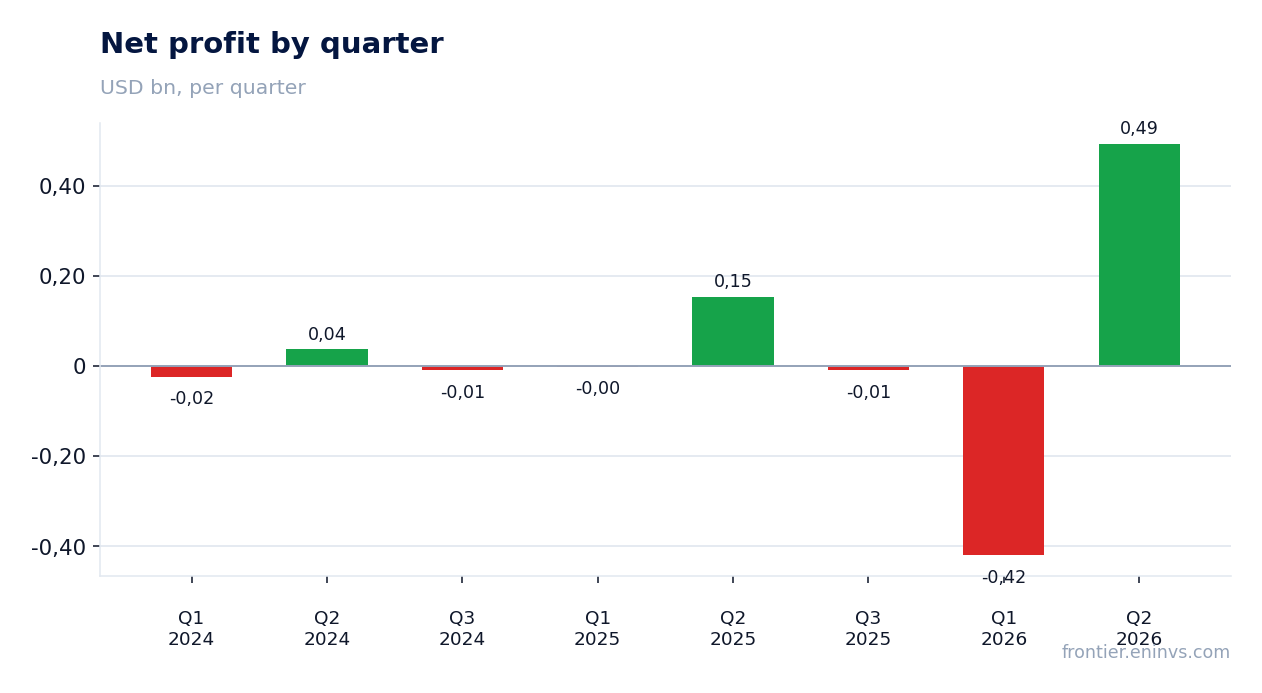
Net profit of $492.77m includes one-off items that will not repeat
Net profit in the second quarter of 2026 was $492.77m, up 221.6% year on year. However, in the first quarter of 2026 the company posted a loss of $419.85m, indicating the presence of volatile items, likely related to asset revaluation or hedging.
The sharp swing from loss to profit in a single quarter suggests that a significant part of the financial result stems from non-operating, one-off factors. Without access to report details, it is impossible to precisely separate operating profit from one-off items, but the scale of fluctuations is evident.
For an investor, this means the P/E LTM of 61.60 may not reflect the company's true ability to generate profit. When assessing business sustainability, it is more reasonable to rely on EBITDA and cash flow, which are less susceptible to one-off swings.
Operating cash flow of $706.79m covers capital expenditure of $330.93m
Operating cash flow in the second quarter of 2026 was $706.79m, more than double the capital expenditure of $330.93m. Free cash flow therefore remains positive and substantial, allowing the company to fund both investments and debt servicing.
For comparison, a year earlier operating cash flow was $498.97m with capital expenditure of $276.85m. Cash flow growth outpaces capital investment growth, indicating improved efficiency. The company is ramping up production while generating sufficient funds to cover investments.
Over the trailing twelve months, operating cash flow was $1,960.1m, confirming the company's ability to generate cash consistently. This is an important argument for business resilience despite net profit volatility.
Net debt rose to $4.9bn from $3.4bn a year earlier, with net debt/EBITDA LTM at 2.09
Net debt at 30 June 2026 was $4.9bn, up from $3.4bn at 30 June 2025. Over the year debt rose by $1.5bn, reflecting active investment and possibly acquisitions. At the same time, the net debt/EBITDA LTM ratio stands at 2.09, which is moderate for a capital-intensive business.
Since the start of the year, debt has also increased: at 31 March 2026 it was $5.2bn, and by 30 June it had declined to $4.9bn. This $0.3bn decrease over the quarter suggests the company has begun to reduce leverage after growth in previous periods.
A debt level of 2.09 EBITDA is not critical but requires monitoring. If energy prices fall, the ability to service debt could deteriorate. For now, cash flow covers interest payments and capital expenditure.
At EV/EBITDA 3.79 and P/E LTM 61.60, valuation is low on cash flow but high on profit
The EV/EBITDA LTM multiple is 3.79, indicating a low valuation based on operating profit. For a capital-intensive oil and gas business, this level can be attractive if EBITDA is sustainable. However, P/E LTM is 61.60, reflecting weak net profit over the last twelve months – only $54.8m.
The gap between low EV/EBITDA and high P/E is explained by one-off write-offs and net profit volatility. Return on equity (ROE) is 40.04%, indicating high return on capital, but this metric may also be distorted by one-off factors.
Comparing current multiples with three-year historical averages is not possible due to missing data in the FACTS. However, the combination of low EV/EBITDA and high P/E is typical for companies with high depreciation and one-off write-offs. For an investor, it is more important to focus on cash flow, which remains strong.
The portal model points to 51% upside to the current price
According to the portal model, which re-prices EBITDA at current commodity prices using a target EV/EBITDA, the fair value of the share implies 51% upside to the current market price. This is the portal's own estimate, not a market consensus or a target price.
The model is based on current EBITDA and a target multiple, which may differ from the actual one. If energy prices remain at current levels and debt does not grow further, the upside could materialise. However, commodity market volatility remains a key risk.
The company's market capitalisation is $3,372.89m, which at EV/EBITDA 3.79 and significant cash flow appears undervalued. But for the upside to be realised, operating results must remain stable and debt must not increase further.
Valuation on the latest reported figures
| Metric | Value |
|---|---|
| Market cap | 3.37 bn USD |
| P/E (LTM) | 61.6 |
| EV/EBITDA (LTM) | 3.8 |
| P/B | 0.65 |
| Net debt / EBITDA (LTM) | 2.09 |
| Operating cash flow (LTM) | 1.96 bn |
| ROE | 40.0% |
Bottom line
Crescent Energy delivered a strong second quarter of 2026: revenue rose 55.3%, EBITDA by 149.3%, and the EBITDA margin reached 67.3%. Operating cash flow of $706.79m comfortably covers capital expenditure, and the net debt/EBITDA LTM ratio of 2.09 remains moderate. However, the $1.5bn increase in debt over the year and the one-off nature of part of the profit call for caution. At EV/EBITDA 3.79 and with 51% upside on the portal model, the share looks attractive, but another quarter without one-off profit swings is needed to confirm sustainability.
Open the company's financial profile CRGY →
See also: market overview · valuation map · stock screeners