Crescent Energy: revenue accelerated to +55.9%, but costs and debt ate the profit
On 2 November Crescent Energy reported third-quarter 2026 results. Revenue rose 55.9% year on year to USD 1,351.2 mn, EBITDA jumped 159.3% to USD 853.6 mn, yet net profit stayed at zero: minus USD 2.2 mn versus minus USD 9.5 mn a year earlier. The EBITDA margin climbed to 63.2% from 38.0%, but net debt stood at USD 4.7 bn on 30 September 2026, and servicing it together with depreciation leaves almost nothing for shareholders. At an EV/EBITDA of 3.0 against its own three-year average of 5.2 and a dividend yield of 3.6%, the stock looks cheap by its own history, but the verdict is neutral: revenue growth is not yet turning into profit.
Key takeaways
— Revenue accelerated to +55.9% year on year, the fastest pace in recent quarters
— EBITDA rose 159.3% and the margin climbed to 63.2% from 38.0% a year earlier
— Net profit stayed at zero: minus USD 2.2 mn against operating profit of USD 478.7 mn
— Net debt fell from USD 4.9 bn on 30 June 2026 to USD 4.7 bn on 30 September 2026
— Leverage of 1.63x EBITDA LTM is moderate, but debt rose by USD 1.5 bn over the year
— The 3.6% dividend yield rests on payouts only slightly above the key rate
— EV/EBITDA of 3.0 versus its own three-year average of 5.2 – the stock is 42% cheaper than its history
Attractiveness
Key figures, USD bn
| Metric | Q3 2025 | Q3 2026 | Change |
|---|---|---|---|
| Revenue | 0.87 | 1.35 | +55.9% |
| EBITDA | 0.33 | 0.85 | +159.3% |
| Operating profit | 0.03 | 0.48 | +1454.1% |
| Net profit | -0.01 | -0.00 | — |
| Operating cash flow | 0.47 | 0.61 | +28.6% |
| Capex | 0.22 | — | — |
| EBITDA margin | 38.0% | 63.2% | +25.2 pp |
| Net margin | -1.1% | -0.2% | +0.9 pp |
Revenue accelerated to +55.9% year on year, the fastest pace in recent quarters
In the third quarter of 2026 Crescent Energy's revenue reached USD 1,351.2 mn, up 55.9% year on year. That is an acceleration from the second quarter, when growth was 55.3%. Sequentially, revenue was USD 1,395.0 mn a quarter earlier, so it actually slipped 3.1%.
The year-on-year growth rests on a low base: third-quarter 2025 revenue was USD 866.6 mn. The acceleration in annual terms reflects a weak quarter a year ago against a strong one now. The sequential dynamic suggests the revenue peak probably came in the second quarter of 2026.
For an investor the key point is that revenue growth is not accompanied by profit growth. The company is scaling turnover, but that turnover does not reach net profit. The next report will show whether the annual growth rate holds or was a one-off spike off a weak base.
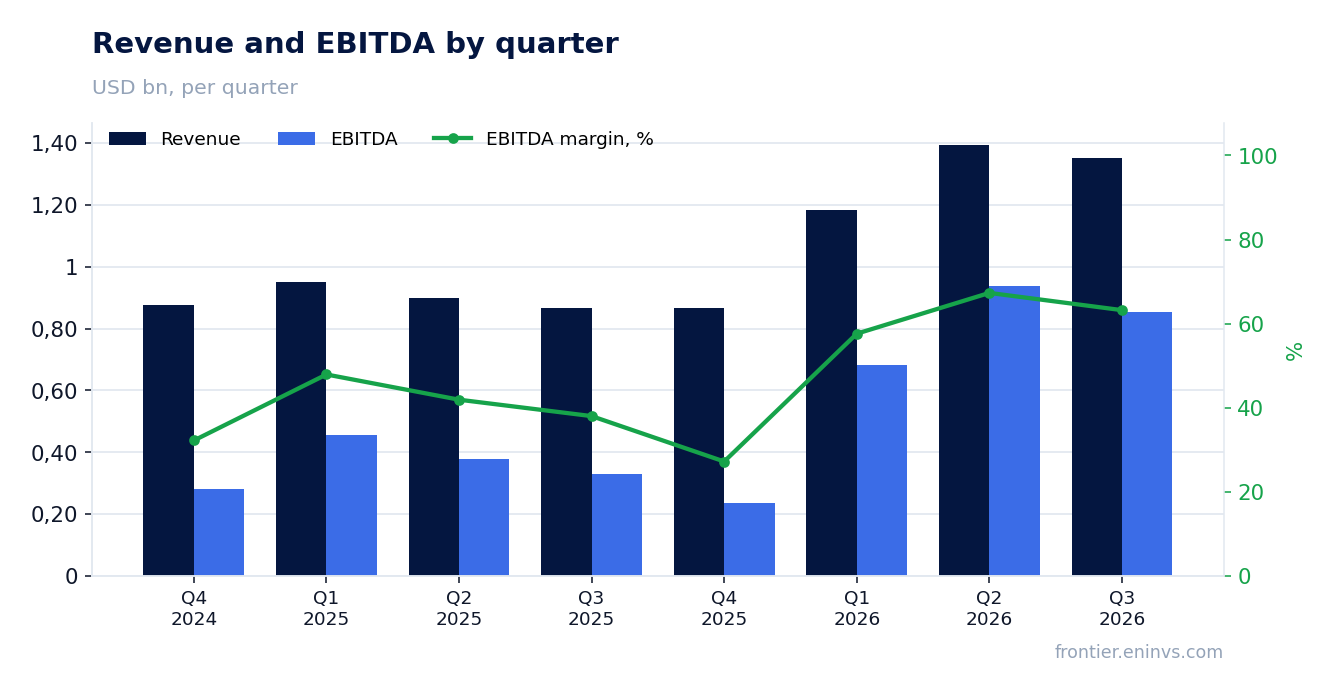
EBITDA rose 159.3% and the margin climbed to 63.2% from 38.0% a year earlier
EBITDA for the third quarter of 2026 was USD 853.6 mn against USD 329.3 mn a year earlier – growth of 159.3%. The EBITDA margin rose to 63.2% from 38.0%. Such a jump in margin means revenue grew faster than costs: part of the cost base stayed flat, and each extra dollar of revenue contributed disproportionately to EBITDA.
Operating profit was USD 478.7 mn, meaning depreciation and other non-cash items absorbed about USD 375 mn of EBITDA. That is a substantial gap between EBITDA and operating profit, and it explains why net profit was near zero despite such high EBITDA.
A high EBITDA margin with weak net profit is typical for a capital-intensive business where the main costs sit below the operating line: interest on debt and depreciation. An investor should look not at the EBITDA margin but at what remains after interest and taxes.
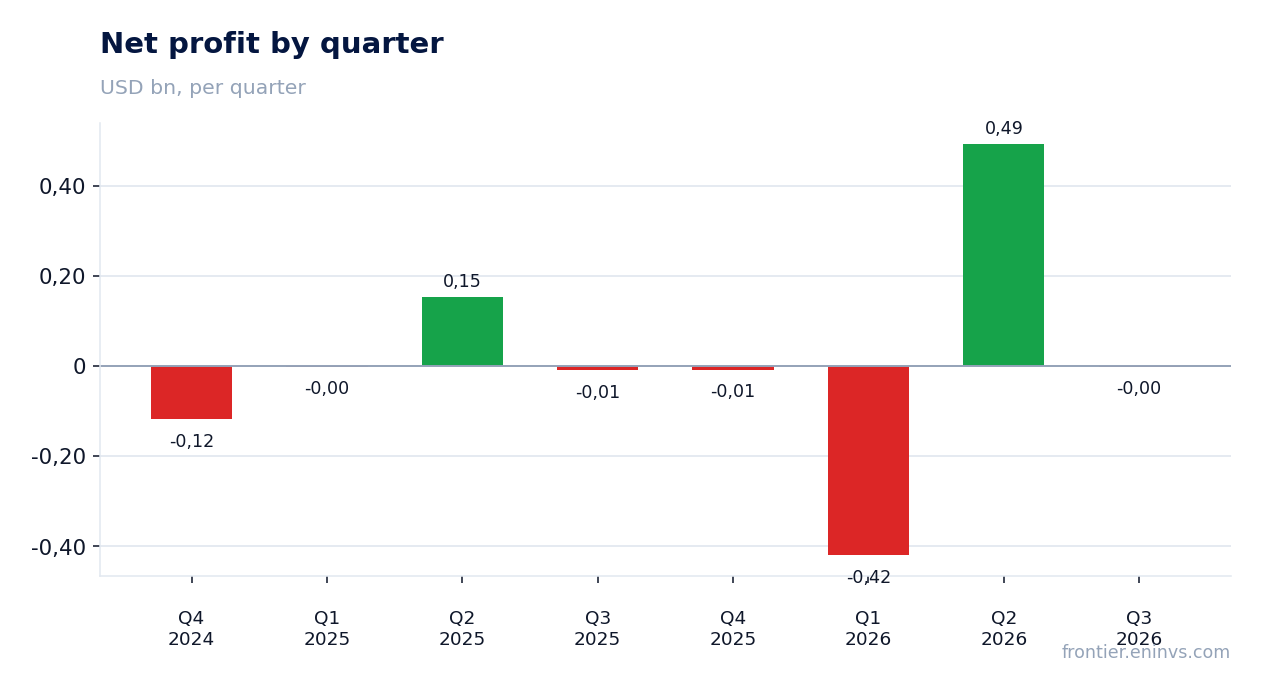
Net profit stayed at zero: minus USD 2.2 mn against operating profit of USD 478.7 mn
The net loss for the third quarter of 2026 was USD 2.2 mn against USD 9.5 mn a year earlier. With operating profit of USD 478.7 mn, this means interest on debt and taxes absorbed almost all of the operating profit. The gap between operating profit and the net result is about USD 480 mn.
For comparison: in the second quarter of 2026 net profit was USD 492.8 mn, while in the first it was a loss of USD 419.8 mn. Quarterly results swing widely, and the third quarter was weak on net profit against strong operating momentum. The report does not disclose the cause of that volatility, but it clearly sits below the operating line.
Zero net profit against rising revenue is the main question for the report. Until the company shows that operating growth converts into net profit, shareholders can count only on dividends and on a re-rating of the multiple.
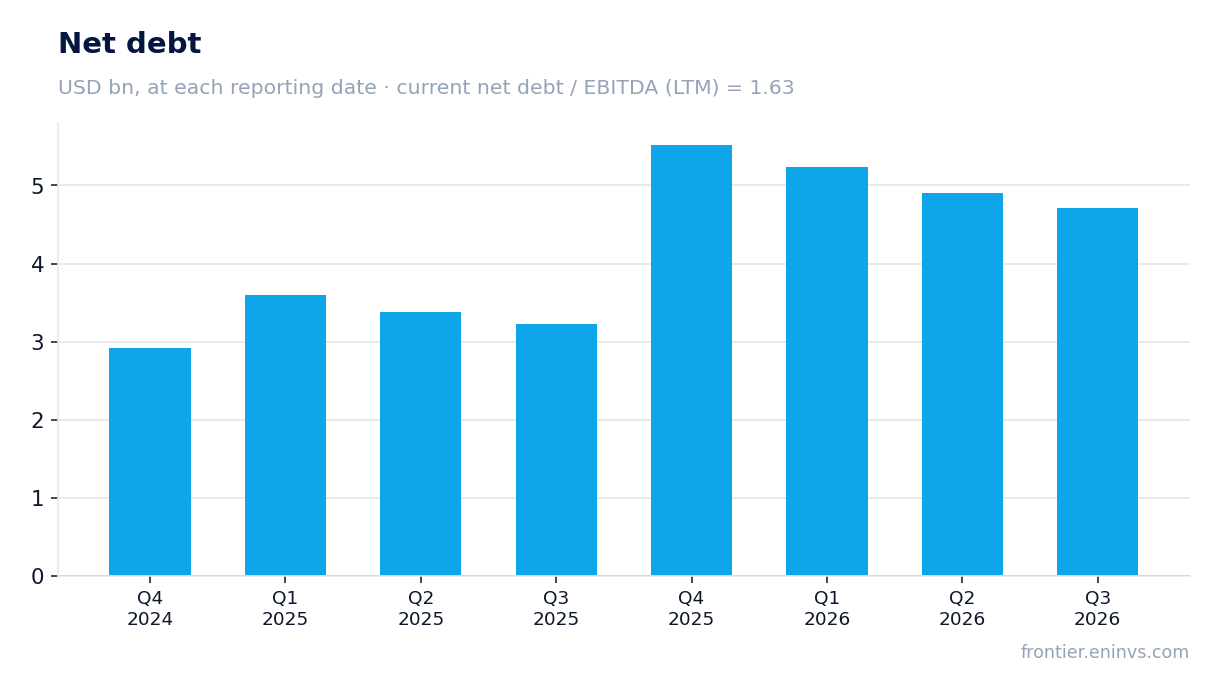
Net debt fell from USD 4.9 bn on 30 June 2026 to USD 4.7 bn on 30 September 2026
Net debt on 30 September 2026 was USD 4.7 bn against USD 4.9 bn on 30 June 2026 – a reduction of USD 0.2 bn over the quarter. Over the year debt rose: on 30 September 2025 it was USD 3.2 bn, so the increase was USD 1.5 bn. The ratio of net debt to EBITDA LTM is 1.63, a moderate level for a capital-intensive business.
Operating cash flow for the third quarter of 2026 was USD 608.5 mn, which allowed partial repayment of debt. Over the last twelve months operating cash flow was USD 2,095.5 mn, while capital expenditure in prior quarters ranged from USD 200 mn to USD 330 mn per quarter. Free cash flow remains positive, but a significant part of it goes to debt service.
The quarterly debt reduction is a positive signal, but the annual increase of USD 1.5 bn shows the company is actively financing growth with borrowings. At current EBITDA LTM of USD 2,886.4 mn, debt at 1.63x EBITDA does not look threatening, but sensitivity to interest rates is high.
Leverage of 1.63x EBITDA LTM is moderate, but debt rose by USD 1.5 bn over the year
The ratio of net debt to EBITDA LTM is 1.63. That is a level that leaves the company room to manoeuvre, but it is not low for an industry with volatile commodity prices. Importantly, this ratio is based on EBITDA LTM of USD 2,886.4 mn, which includes strong second and third quarters of 2026.
If EBITDA returns to 2025 levels, when quarterly figures were USD 235–455 mn, annual EBITDA would be around USD 1.3–1.8 bn, and then debt of USD 4.7 bn would be 2.6–3.6x EBITDA. That materially changes the picture: current leverage is comfortable only if high EBITDA persists.
Interest expense is the main consumer of operating profit. With operating profit of USD 478.7 mn and a net loss of USD 2.2 mn, interest and taxes amount to about USD 480 mn per quarter. A debt reduction of USD 0.2 bn per quarter helps, but a noticeable improvement in net profit requires either further EBITDA growth or faster debt repayment.
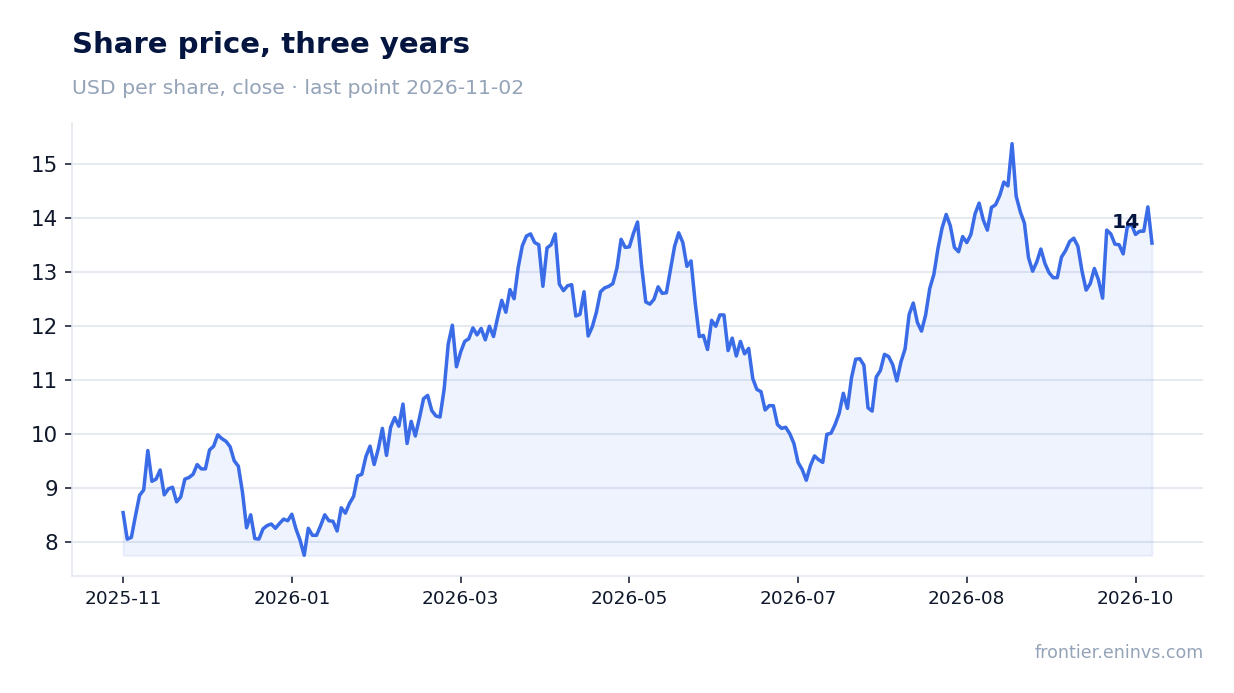
The 3.6% dividend yield rests on payouts only slightly above the key rate
The dividend yield over the last twelve months is 3.6%. The company pays dividends, but the payout is modest relative to the share price. With net profit LTM of USD 62.1 mn and a market capitalisation of USD 3,540.4 mn, the P/E LTM is 57.0 – earnings per share are very small, and the dividend is barely covered by them.
Our estimate for the current year's dividend assumes the payout ratio stays at a level that provides a yield of about 3.6% at the current price. The payout depends on quarterly net profit, which swings widely: from minus USD 419.8 mn in the first quarter of 2026 to plus USD 492.8 mn in the second. If the weak third quarter repeats, the dividend could be cut.
A 3.6% yield does not look attractive against a key rate that remains in double digits in Russia. For an income-oriented investor, Crescent Energy loses out to risk-free instruments. The dividend here is more a pleasant addition to the growth story than the main reason to buy.
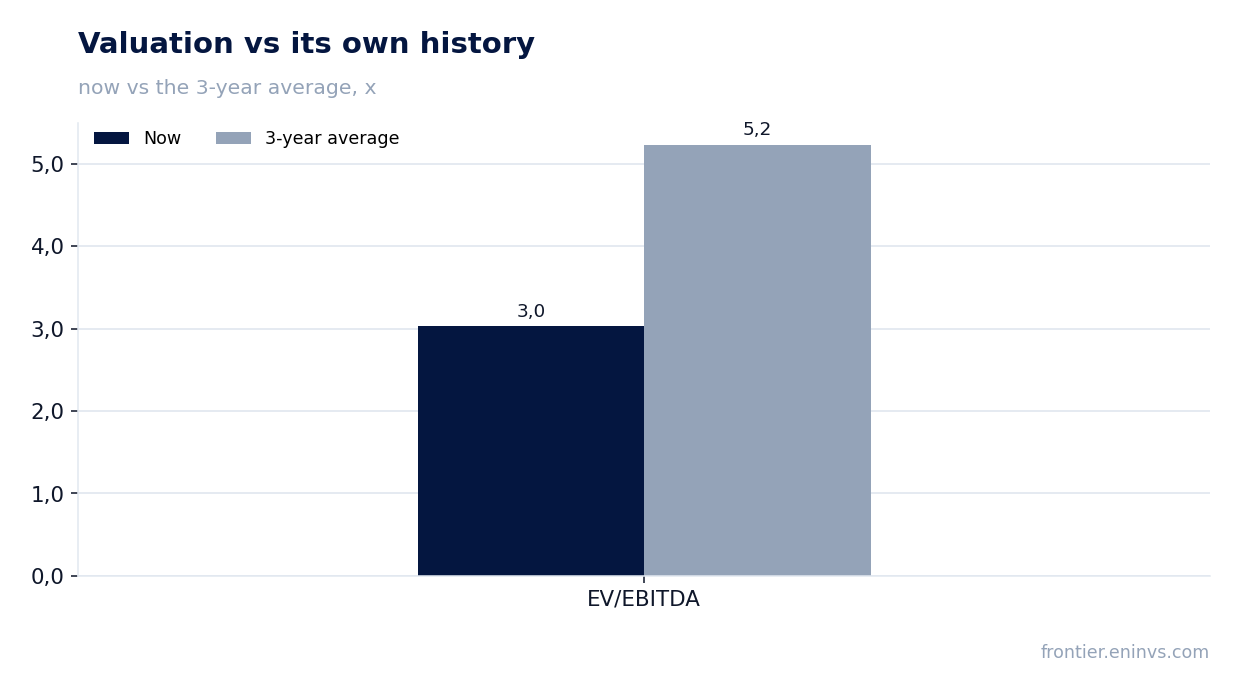
EV/EBITDA of 3.0 versus its own three-year average of 5.2 – the stock is 42% cheaper than its history
The EV/EBITDA LTM multiple is 3.0 against its own three-year average of 5.2. The stock trades 42% below its historical valuation. On this measure the share looks cheap, and that is the main argument for investment appeal.
However, the low multiple is explained by the capital structure: a significant part of the company's value is debt. With a market capitalisation of USD 3,540.4 mn and net debt of USD 4,711.6 mn, enterprise value (EV) is about USD 8,252 mn. The market values equity low because it sees risks tied to debt and earnings volatility.
On the portal's model, re-pricing EBITDA to current commodity prices at the target EV/EBITDA implies upside to fair value of +32%. This is our own estimate, not a market consensus. It shows that if EBITDA stabilises and the current multiple holds, the stock could rise, but delivery of that scenario depends on the durability of operating results.
Valuation on the latest reported figures
| Metric | Value |
|---|---|
| Market cap | 3.54 bn USD |
| P/E (LTM) | 57.0 |
| EV/EBITDA (LTM) | 3.0 |
| P/B | 0.69 |
| Net debt / EBITDA (LTM) | 1.63 |
| Operating cash flow (LTM) | 2.10 bn |
| ROE | -0.2% |
| Dividend yield (12m) | 3.6% |
| EV/EBITDA, 3-year average | 5.2 |
Bottom line
The strong side of the report was revenue growth of 55.9% and EBITDA growth of 159.3% with a 63.2% margin. However, net profit stayed at zero, and debt rose by USD 1.5 bn over the year. The stock is cheap on an EV/EBITDA of 3.0 against a historical average of 5.2, and the portal's model implies +32% upside, but realising that potential requires sustainable profit, which is not yet there. The verdict is neutral: the 3.6% dividend yield and the low multiple are attractive, but weak net profit and debt load balance those positives.
Open the company's financial profile CRGY →
See also: market overview · valuation map · stock screeners