Chevron: profit tripled on refining margins, but the share trades above its own history
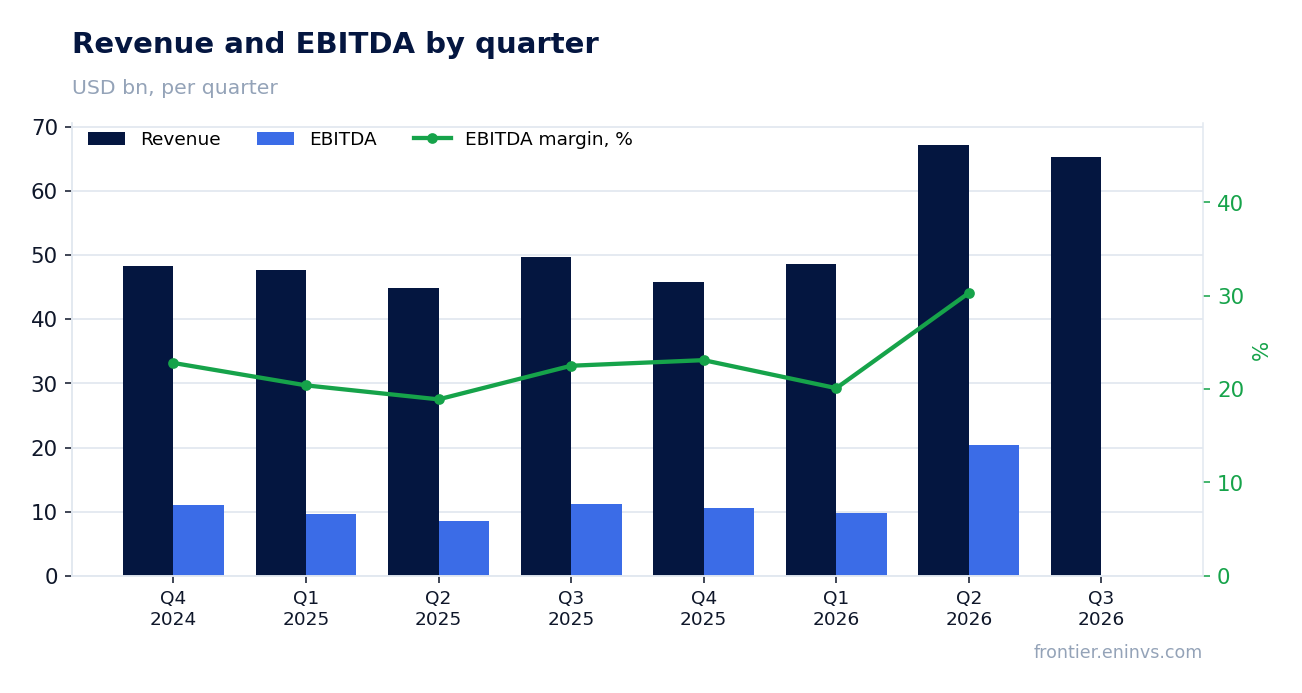
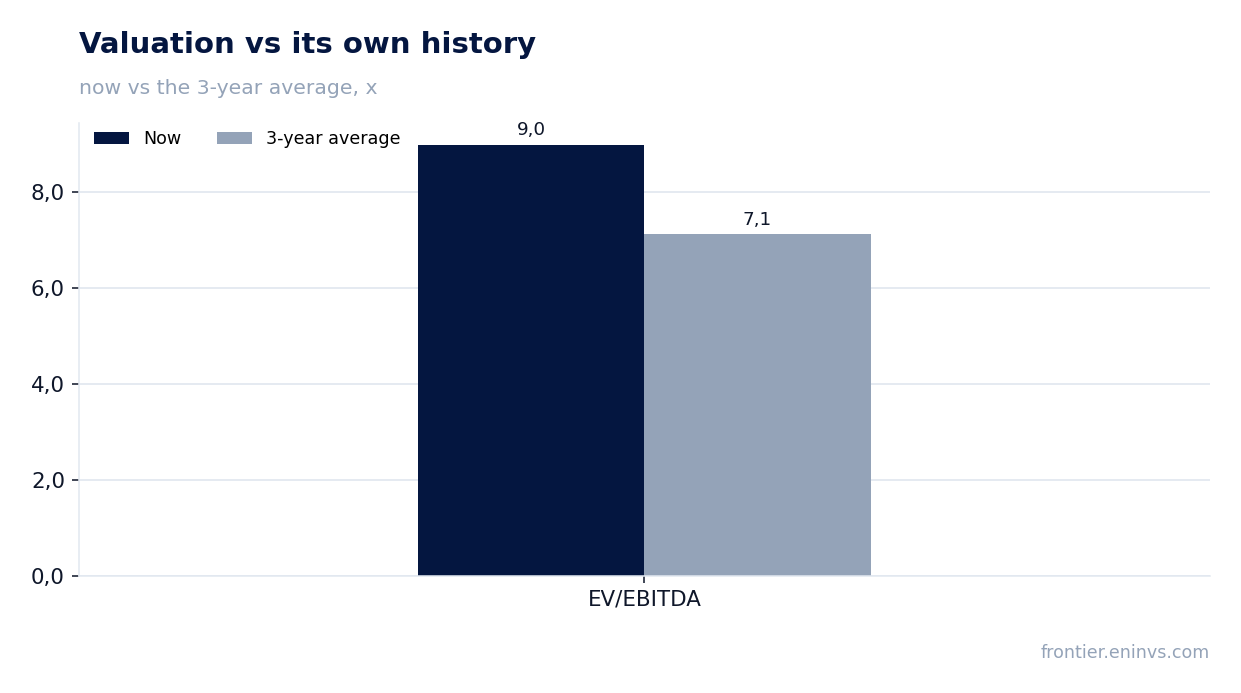
On October 30, Chevron reported third-quarter 2026 results. Revenue came in at $65,237 million (+31.2% year on year), net profit at $9,924 million (+180.4%), and operating cash flow at $16,014 million. Profit was lifted by refined-product margins and crude realisations rather than by volumes: production actually declined. At the current price the share looks neutral – the EV/EBITDA multiple of 9.0 sits above its own three-year average of 7.1, and the portal model implies -55% to fair value.
Key takeaways
— Revenue rose 31.2% without volume growth: production fell to 3,980 mboe/d
— Profit tripled to $9,924 million, and $4,931 million of it came from downstream
— U.S. downstream earnings rose 5.6x to $3,585 million
— One-offs and timing effects took $294 million off profit, but adjusted earnings still reached $10,361 million
— Free cash flow of $12,003 million covers dividends and buybacks together
— The $1.78 dividend at a 3.0% yield sits below the risk-free rate
— EV/EBITDA of 9.0 versus its own three-year average of 7.1 – the share is 26% above its own history
Attractiveness
Key figures, USD bn
| Metric | Q3 2025 | Q3 2026 | Change |
|---|---|---|---|
| Revenue | 49.7 | 65.2 | +31.2% |
| EBITDA | 11.2 | — | — |
| Operating profit | 5.41 | — | — |
| Net profit | 3.54 | 9.92 | +180.4% |
| Operating cash flow | 9.38 | 16.0 | +70.6% |
| Capex | 4.44 | — | — |
| EBITDA margin | 22.5% | — | — |
| Net margin | 7.1% | 15.2% | +8.1 pp |
Revenue rose 31.2% without volume growth: production fell to 3,980 mboe/d
Third-quarter 2026 revenue was $65,237 million versus $49,726 million a year earlier. The 31.2% increase came almost entirely from price: average Brent spot rose to $97 per barrel from $69 a year earlier. Production volumes fell to 3,980 mboe/d from 4,086 mboe/d.
The company attributes the production decline to lower entitlements at higher prices and the impact of the Middle East conflict. This was partly offset by record production at operated assets in Australia, growth in the Gulf of America, and one month of Venezuela production after the switch to equity accounting.
For an investor this means operating leverage cuts both ways: if prices reverse, revenue will contract faster than it grew, because physical volumes are already falling. The 31.2% revenue growth is price-driven, not volume-driven.
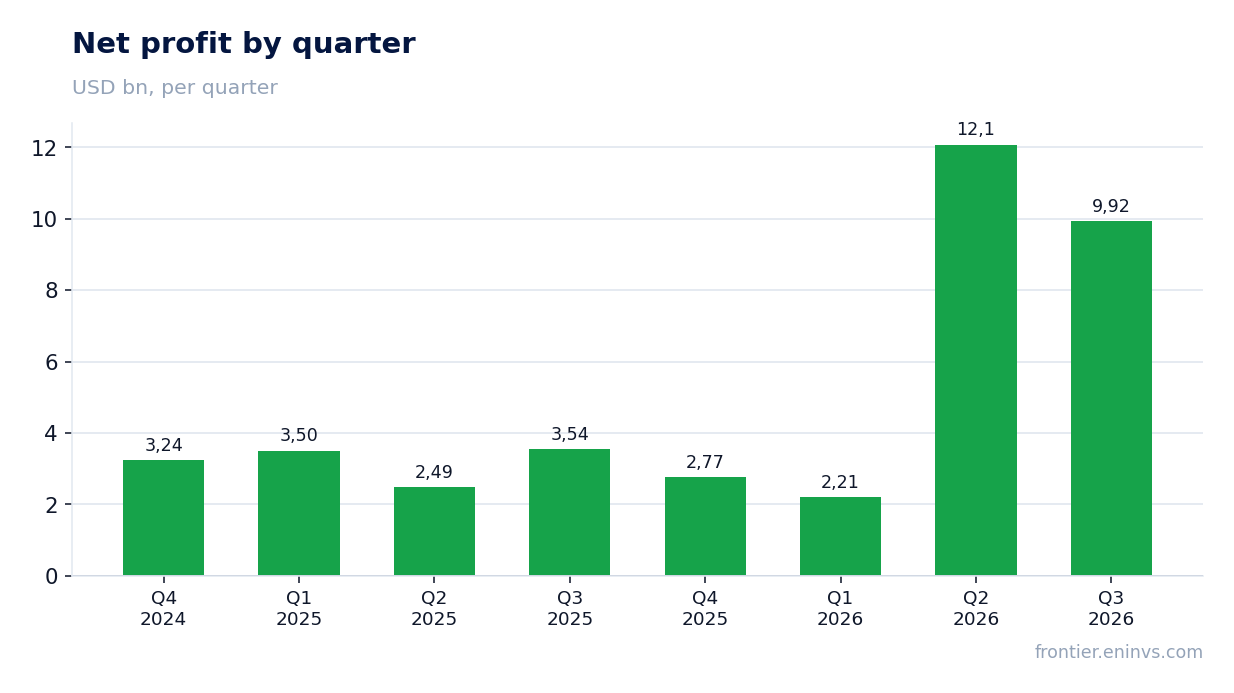
Profit tripled to $9,924 million, and $4,931 million of it came from downstream
Third-quarter 2026 net profit was $9,924 million versus $3,539 million a year earlier. Downstream contributed $4,931 million – more than the entire company earned a year ago. A year earlier the segment brought in only $1,137 million.
Within downstream, the U.S. business earned $3,585 million versus $638 million a year earlier, and international earned $1,346 million versus $499 million. Upstream contributed $5,698 million versus $3,302 million: growth there is real but more modest than in refining.
This profit mix matters for durability: refining margins are historically cyclical and compress faster than crude prices. A quarter with $9,924 million of profit is a margin peak, not a new normal.
U.S. downstream earnings rose 5.6x to $3,585 million
U.S. downstream earned $3,585 million versus $638 million a year earlier. The company attributes this to higher margins on refined product sales. Refinery crude unit throughput set a record of 1.09 million barrels per day at 98% utilisation.
International downstream also rose, to $1,346 million, but refined product sales there fell 9% on supply disruptions tied to the Middle East conflict. Part of the profit therefore came from tighter supply, not stronger demand.
Record throughput at near-full utilisation means there is no room to raise output without new capacity. The next quarter will show whether the margin holds once U.S. gasoline demand seasonally fades.
One-offs and timing effects took $294 million off profit, but adjusted earnings still reached $10,361 million
Reported profit of $9,924 million includes $294 million of one-offs: a $160 million legal reserve, a $110 million impairment and $24 million of pension settlement costs. Adjusted earnings were $10,361 million, or $5.28 per share versus $5.06 reported.
Separately, the company shows timing effects of minus $1,580 million: mark-to-market on derivatives before physical delivery and the LIFO inventory impact. In the prior quarter these added $1,540 million, so the sign has flipped.
The one-offs are small relative to profit, but the $1,580 million timing effect is a quarter of quarterly earnings. It reverses in later periods, so reported profit cannot be mechanically annualised.
Free cash flow of $12,003 million covers dividends and buybacks together
Third-quarter operating cash flow was $16,014 million versus $9,385 million a year earlier. Capital expenditure fell to $4,011 million from $4,444 million, mainly on lower Permian spending. Free cash flow reached $12,003 million.
Dividends absorbed $3,482 million and buybacks $2,502 million, $5,984 million combined. Free cash flow therefore covers both payouts almost twice over. The company also repaid $3,530 million of debt in the quarter.
Adjusted free cash flow is even higher at $14,243 million: it includes a $1 billion TCO loan repayment and asset-sale proceeds. Without those inflows the figure would be smaller, but it remains strong either way.
The $1.78 dividend at a 3.0% yield sits below the risk-free rate
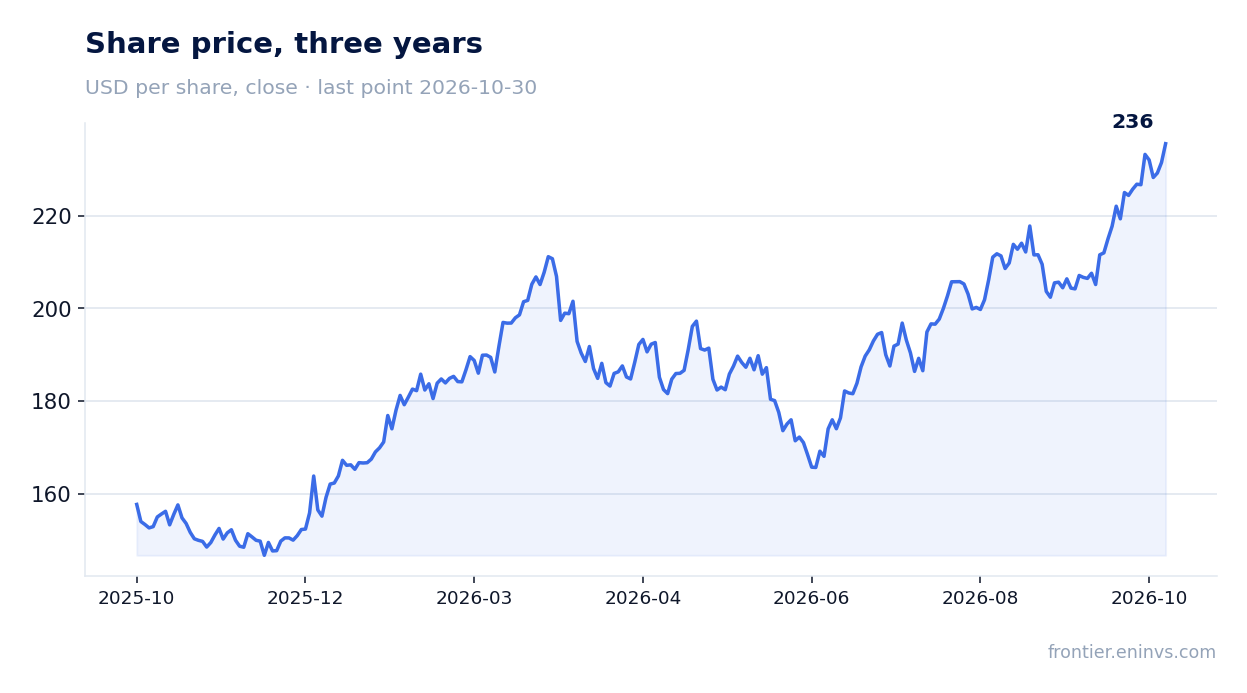
The board declared a quarterly dividend of $1.78 per share, payable December 10, 2026. At the current price that is a trailing yield of about 3.0%. The payout is covered: dividends absorbed $3,482 million in the quarter against free cash flow of $12,003 million.
Our estimate for the 2026 dividend is about $7.1 per share, based on four quarterly payments of $1.78. It rests on earnings: adjusted profit for the nine months is already $25,131 million, and payouts take less than half of free cash flow.
A 3.0% yield is thinner than risk-free instruments, and that is the main argument against the share as a dividend story. A fall in refining margins could cut the payout: refining, not upstream, delivered most of this quarter's profit growth.
EV/EBITDA of 9.0 versus its own three-year average of 7.1 – the share is 26% above its own history
On a trailing twelve-month basis EV/EBITDA is 9.0 against its own three-year average of 7.1. The share trades 26% above its own history on this multiple. The trailing P/E is 16.2 and return on equity is 20.7%.
The portal model, which re-prices EBITDA at current commodity prices at the target multiple, implies minus 55% to fair value. This is our own estimate, not a market consensus. It rests on current profit being supported by peak refining margins.
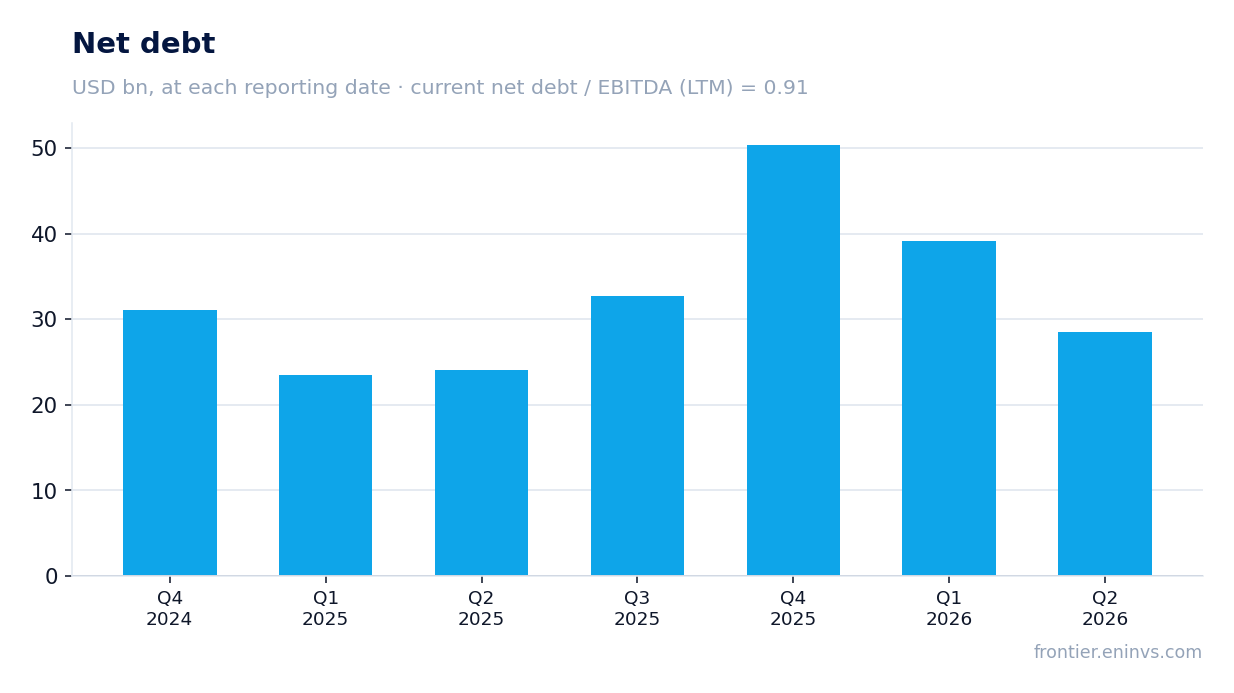
Leverage is moderate: net debt to trailing EBITDA is 0.91. We do not judge the direction of the ratio because the facts do not include its earlier value. The absolute debt level did fall – the company repaid $3,530 million in the quarter.
Valuation on the latest reported figures
| Metric | Value |
|---|---|
| Market cap | 437 bn USD |
| P/E (LTM) | 16.2 |
| EV/EBITDA (LTM) | 9.0 |
| P/B | 2.34 |
| Net debt / EBITDA (LTM) | 0.91 |
| Operating cash flow (LTM) | 52.0 bn |
| ROE | 20.7% |
| Dividend yield (12m) | 3.0% |
| EV/EBITDA, 3-year average | 7.1 |
Bottom line
What was genuinely strong was everything cash-related: free cash flow of $12,003 million covers dividends and buybacks almost twice over, and debt is falling. But the $9,924 million profit rests on record refining margins and high prices, while production is declining. The share trades 26% above its own three-year history on EV/EBITDA, and the portal model implies -55%. The question for a holder now is whether refining margins hold once seasonal demand fades – that determines whether profit stays at this quarter's level.
Open the company's financial profile CVX →
See also: market overview · valuation map · stock screeners