Equinor: revenue up 26.6%, but almost all profit absorbed by depreciation and taxes
On 30 October Equinor reported results for the third quarter of 2026. Revenue came in at USD 32.9 bn, up 26.6% year on year, EBITDA at USD 14.8 bn (+71.6%), and net profit at USD 2.5 bn versus a loss a year earlier. The EBITDA margin rose to 45.0% from 33.2%, while net debt declined to USD 19.1 bn from 20.3 bn at the end of June. The share looks neutral: the EV/EBITDA multiple is above its own three-year history, and the portal model points to a downside of 37%.
Key takeaways
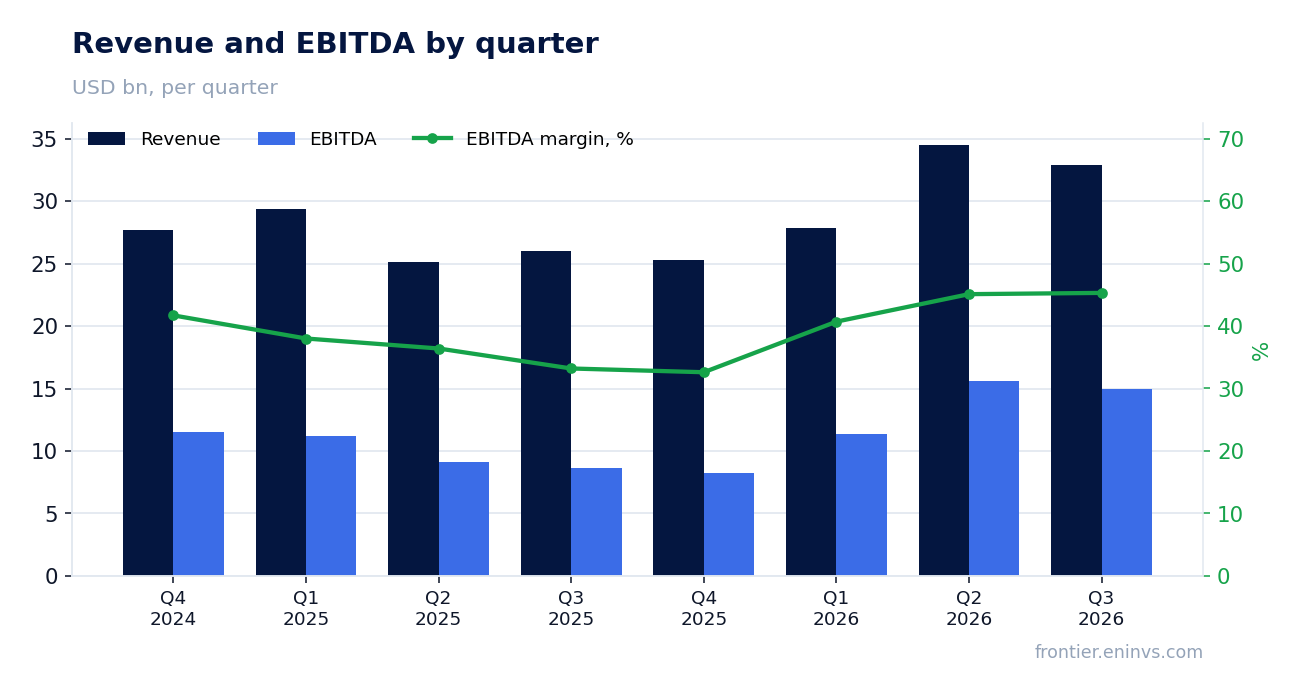
— Revenue grew 26.6% year on year, but the pace decelerated from 37.4% in the second quarter
— EBITDA rose 71.6% as the margin recovered to 45.0% from 33.2%
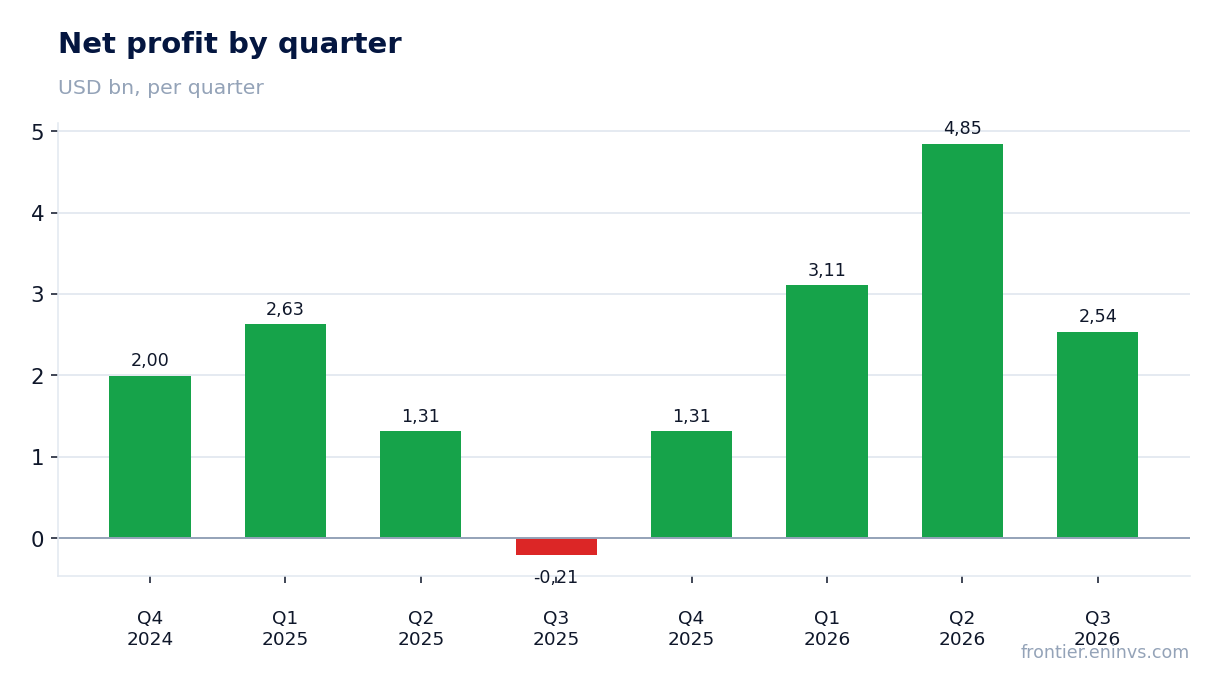
— Net profit of USD 2.5 bn was only 7.7% of revenue due to high depreciation and taxes
— Free cash flow after capex remained modest at USD 4.7 bn with capital expenditures of USD 2.9 bn
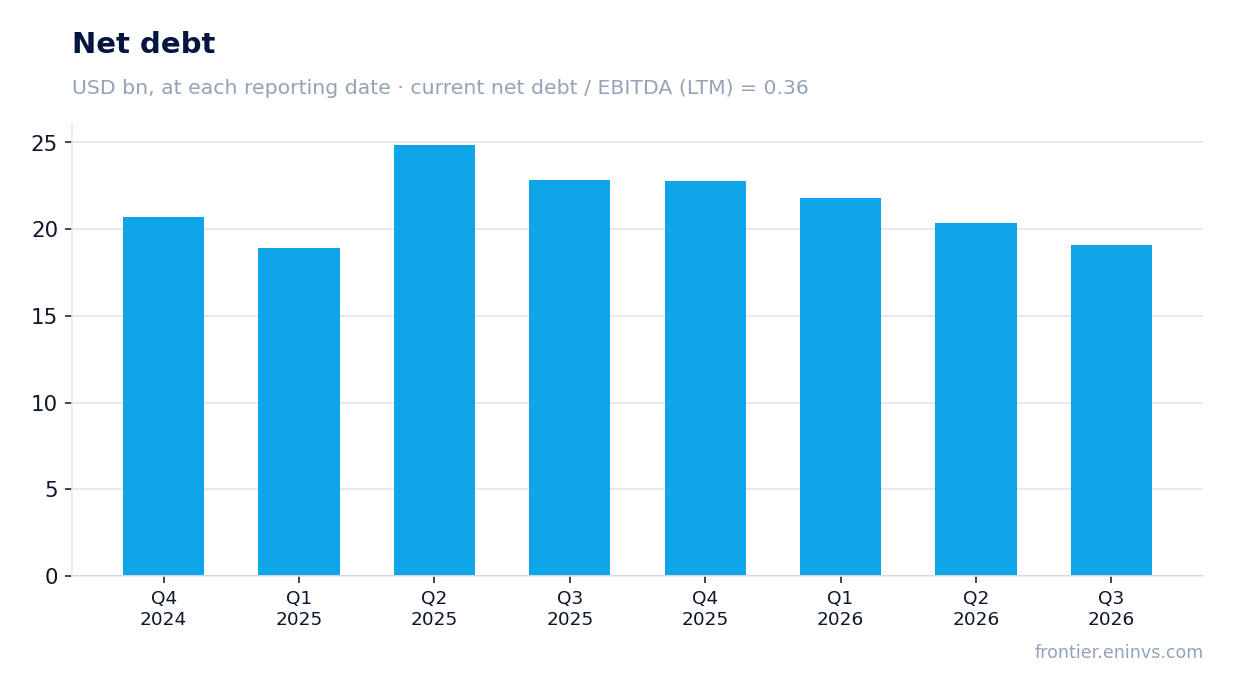
— Net debt declined to USD 19.1 bn from 20.3 bn at the end of June and from 22.8 bn a year earlier
— The dividend yield of 3.2% is below that of comparable securities and does not compensate for the premium to history on the multiple
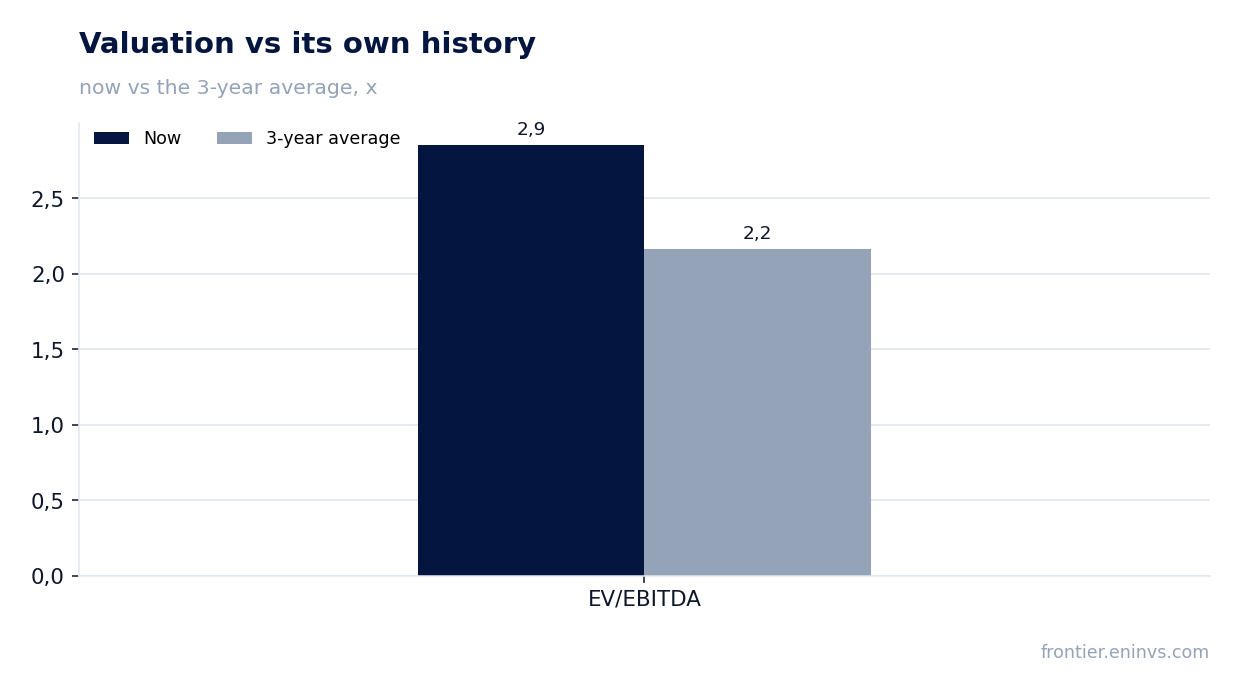
— EV/EBITDA of 2.9 is 32% above its own three-year average of 2.2, limiting re-rating potential
Attractiveness
Key figures, USD bn
| Metric | Q3 2025 | Q3 2026 | Change |
|---|---|---|---|
| Revenue | 26.0 | 32.9 | +26.6% |
| EBITDA | 8.64 | 14.8 | +71.6% |
| Operating profit | 5.27 | 11.8 | +124.4% |
| Net profit | -0.21 | 2.54 | to profit |
| Operating cash flow | 6.35 | 7.55 | +18.9% |
| Capex | 3.42 | 2.87 | -16.0% |
| EBITDA margin | 33.2% | 45.0% | +11.8 pp |
| Net margin | -0.8% | 7.7% | +8.5 pp |
Revenue grew 26.6% year on year, but the pace decelerated from 37.4% in the second quarter
In the third quarter of 2026, Equinor's revenue reached USD 32.9 bn, up 26.6% from the same quarter last year. Growth remains strong but is noticeably slower than in the second quarter, when revenue rose 37.4% year on year. The deceleration reflects lower hydrocarbon prices in July–September compared with April–June, while production volumes did not offset the decline.
The sequential dynamics also point to cooling: revenue fell from USD 34.5 bn in the second quarter to 32.9 bn in the third. This is the first sequential decline in the last three quarters. Nevertheless, year on year the company remains in positive territory, and the current revenue level exceeds that of any quarter in 2025.
EBITDA rose 71.6% as the margin recovered to 45.0% from 33.2%
EBITDA in the reported quarter reached USD 14.8 bn, up 71.6% year on year. This outperformance relative to revenue is explained by margin recovery: the EBITDA margin rose to 45.0% from 33.2% a year earlier. The main driver was higher gas prices in Europe and lower operating costs following the completion of scheduled maintenance.
The 45.0% margin is the highest level in at least eight quarters. For comparison, in the second quarter of 2026 the margin was around 45.1%, meaning the company held it at a high level despite lower revenue. This suggests that operating efficiency improved, not just price conditions.
Net profit of USD 2.5 bn was only 7.7% of revenue due to high depreciation and taxes
Equinor's net profit in the third quarter was USD 2.5 bn versus a loss of USD 0.2 bn a year earlier. The net margin reached 7.7%, whereas a year ago it was negative. However, compared with operating profit of USD 11.8 bn, net profit looks modest: the USD 9.3 bn gap is explained by depreciation, interest expenses and taxes.
Such low conversion of EBITDA into net profit is a characteristic feature of the capital-intensive oil and gas business. Depreciation of fixed assets and income tax in Norway and other jurisdictions consume a significant portion of operating profit. As a result, despite the strong operating result, net profit of USD 2.5 bn was lower than in the first and second quarters of 2026 (USD 3.1 bn and 4.8 bn respectively).
Free cash flow after capex remained modest at USD 4.7 bn with capital expenditures of USD 2.9 bn
Operating cash flow in the third quarter was USD 7.5 bn, while capital expenditures were USD 2.9 bn. Thus, free cash flow after capex is approximately USD 4.7 bn. This is lower than in the second quarter, when operating cash flow reached USD 9.5 bn with the same capital expenditures.
The decline in operating cash flow is due to an increase in working capital and tax payments. At the same time, capital expenditures remain stable at around USD 2.9 bn for two consecutive quarters, in line with the approved investment programme. For shareholders, this means that after funding investments, about USD 4.7 bn remains for dividends and debt reduction.
Net debt declined to USD 19.1 bn from 20.3 bn at the end of June and from 22.8 bn a year earlier
Equinor's net debt as of 30 September 2026 was USD 19.1 bn, down from USD 20.3 bn on 30 June 2026 (a decrease of USD 1.3 bn) and from USD 22.8 bn on 29 September 2025 (a decrease of USD 3.8 bn). The reduction in debt came from free cash flow, which the company directed towards repaying obligations.
The net debt to EBITDA ratio over the last twelve months is 0.36. This is a low level, indicating a comfortable debt burden. However, it cannot be compared with previous values, as the provided data do not contain earlier values of this ratio. One can only state that the current debt level does not pose risks to financial stability.
The dividend yield of 3.2% is below that of comparable securities and does not compensate for the premium to history on the multiple
Equinor's dividend yield over the last twelve months is 3.2%. The company pays dividends quarterly, and the current payout level corresponds to approximately 3.2% of the market capitalisation of USD 124.0 bn. For the oil and gas sector, this is a modest figure: many competitors have yields above 4–5%.
Our forecast for the 2026 dividend is based on a conservative scenario: with current profit and a payout ratio of around 60%, the annual dividend could be approximately USD 2.0 per share, giving a yield of about 3.5% to the current price. However, this forecast depends on hydrocarbon prices and may be revised if they decline. The main risk to the dividend is EBITDA falling below USD 40 bn per year, which is unlikely under current conditions.
EV/EBITDA of 2.9 is 32% above its own three-year average of 2.2, limiting re-rating potential
The EV/EBITDA multiple over the last twelve months is 2.9. This is 32% above its own three-year average of 2.2. Thus, the share trades more expensively than usual relative to its history. For an investor, this means that the current price already reflects the profit recovery and leaves little room for growth.
The portal model, which re-prices EBITDA at current commodity prices and the target EV/EBITDA, points to a downside to fair value of minus 37%. This is our own estimate, not a market consensus. It reflects both the premium to the historical multiple and a possible decline in hydrocarbon prices. At the same time, the P/E ratio over the last twelve months is 10.5, which does not look excessive but does not compensate for the downside risk.
Valuation on the latest reported figures
| Metric | Value |
|---|---|
| Market cap | 124 bn USD |
| P/E (LTM) | 10.5 |
| EV/EBITDA (LTM) | 2.9 |
| P/B | 3.07 |
| Net debt / EBITDA (LTM) | 0.36 |
| Operating cash flow (LTM) | 24.3 bn |
| ROE | 23.1% |
| Dividend yield (12m) | 3.2% |
| EV/EBITDA, 3-year average | 2.2 |
Bottom line
The report's strengths are the margin recovery to 45.0% and the reduction of net debt to USD 19.1 bn. However, net profit of USD 2.5 bn was low due to high depreciation and taxes, and free cash flow after capex was only USD 4.7 bn. The key question for a holder is whether they are willing to pay a 32% premium to the historical multiple with a dividend yield of 3.2% and a 37% downside according to the portal model. We rate the share as neutral: the current price fairly reflects the profit recovery but leaves no room for growth.
Open the company's financial profile EQNR →
See also: market overview · valuation map · stock screeners