Ero Copper: copper up a third, but EBITDA doubled – volumes and costs did more than price
Contents
On 11 November Ero Copper reported third-quarter 2026 results. The average copper price in the period was 14,408 USD against 10,825 USD a year earlier (+33.1%), and gold rose 23.4%. At the year-ago volumes and costs, our calculation shows those prices would have produced revenue of 233.6 million USD and EBITDA of 125.1 million USD; the company reported revenue of 348.0 million USD and EBITDA of 188.4 million USD – beyond the price effect it earned another 63.3 million USD of EBITDA. Our conclusion: rather attractive – on the portal's model the upside to fair value is +52%. Our view: the share is rather attractive at the current price; upside on the portal model +52%.
Our view: is there upside
Our view in numbers
| Metric | Our read |
|---|---|
| Verdict | Rather attractive |
| Upside on the portal model | +52% |
| How the model works | spot model: EBITDA re-priced to current commodity prices at the target EV/EBITDA, against market cap |
| EV/EBITDA now and 3-year average | 6.6 vs 16.8 – a 60% discount to its history |
| Net debt / EBITDA | 0.63 – low leverage |
| Strongest case for | A 60% discount to its own three-year average EV/EBITDA (6.6 against 16.8) and +52% upside on the portal's model with leverage of just 0.63 EBITDA LTM. |
| Strongest case against | Spot copper at 13,997 USD is already 2.9% below the reported-period average, and if the price stays there the price effect in the next quarter will weaken. |
| What would change the view | Copper holding above 14,500 USD would lift the verdict to attractive, while a sustained move below 13,000 USD would lower it to neutral. |
Key takeaways
— Copper rose 33.1% year on year, but price alone explains only half of the EBITDA increase
— Beyond the price effect the company earned another 63.3 million USD of EBITDA – that is volumes, realised price and costs
— Revenue grew 96.5% year on year and accelerated from 73.9% a quarter earlier
— The EBITDA margin rose to 54.1% from 38.7%, and that is not only the metal price
— Leverage of 0.63 EBITDA LTM is a level that holds up even at today's prices
— EV/EBITDA of 6.6 against its own three-year average of 16.8 – a 60% discount to its own history
— On the portal's model the share stands 52% below fair value at current metal prices
Key figures, USD bn
| Metric | Q3 2025 | Q3 2026 | Change |
|---|---|---|---|
| Revenue | 0.18 | 0.35 | +96.5% |
| EBITDA | 0.07 | 0.19 | +174.9% |
| Operating profit | 0.04 | 0.15 | +290.8% |
| Net profit | 0.04 | 0.12 | +223.1% |
| Operating cash flow | 0.11 | 0.19 | +73.4% |
| Capex | 0.08 | 0.08 | -1.6% |
| EBITDA margin | 38.7% | 54.1% | +15.4 pp |
| Net margin | 20.3% | 33.4% | +13.1 pp |
Copper rose 33.1% year on year, but price alone explains only half of the EBITDA increase
The average copper price in the third quarter of 2026 was 14,408 USD against 10,825 USD a year earlier, a gain of 33.1%. Against the previous quarter copper rose 5.3%, from 13,682 USD. Gold, which accounts for 12% of sales, averaged 4,268 USD against 3,459 USD a year earlier (+23.4%), but fell 5.5% against the previous quarter.
Spot is now below the reported-period average: copper at 13,997 USD on 11 November (–2.9%), gold at 4,045 USD (–5.2%). That does not change the quarter's picture but sets the base for the next report: if prices stay here, the price tailwind will be weaker.
At the year-ago volumes and non-commodity costs and with only the new prices, our calculation puts revenue at 233.6 million USD – a price effect of +56.5 million USD, or +31.9%. EBITDA on the same basis would have been 125.1 million USD. Price is a large but not the only factor in the result.
Commodity prices: period average and now
| Benchmark | Year ago | Q3 2026 | YoY | Spot 2026-11-11 |
|---|---|---|---|---|
| Copper, USD | 10 825 | 14 408 | +33,1% | 13 997 |
| Gold, USD | 3 459 | 4 268 | +23,4% | 4 045 |
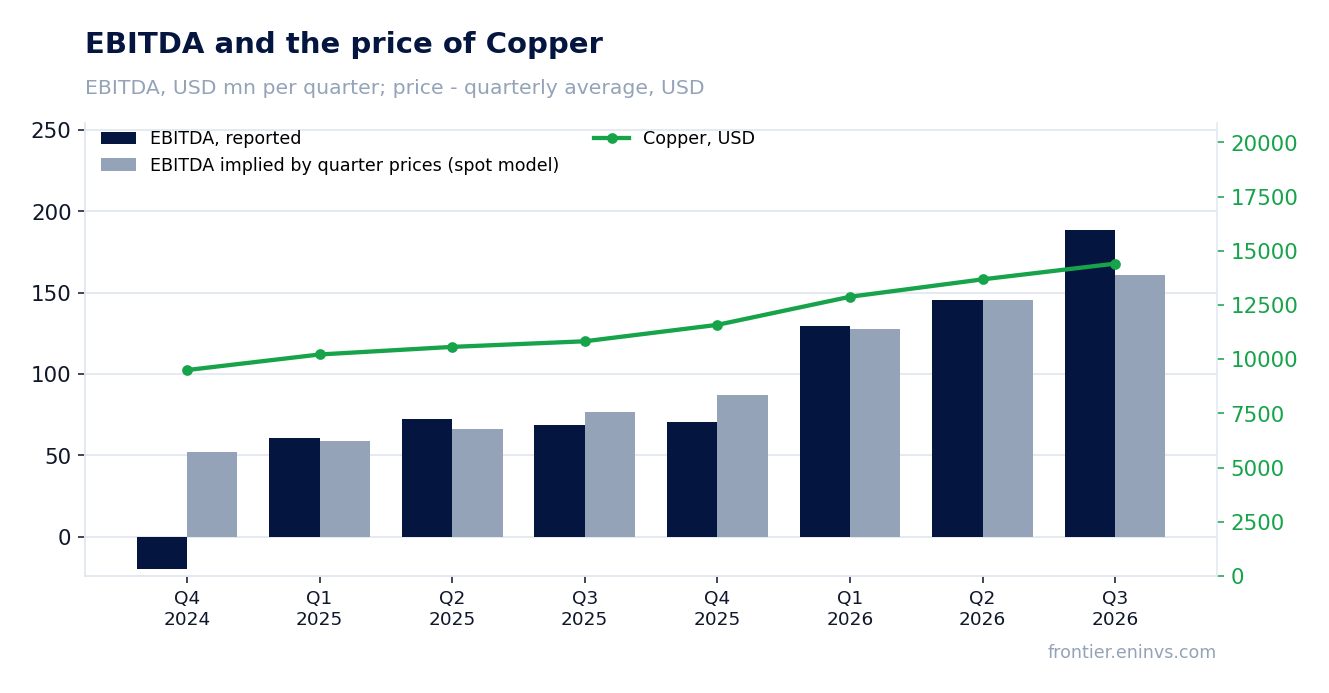
Beyond the price effect the company earned another 63.3 million USD of EBITDA – that is volumes, realised price and costs
Reported EBITDA for the third quarter of 2026 was 188.4 million USD against 125.1 million USD on our calculation at old volumes and costs. The gap of 63.3 million USD, or 50.6% beyond the price effect, is what the company did itself: produced more, sold better or produced cheaper.
Reported revenue was 348.0 million USD against 233.6 million USD on the calculation, a gap of 114.4 million USD (+49.0%). Revenue grows faster than EBITDA in absolute terms, yet the EBITDA margin rose to 54.1% from 38.7% a year earlier – so the added volumes and revenue came at a high margin, not through expensive purchases.
The portal's spot model, built from the average of the previous four quarters, expected EBITDA of 161 million USD and revenue of 302.3 million USD. The actual came in 17.0% and 15.1% above. In the four prior periods the deviation of actual from the model was –10.4%, +71.2%, +1.4% and –0.2%, so the model errs in both directions, and today's beat is the mark of a strong quarter rather than an anomaly.
What the prices implied and what the company earned
| Base (Q3 2025) | Implied at period prices | Reported | Reported vs implied | |
|---|---|---|---|---|
| Revenue, USD mn | 177,1 | 233,6 | 348,0 | +49,0% |
| EBITDA, USD mn | 68,5 | 125,1 | 188,4 | +50,6% |
| EBITDA, portal spot model, USD mn | — | 161,0 | 188,4 | +17,0% |
Revenue and EBITDA by quarter
| Period | Measure | bn USD |
|---|---|---|
| Q4 2024 | Revenue | 0.122539 |
| Q1 2025 | Revenue | 0.125088 |
| Q2 2025 | Revenue | 0.16351 |
| Q3 2025 | Revenue | 0.177092 |
| Q4 2025 | Revenue | 0.320154 |
| Q1 2026 | Revenue | 0.26317 |
| Q2 2026 | Revenue | 0.284313 |
| Q3 2026 | Revenue | 0.348034 |
| Q4 2024 | EBITDA | −0.0201 |
| Q1 2025 | EBITDA | 0.060757000000000005 |
| Q2 2025 | EBITDA | 0.072315 |
| Q3 2025 | EBITDA | 0.068543 |
| Q4 2025 | EBITDA | 0.0705 |
| Q1 2026 | EBITDA | 0.12975299999999998 |
| Q2 2026 | EBITDA | 0.145537 |
| Q3 2026 | EBITDA | 0.18839999999999998 |
EBITDA margin
| Period | Measure | % |
|---|---|---|
| Q4 2024 | EBITDA margin | −16.4 |
| Q1 2025 | EBITDA margin | 48.6 |
| Q2 2025 | EBITDA margin | 44.2 |
| Q3 2025 | EBITDA margin | 38.7 |
| Q4 2025 | EBITDA margin | 22.0 |
| Q1 2026 | EBITDA margin | 49.3 |
| Q2 2026 | EBITDA margin | 51.2 |
| Q3 2026 | EBITDA margin | 54.1 |
Revenue grew 96.5% year on year and accelerated from 73.9% a quarter earlier
Third-quarter 2026 revenue was 348.0 million USD, 96.5% more than a year earlier. In the second quarter growth was 73.9%, in the first 110.4%, in the fourth quarter of 2025 161.3%. Growth accelerated against the second quarter but remains below the peak of late 2025.
The acceleration against the second quarter is driven mainly by price: copper rose 5.3% quarter on quarter, whereas a quarter earlier the comparison was against a lower base. Our calculation shows price alone would have added 11.4 million USD of revenue (+4.0%) quarter on quarter, while the actual came in 52.3 million USD above the calculation (+17.7%) – the rest came from volumes and realised price.
The quarterly revenue path – 263.2 million USD in the first quarter, 284.3 million USD in the second and 348.0 million USD in the third – shows growth coming steadily over three consecutive quarters rather than in a single jump.
The EBITDA margin rose to 54.1% from 38.7%, and that is not only the metal price
The EBITDA margin in the reported quarter was 54.1% against 38.7% a year earlier, a gain of 15.4 percentage points. Operating profit was 145.3 million USD and EBITDA 188.4 million USD: the 43.1 million USD difference is depreciation, the wear of fixed assets, not a cash cost.
If the margin had risen on price alone, the price effect of 56.5 million USD of revenue would have produced roughly the same EBITDA gain, but actual EBITDA is 63.3 million USD above the calculation – so each dollar of revenue carried less cost than a year earlier. The cause is volumes and unit costs, not price as such.
Net profit in the reported quarter was 116.2 million USD, a net margin of 33.4% against 20.3% a year earlier. Profit growth of 223.1% outpaces EBITDA growth of 174.9%: below operating profit, items outside EBITDA – interest expense and other income and charges – did the work.
Leverage of 0.63 EBITDA LTM is a level that holds up even at today's prices
Net debt at 30 September 2026 was 353.5 million USD against EBITDA of 560.3 million USD over the last twelve months, a ratio of 0.63. That is a level at which the company services its debt from current cash flow without strain.
Operating cash flow in the reported quarter was 191.2 million USD and capital expenditure 75.4 million USD. The 115.8 million USD difference is free cash flow before interest and tax, which covers both debt service and reinvestment in production.
At current metal prices the portal's model gives EBITDA of 639.3 million USD against 613.2 million USD over the last twelve months (+4.3%), EV/EBITDA of 5.5 and net debt at 0.55 EBITDA. Even without a price rise, leverage stays below one, and at today's prices it is lower still.
Valuation vs its own history
now vs the 3-year average
| Period | Measure | × |
|---|---|---|
| EV/EBITDA | Now | 6.640514360612198 |
| EV/EBITDA | 3-year average | 16.763205307116312 |
EV/EBITDA of 6.6 against its own three-year average of 16.8 – a 60% discount to its own history
EV/EBITDA over the last twelve months is 6.6, while its own three-year average for this multiple is 16.8. A 60% discount: the market values today's EBITDA far cheaper than it did on average over three years. P/E over the last twelve months is 8.1 and return on equity 36.5%.
Part of that discount reflects the fact that last-twelve-month earnings were earned at high copper prices, and the market is pricing in a possible decline. Spot copper at 13,997 USD is already 2.9% below the reported-period average, and that weighs on the multiple.
On the portal's model, which re-prices EBITDA at current metal prices and the target EV/EBITDA, the share's fair value is 52% above the market price. That is our own estimate, not a market consensus: it rests on current prices, not on quarterly averages.
Share price, three years
close, last point 2026-11-10
| Period | Measure | USD per share |
|---|---|---|
| 2025-11-10 | Closing price | 22.110000610351562 |
| 2025-11-11 | Closing price | 22.280000686645508 |
| 2025-11-12 | Closing price | 22.780000686645508 |
| 2025-11-13 | Closing price | 22.040000915527344 |
| 2025-11-14 | Closing price | 21.520000457763672 |
| 2025-11-17 | Closing price | 21.5 |
| 2025-11-18 | Closing price | 21.239999771118164 |
| 2025-11-19 | Closing price | 21.959999084472656 |
| 2025-11-20 | Closing price | 20.940000534057617 |
| 2025-11-21 | Closing price | 21.600000381469727 |
| 2025-11-24 | Closing price | 22.959999084472656 |
| 2025-11-25 | Closing price | 23.469999313354492 |
| 2025-11-26 | Closing price | 24.18000030517578 |
| 2025-11-28 | Closing price | 25.3700008392334 |
| 2025-12-01 | Closing price | 25.6299991607666 |
| 2025-12-02 | Closing price | 25.010000228881836 |
| 2025-12-03 | Closing price | 25.209999084472656 |
| 2025-12-04 | Closing price | 25.1299991607666 |
| 2025-12-05 | Closing price | 25.0 |
| 2025-12-08 | Closing price | 24.34000015258789 |
| 2025-12-09 | Closing price | 24.420000076293945 |
| 2025-12-10 | Closing price | 25.149999618530273 |
| 2025-12-11 | Closing price | 25.950000762939453 |
| 2025-12-12 | Closing price | 25.270000457763672 |
| 2025-12-15 | Closing price | 25.170000076293945 |
| 2025-12-16 | Closing price | 25.040000915527344 |
| 2025-12-17 | Closing price | 24.959999084472656 |
| 2025-12-18 | Closing price | 25.530000686645508 |
| 2025-12-19 | Closing price | 26.190000534057617 |
| 2025-12-22 | Closing price | 26.829999923706055 |
| 2025-12-23 | Closing price | 27.3700008392334 |
| 2025-12-24 | Closing price | 27.43000030517578 |
| 2025-12-26 | Closing price | 27.979999542236328 |
| 2025-12-29 | Closing price | 27.520000457763672 |
| 2025-12-30 | Closing price | 28.68000030517578 |
| 2025-12-31 | Closing price | 28.290000915527344 |
| 2026-01-02 | Closing price | 29.049999237060547 |
| 2026-01-05 | Closing price | 30.3700008392334 |
| 2026-01-06 | Closing price | 30.5 |
| 2026-01-07 | Closing price | 28.850000381469727 |
| 2026-01-08 | Closing price | 29.09000015258789 |
| 2026-01-09 | Closing price | 29.270000457763672 |
| 2026-01-12 | Closing price | 31.030000686645508 |
| 2026-01-13 | Closing price | 29.829999923706055 |
| 2026-01-14 | Closing price | 30.600000381469727 |
| 2026-01-15 | Closing price | 29.989999771118164 |
| 2026-01-16 | Closing price | 29.520000457763672 |
| 2026-01-20 | Closing price | 30.989999771118164 |
| 2026-01-21 | Closing price | 31.139999389648438 |
| 2026-01-22 | Closing price | 30.93000030517578 |
| 2026-01-23 | Closing price | 32.84000015258789 |
| 2026-01-26 | Closing price | 33.459999084472656 |
| 2026-01-27 | Closing price | 35.380001068115234 |
| 2026-01-28 | Closing price | 36.099998474121094 |
| 2026-01-29 | Closing price | 38.029998779296875 |
| 2026-01-30 | Closing price | 33.5099983215332 |
| 2026-02-02 | Closing price | 34.189998626708984 |
| 2026-02-03 | Closing price | 36.880001068115234 |
| 2026-02-04 | Closing price | 35.2400016784668 |
| 2026-02-05 | Closing price | 31.549999237060547 |
| 2026-02-06 | Closing price | 30.610000610351562 |
| 2026-02-09 | Closing price | 31.770000457763672 |
| 2026-02-10 | Closing price | 30.979999542236328 |
| 2026-02-11 | Closing price | 31.5 |
| 2026-02-12 | Closing price | 30.020000457763672 |
| 2026-02-13 | Closing price | 30.719999313354492 |
| 2026-02-17 | Closing price | 29.93000030517578 |
| 2026-02-18 | Closing price | 30.100000381469727 |
| 2026-02-19 | Closing price | 29.68000030517578 |
| 2026-02-20 | Closing price | 30.149999618530273 |
| 2026-02-23 | Closing price | 31.1299991607666 |
| 2026-02-24 | Closing price | 33.4900016784668 |
| 2026-02-25 | Closing price | 34.369998931884766 |
| 2026-02-26 | Closing price | 34.41999816894531 |
| 2026-02-27 | Closing price | 34.18000030517578 |
| 2026-03-02 | Closing price | 33.38999938964844 |
| 2026-03-03 | Closing price | 30.829999923706055 |
| 2026-03-04 | Closing price | 31.700000762939453 |
| 2026-03-05 | Closing price | 28.920000076293945 |
| 2026-03-06 | Closing price | 27.760000228881836 |
| 2026-03-09 | Closing price | 28.200000762939453 |
| 2026-03-10 | Closing price | 28.09000015258789 |
| 2026-03-11 | Closing price | 28.0 |
| 2026-03-12 | Closing price | 27.309999465942383 |
| 2026-03-13 | Closing price | 26.1200008392334 |
| 2026-03-16 | Closing price | 27.0 |
| 2026-03-17 | Closing price | 26.770000457763672 |
| 2026-03-18 | Closing price | 24.93000030517578 |
| 2026-03-19 | Closing price | 24.1299991607666 |
| 2026-03-20 | Closing price | 23.59000015258789 |
| 2026-03-23 | Closing price | 24.760000228881836 |
| 2026-03-24 | Closing price | 24.700000762939453 |
| 2026-03-25 | Closing price | 25.40999984741211 |
| 2026-03-26 | Closing price | 24.559999465942383 |
| 2026-03-27 | Closing price | 25.049999237060547 |
| 2026-03-30 | Closing price | 24.93000030517578 |
| 2026-03-31 | Closing price | 26.670000076293945 |
| 2026-04-01 | Closing price | 28.049999237060547 |
| 2026-04-02 | Closing price | 28.100000381469727 |
| 2026-04-06 | Closing price | 28.360000610351562 |
| 2026-04-07 | Closing price | 28.799999237060547 |
| 2026-04-08 | Closing price | 30.290000915527344 |
| 2026-04-09 | Closing price | 30.81999969482422 |
| 2026-04-10 | Closing price | 31.149999618530273 |
| 2026-04-13 | Closing price | 32.119998931884766 |
| 2026-04-14 | Closing price | 30.020000457763672 |
| 2026-04-15 | Closing price | 29.719999313354492 |
| 2026-04-16 | Closing price | 29.510000228881836 |
| 2026-04-17 | Closing price | 28.950000762939453 |
| 2026-04-20 | Closing price | 28.389999389648438 |
| 2026-04-21 | Closing price | 26.969999313354492 |
| 2026-04-22 | Closing price | 27.649999618530273 |
| 2026-04-23 | Closing price | 27.270000457763672 |
| 2026-04-24 | Closing price | 27.309999465942383 |
| 2026-04-27 | Closing price | 27.530000686645508 |
| 2026-04-28 | Closing price | 26.399999618530273 |
| 2026-04-29 | Closing price | 25.950000762939453 |
| 2026-04-30 | Closing price | 25.850000381469727 |
| 2026-05-01 | Closing price | 25.209999084472656 |
| 2026-05-04 | Closing price | 24.459999084472656 |
| 2026-05-05 | Closing price | 25.81999969482422 |
| 2026-05-06 | Closing price | 27.06999969482422 |
| 2026-05-07 | Closing price | 27.100000381469727 |
| 2026-05-08 | Closing price | 28.479999542236328 |
| 2026-05-11 | Closing price | 28.969999313354492 |
| 2026-05-12 | Closing price | 31.889999389648438 |
| 2026-05-13 | Closing price | 30.979999542236328 |
| 2026-05-14 | Closing price | 29.920000076293945 |
| 2026-05-15 | Closing price | 27.260000228881836 |
| 2026-05-18 | Closing price | 26.719999313354492 |
| 2026-05-19 | Closing price | 26.3700008392334 |
| 2026-05-20 | Closing price | 26.969999313354492 |
| 2026-05-21 | Closing price | 26.719999313354492 |
| 2026-05-22 | Closing price | 26.979999542236328 |
| 2026-05-26 | Closing price | 28.850000381469727 |
| 2026-05-27 | Closing price | 28.18000030517578 |
| 2026-05-28 | Closing price | 29.860000610351562 |
| 2026-05-29 | Closing price | 30.440000534057617 |
| 2026-06-01 | Closing price | 31.420000076293945 |
| 2026-06-02 | Closing price | 32.20000076293945 |
| 2026-06-03 | Closing price | 30.969999313354492 |
| 2026-06-04 | Closing price | 30.760000228881836 |
| 2026-06-05 | Closing price | 25.780000686645508 |
| 2026-06-08 | Closing price | 26.899999618530273 |
| 2026-06-09 | Closing price | 26.260000228881836 |
| 2026-06-10 | Closing price | 25.780000686645508 |
| 2026-06-11 | Closing price | 27.700000762939453 |
| 2026-06-12 | Closing price | 29.389999389648438 |
| 2026-06-15 | Closing price | 30.709999084472656 |
| 2026-06-16 | Closing price | 30.100000381469727 |
| 2026-06-17 | Closing price | 30.43000030517578 |
| 2026-06-18 | Closing price | 29.75 |
| 2026-06-22 | Closing price | 30.450000762939453 |
| 2026-06-23 | Closing price | 27.75 |
| 2026-06-24 | Closing price | 26.440000534057617 |
| 2026-06-25 | Closing price | 26.3700008392334 |
| 2026-06-26 | Closing price | 26.56999969482422 |
| 2026-06-29 | Closing price | 25.950000762939453 |
| 2026-06-30 | Closing price | 26.75 |
| 2026-07-01 | Closing price | 25.719999313354492 |
| 2026-07-02 | Closing price | 26.209999084472656 |
| 2026-07-06 | Closing price | 26.399999618530273 |
| 2026-07-07 | Closing price | 24.899999618530273 |
| 2026-07-08 | Closing price | 23.84000015258789 |
| 2026-07-09 | Closing price | 25.059999465942383 |
| 2026-07-10 | Closing price | 25.579999923706055 |
| 2026-07-13 | Closing price | 24.649999618530273 |
| 2026-07-14 | Closing price | 25.889999389648438 |
| 2026-07-15 | Closing price | 25.350000381469727 |
| 2026-07-16 | Closing price | 24.520000457763672 |
| 2026-07-17 | Closing price | 24.1299991607666 |
| 2026-07-20 | Closing price | 25.100000381469727 |
| 2026-07-21 | Closing price | 26.8700008392334 |
| 2026-07-22 | Closing price | 27.06999969482422 |
| 2026-07-23 | Closing price | 26.3700008392334 |
| 2026-07-24 | Closing price | 25.979999542236328 |
| 2026-07-27 | Closing price | 26.200000762939453 |
| 2026-07-28 | Closing price | 25.600000381469727 |
| 2026-07-29 | Closing price | 25.280000686645508 |
| 2026-07-30 | Closing price | 27.049999237060547 |
| 2026-07-31 | Closing price | 26.90999984741211 |
| 2026-08-03 | Closing price | 27.3700008392334 |
| 2026-08-04 | Closing price | 29.0 |
| 2026-08-05 | Closing price | 30.43000030517578 |
| 2026-08-06 | Closing price | 31.100000381469727 |
| 2026-08-07 | Closing price | 34.310001373291016 |
| 2026-08-10 | Closing price | 36.540000915527344 |
| 2026-08-11 | Closing price | 36.29999923706055 |
| 2026-08-12 | Closing price | 36.06999969482422 |
| 2026-08-13 | Closing price | 34.369998931884766 |
| 2026-08-14 | Closing price | 33.79999923706055 |
| 2026-08-17 | Closing price | 34.90999984741211 |
| 2026-08-18 | Closing price | 32.970001220703125 |
| 2026-08-19 | Closing price | 34.08000183105469 |
| 2026-08-20 | Closing price | 36.02000045776367 |
| 2026-08-21 | Closing price | 39.41999816894531 |
| 2026-08-24 | Closing price | 38.54999923706055 |
| 2026-08-25 | Closing price | 40.400001525878906 |
| 2026-08-26 | Closing price | 39.2400016784668 |
| 2026-08-27 | Closing price | 39.81999969482422 |
| 2026-08-28 | Closing price | 38.83000183105469 |
| 2026-08-31 | Closing price | 37.130001068115234 |
| 2026-09-01 | Closing price | 34.81999969482422 |
| 2026-09-02 | Closing price | 34.7599983215332 |
| 2026-09-03 | Closing price | 35.31999969482422 |
| 2026-09-04 | Closing price | 34.900001525878906 |
| 2026-09-08 | Closing price | 37.90999984741211 |
| 2026-09-09 | Closing price | 38.25 |
| 2026-09-10 | Closing price | 34.97999954223633 |
| 2026-09-11 | Closing price | 35.470001220703125 |
| 2026-09-14 | Closing price | 33.68000030517578 |
| 2026-09-15 | Closing price | 32.529998779296875 |
| 2026-09-16 | Closing price | 32.279998779296875 |
| 2026-09-17 | Closing price | 33.279998779296875 |
| 2026-09-18 | Closing price | 34.16999816894531 |
| 2026-09-21 | Closing price | 34.70000076293945 |
| 2026-09-22 | Closing price | 37.290000915527344 |
| 2026-09-23 | Closing price | 36.47999954223633 |
| 2026-09-24 | Closing price | 37.11000061035156 |
| 2026-09-25 | Closing price | 37.869998931884766 |
| 2026-09-28 | Closing price | 37.40999984741211 |
| 2026-09-29 | Closing price | 37.13999938964844 |
| 2026-09-30 | Closing price | 36.689998626708984 |
| 2026-10-01 | Closing price | 35.75 |
| 2026-10-02 | Closing price | 37.90999984741211 |
| 2026-10-05 | Closing price | 38.439998626708984 |
| 2026-10-06 | Closing price | 37.93000030517578 |
| 2026-10-07 | Closing price | 36.779998779296875 |
| 2026-10-08 | Closing price | 35.97999954223633 |
| 2026-10-09 | Closing price | 37.61000061035156 |
| 2026-10-12 | Closing price | 37.529998779296875 |
| 2026-10-13 | Closing price | 36.650001525878906 |
| 2026-10-14 | Closing price | 34.459999084472656 |
| 2026-10-15 | Closing price | 34.75 |
| 2026-10-16 | Closing price | 34.15999984741211 |
| 2026-10-19 | Closing price | 34.43000030517578 |
| 2026-10-20 | Closing price | 32.900001525878906 |
| 2026-10-21 | Closing price | 31.989999771118164 |
| 2026-10-22 | Closing price | 30.1299991607666 |
| 2026-10-23 | Closing price | 29.950000762939453 |
| 2026-10-26 | Closing price | 31.209999084472656 |
| 2026-10-27 | Closing price | 32.52000045776367 |
| 2026-10-28 | Closing price | 32.189998626708984 |
| 2026-10-29 | Closing price | 31.1200008392334 |
| 2026-10-30 | Closing price | 29.049999237060547 |
| 2026-11-02 | Closing price | 29.15999984741211 |
| 2026-11-03 | Closing price | 30.440000534057617 |
| 2026-11-04 | Closing price | 30.81999969482422 |
| 2026-11-05 | Closing price | 28.09000015258789 |
| 2026-11-06 | Closing price | 28.860000610351562 |
| 2026-11-09 | Closing price | 31.31999969482422 |
| 2026-11-10 | Closing price | 30.655000686645508 |
On the portal's model the share stands 52% below fair value at current metal prices
The portal's model re-prices EBITDA at current copper and gold prices and values the company at a target EV/EBITDA. At spot copper of 13,997 USD and gold of 4,045 USD on 11 November, EBITDA is 639.3 million USD, EV/EBITDA is 5.5, and the share's fair value is 52% above the market.
The support for that valuation is low leverage: net debt at 0.55 EBITDA at current prices. If debt were higher, the discount to fair value would be smaller. It is the balance sheet that makes the upside achievable, not the metal price alone.
The market, however, values the share at a historical multiple of 6.6 against a three-year average of 16.8. The gap between the model and the market is the question of how durable current copper prices are. The model answers 'enough', the market 'not sure'.
Valuation on the latest reported figures
| Metric | Value |
|---|---|
| Market cap | 3.19 bn USD |
| P/E (LTM) | 8.1 |
| EV/EBITDA (LTM) | 6.6 |
| P/B | 3.41 |
| Net debt / EBITDA (LTM) | 0.63 |
| Operating cash flow (LTM) | 0.55 bn |
| ROE | 36.5% |
| EV/EBITDA, 3-year average | 16.8 |
Net profit by quarter
| Period | Measure | bn USD |
|---|---|---|
| Q4 2024 | Net profit | −0.048928 |
| Q1 2025 | Net profit | 0.080227 |
| Q2 2025 | Net profit | 0.070548 |
| Q3 2025 | Net profit | 0.035978 |
| Q4 2025 | Net profit | 0.07697 |
| Q1 2026 | Net profit | 0.108771 |
| Q2 2026 | Net profit | 0.08954300000000001 |
| Q3 2026 | Net profit | 0.116237 |
Bottom line
What was strong in the report was not only price: beyond the price effect the company earned another 63.3 million USD of EBITDA, and the margin rose to 54.1% from 38.7%. Revenue grew 96.5% and accelerated from 73.9% a quarter earlier, and operating cash flow of 191.2 million USD covered capital expenditure of 75.4 million USD with room to spare. The question for a holder now is not debt – 0.63 EBITDA LTM – nor the margin, but how durable current copper prices are: spot is already 2.9% below the quarterly average. Our conclusion: rather attractive – on the portal's model the upside to fair value is +52%. Our view: the share is rather attractive at the current price; upside on the portal model +52%.