Greenfire Resources: revenue up a quarter, but margin compressed 11 points and profit rests on one-offs
Greenfire Resources reported second-quarter 2026 results. Revenue rose 23.5% year on year to $129.0 million, EBITDA added just 0.5% to $63.6 million, and net profit increased 9.1% to $38.5 million. The EBITDA margin compressed to 49.3% from 60.5% a year earlier, and the net margin to 29.8% from 33.7%. Net debt at the end of June stood at just $15.2 million, with net debt/EBITDA for the trailing twelve months at 0.35. In our view the share looks attractive: the market values the company at 16.8 times trailing EBITDA, while the portal's model implies 75% upside to fair value.
Key takeaways
— Revenue rose 23.5% year on year, but EBITDA added just 0.5% – growth did not reach profit
— EBITDA margin compressed to 49.3% from 60.5% a year earlier, and that is the main question for the report
— Net profit rose 9.1% to $38.5 million, but operating profit for the quarter was $30.4 million
— Net debt fell to $15.2 million from $179.0 million a year earlier, with net debt/EBITDA LTM at 0.35
— Operating cash flow for the quarter was $25.6 million, and it does not even cover EBITDA
— At EV/EBITDA LTM of 16.8 and 75% upside on the portal's model, the valuation looks attractive
Attractiveness
Key figures, USD bn
| Metric | Q2 2025 | Q2 2026 | Change |
|---|---|---|---|
| Revenue | 0.10 | 0.13 | +23.5% |
| EBITDA | 0.06 | 0.06 | +0.5% |
| Operating profit | 0.01 | 0.03 | +208.6% |
| Net profit | 0.04 | 0.04 | +9.1% |
| Operating cash flow | 0.01 | 0.03 | +99.5% |
| EBITDA margin | 60.5% | 49.3% | -11.2 pp |
| Net margin | 33.7% | 29.8% | -3.9 pp |
Revenue rose 23.5% year on year, but EBITDA added just 0.5% – growth did not reach profit
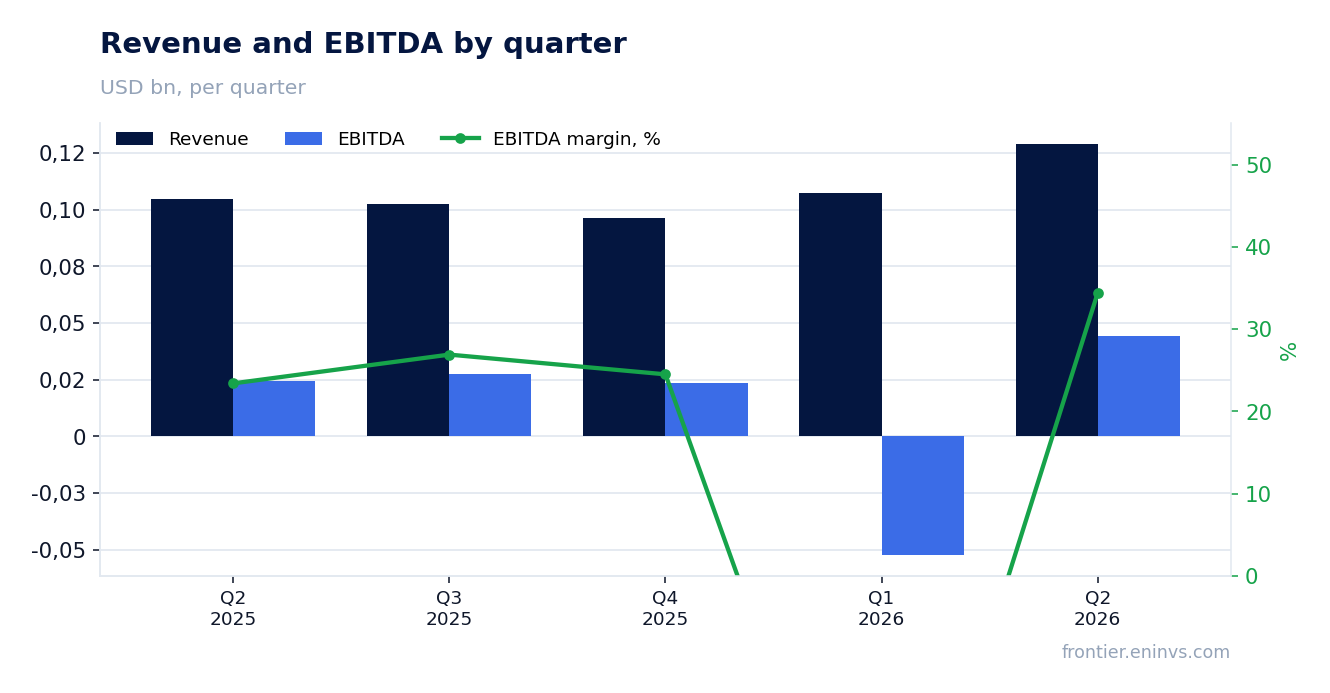
Revenue in the second quarter of 2026 was $129.0 million, up 23.5% from the second quarter of 2025. This is a notable acceleration versus prior quarters: revenue was $107.1 million in Q1 2026, $96.3 million in Q4 2025, and $102.4 million in Q3 2025. Revenue growth accelerated, but it did not translate into proportional profit growth.
EBITDA in Q2 2026 was $63.6 million, up just 0.5% year on year. For comparison, EBITDA in Q1 2026 was negative at -$52.4 million, but that was due to one-off write-offs that did not recur. EBITDA was $23.6 million in Q4 2025 and $27.5 million in Q3 2025. Thus, the current EBITDA level is significantly higher than in previous quarters, but the year-on-year growth is almost zero.
The gap between revenue and EBITDA growth means costs rose faster than revenue. Operating profit in Q2 2026 was $30.4 million, which also points to pressure on profitability. The company did not disclose cost line details, so we can only state the fact: revenue growth did not translate into EBITDA growth.
EBITDA margin compressed to 49.3% from 60.5% a year earlier, and that is the main question for the report
EBITDA margin in Q2 2026 was 49.3%, compared with 60.5% a year earlier. A decline of 11.2 percentage points is a significant deterioration in profitability. With revenue of $129.0 million and EBITDA of $63.6 million, the margin is lower than in previous periods when revenue was smaller.
Net margin also declined, to 29.8% from 33.7% a year earlier. Net profit in Q2 2026 was $38.5 million, up 9.1% from Q2 2025. However, net profit growth amid margin contraction is explained not by operational improvements but likely by one-off factors or changes in the tax burden, which the company did not detail.
Margin compression is a key risk for the investment case. If it continues, profit may not grow even with revenue growth. In the next report, watch the margin dynamics: if it stabilizes or starts to recover, that would signal the cost pressure was temporary.
Net profit rose 9.1% to $38.5 million, but operating profit for the quarter was $30.4 million
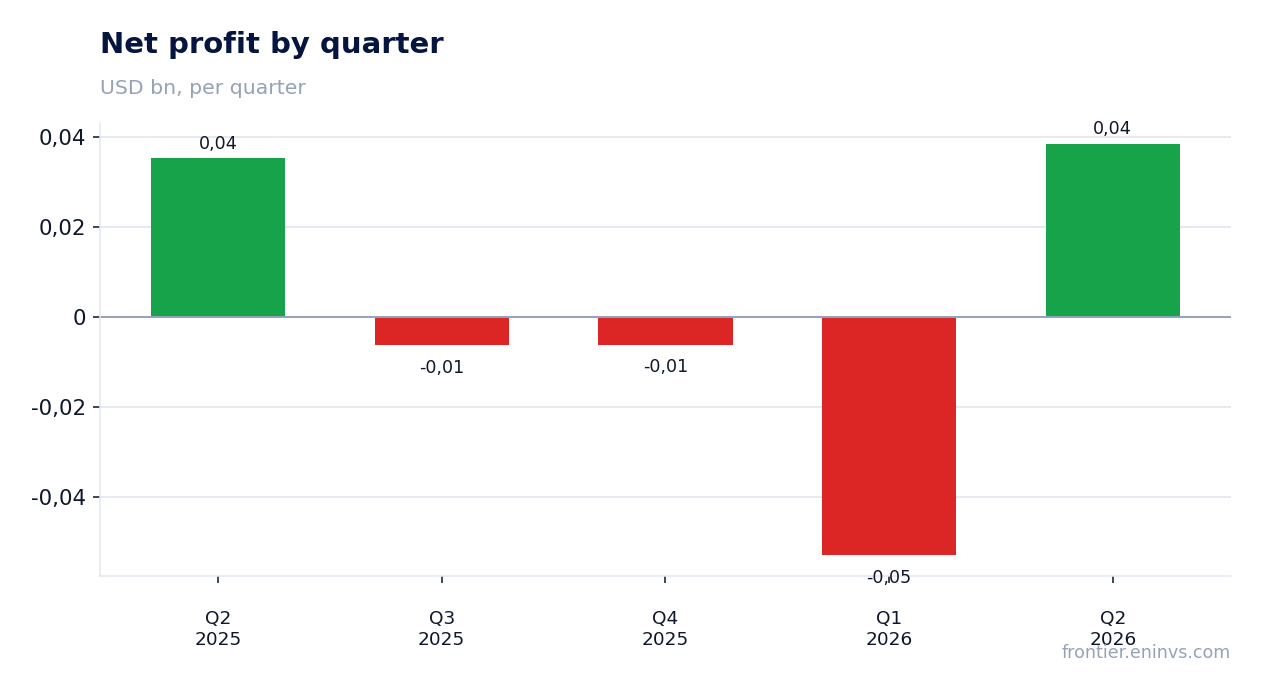
Net profit in Q2 2026 was $38.5 million, up 9.1% from Q2 2025. However, operating profit for the same period was $30.4 million, meaning net profit exceeds operating profit. This suggests that a significant portion of profit was generated not by operations but by other items – likely foreign exchange differences, tax effects, or one-off gains.
For comparison, in Q1 2026 the company posted a net loss of $53.1 million, driven by negative EBITDA. The situation improved in Q2, but the quality of profit raises questions. Operating profit of $30.4 million on revenue of $129.0 million gives an operating margin of 23.6%, which is lower than one might expect given the high EBITDA margin.
Investors should focus not only on net profit but also on operating profit, as the latter reflects the efficiency of the core business. In the next report, it is important to see whether net profit continues to exceed operating profit or whether that was a one-off.
Net debt fell to $15.2 million from $179.0 million a year earlier, with net debt/EBITDA LTM at 0.35
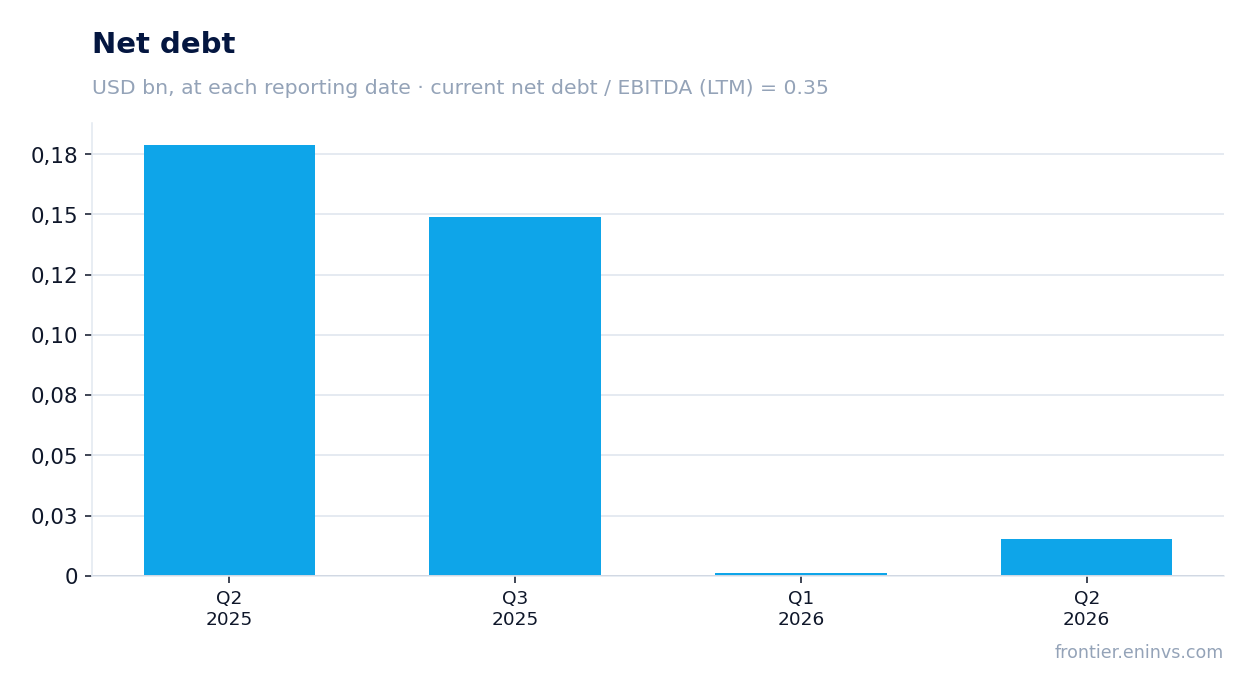
Net debt as of June 30, 2026, was $15.2 million. A year earlier, on June 30, 2025, it was $179.0 million, a decrease of $163.8 million over 12 months. Compared with March 31, 2026, net debt was almost unchanged: $15.2 million versus $1.3 million, an increase of $13.9 million. Such a sharp reduction in debt over the year is an important positive factor that reduces financial risks.
The net debt/EBITDA ratio for the trailing twelve months is 0.35. This is a very low level, indicating high debt sustainability. For comparison, EBITDA for the trailing twelve months was $43.0 million, and revenue was $434.8 million. Low debt burden gives the company freedom for investment or returning capital to shareholders.
Operating cash flow for the trailing twelve months was $87.3 million, which also covers current needs. The debt reduction occurred alongside revenue growth, indicating an improvement in the financial position. In the next report, it is important to monitor that debt does not start growing again, especially if the margin continues to decline.
Operating cash flow for the quarter was $25.6 million, and it does not even cover EBITDA
Operating cash flow in Q2 2026 was $25.6 million. This is significantly below EBITDA for the same period – $63.6 million. The gap of $38.0 million indicates that a significant portion of profit does not convert into cash. Reasons could be changes in working capital, growth in receivables, or other non-cash items.
For comparison, operating cash flow was just $1.0 million in Q1 2026, $25.4 million in Q4 2025, and $35.4 million in Q3 2025. Thus, the current cash flow level is in the middle of the range of recent quarters. However, with revenue growth, a more substantial increase in cash flow would be expected.
Low operating cash flow amid high EBITDA is a risk for financing investments and shareholder payouts. The company did not disclose the structure of capital expenditures, but if they are significant, free cash flow could be negative. In the next report, it is important to see an improvement in the conversion of EBITDA into cash flow.
At EV/EBITDA LTM of 16.8 and 75% upside on the portal's model, the valuation looks attractive
Current valuation: EV/EBITDA for the trailing twelve months is 16.8. This is a fairly high multiple, suggesting the market is pricing in significant growth or margin improvement. For comparison, market capitalization is $708.6 million, and net debt is $15.2 million, giving an EV of about $723.8 million. With EBITDA LTM of $43.0 million, the multiple is indeed 16.8.
According to the portal's model, which reprices EBITDA at current commodity prices at the target EV/EBITDA, the fair value of the share implies 75% upside to the current market price. This is our own model, not a consensus forecast. If commodity prices remain at current levels and the margin recovers, the share could rise substantially.
However, a high multiple means the market already expects improvement. If the margin continues to decline, the valuation may prove excessive. The key factor for a re-rating is the recovery of the EBITDA margin above 50%. In the next report, watch this metric.
Valuation on the latest reported figures
| Metric | Value |
|---|---|
| Market cap | 0.71 bn USD |
| EV/EBITDA (LTM) | 16.8 |
| P/B | 0.85 |
| Net debt / EBITDA (LTM) | 0.35 |
| Operating cash flow (LTM) | 0.09 bn |
| ROE | 19.3% |
Bottom line
Bottom line: Greenfire Resources showed strong revenue growth of 23.5% year on year, but EBITDA barely grew, and the margin compressed to 49.3% from 60.5%. Net profit rose 9.1%, but operating profit for the quarter was only $30.4 million, indicating one-off factors in profit. The company significantly reduced net debt to $15.2 million from $179.0 million a year earlier, with net debt/EBITDA LTM at 0.35. Operating cash flow for the quarter was $25.6 million, which does not cover EBITDA. At EV/EBITDA LTM of 16.8 and 75% upside on the portal's model, the share looks attractive, but the key question is whether the company can restore its margin.
Open the company's financial profile GFR →
See also: market overview · valuation map · stock screeners