Holmen: revenue fell 8.7% and profit nearly 60%, and this is no longer a one-off
Holmen reported third-quarter 2026 revenue of $511.9m, operating profit of $56.8m and net profit of $40.5m. Year on year revenue fell 8.7% and net profit 59.3%, while the net margin dropped from 17.7% to 7.9%. The stock trades below its own history on EV/EBITDA, but weakening demand and a compressed margin outweigh that, so at the current price the share looks rather unattractive.
Key takeaways
— Revenue fell 8.7% year on year in the third quarter after growing 3.3% in the second – a deceleration, not a seasonal dip
— Operating profit dropped to $56.8m from $77.6m a year earlier, and the margin compressed faster than revenue
— Net profit of $40.5m is 7.9% of revenue against 17.7% a year earlier, and there are no one-off items dressing it up
— Leverage of 1.25x EBITDA LTM is moderate, but net debt rose from $0.5bn at end-2025 to $0.6bn on 30 September 2026
— Free cash flow is shrinking with profit: operating cash flow for the quarter was only $37.0m against $76.3m a year earlier
— A trailing dividend yield of 3.1% is modest for this history, and with profit falling the payout is under pressure
— EV/EBITDA LTM of 11.0 is 11% below its own three-year average of 12.3, but the discount does not offset the profit collapse
Attractiveness
Key figures, USD bn
| Metric | Q3 2025 | Q3 2026 | Change |
|---|---|---|---|
| Revenue | 0.56 | 0.51 | -8.7% |
| EBITDA | 0.12 | — | — |
| Operating profit | 0.08 | 0.06 | -26.8% |
| Net profit | 0.10 | 0.04 | -59.3% |
| Operating cash flow | 0.08 | 0.04 | -51.6% |
| EBITDA margin | 21.1% | — | — |
| Net margin | 17.7% | 7.9% | -9.8 pp |
Revenue fell 8.7% year on year in the third quarter after growing 3.3% in the second – a deceleration, not a seasonal dip
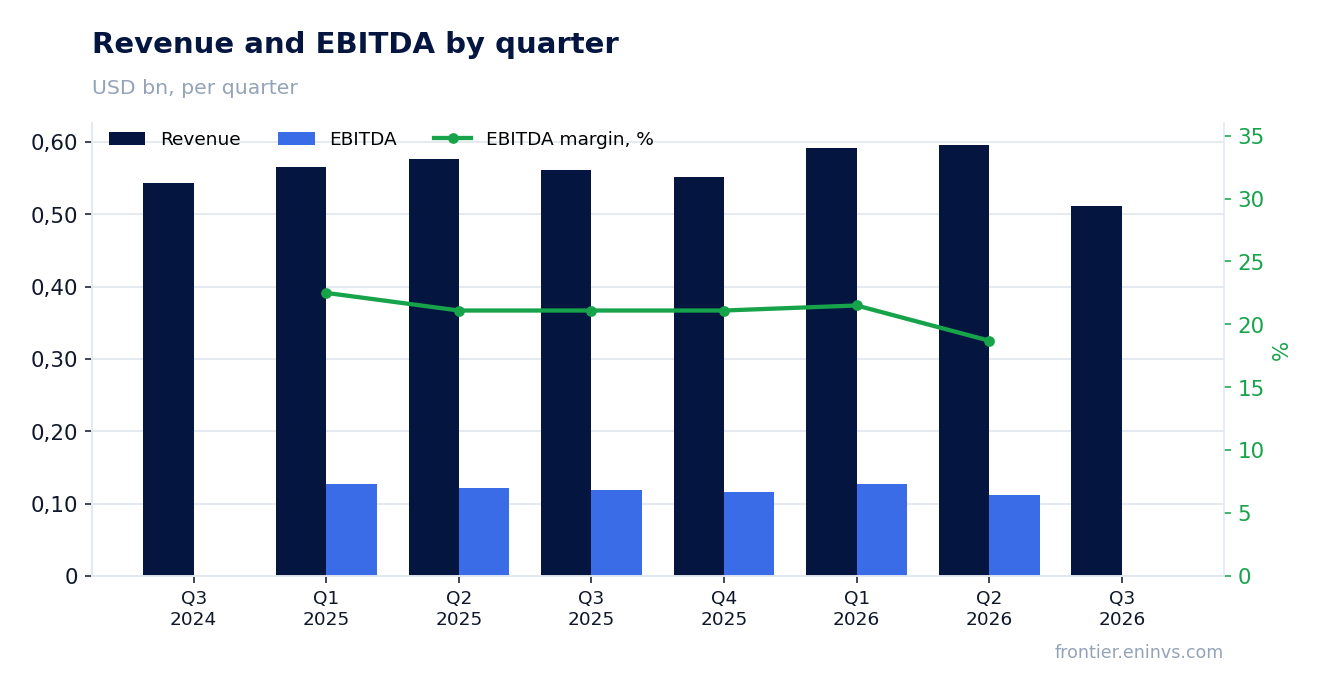
Third-quarter 2026 revenue came in at $511.9m, 8.7% below the year-earlier figure. In the second quarter the company was still growing at 3.3%, and in the first at 4.8%, so the reversal happened in the reported period. A swing from plus to minus is a deceleration, and it affects the whole business rather than a single segment.
The 8.7% decline is the first year-on-year drop in the five quarters for which data are available. Over the previous four quarters revenue held in a range of $552–597m, and now it has fallen to $512m. That is not noise around a trend but a break below the floor of the range.
Operating profit dropped to $56.8m from $77.6m a year earlier, and the margin compressed faster than revenue
Operating profit for the third quarter was $56.8m against $77.6m a year earlier – a decline of 26.8%. Revenue over the same period fell 8.7%, so profit dropped three times faster than revenue. The operating margin narrowed from 13.8% to 11.1%.
That relationship means unit profitability fell along with revenue: part of the cost base did not adjust to lower sales volumes. The report does not break down which cost line made the main contribution, so we state only what is visible: the margin compressed by 2.7 percentage points, and this is already the second consecutive quarter in which operating profit is below $90m.
For a shareholder the level of profit matters less than the fact that operating leverage is now working against the company. With revenue falling, every percentage point of decline takes more than a percentage point off profit.
Net profit of $40.5m is 7.9% of revenue against 17.7% a year earlier, and there are no one-off items dressing it up
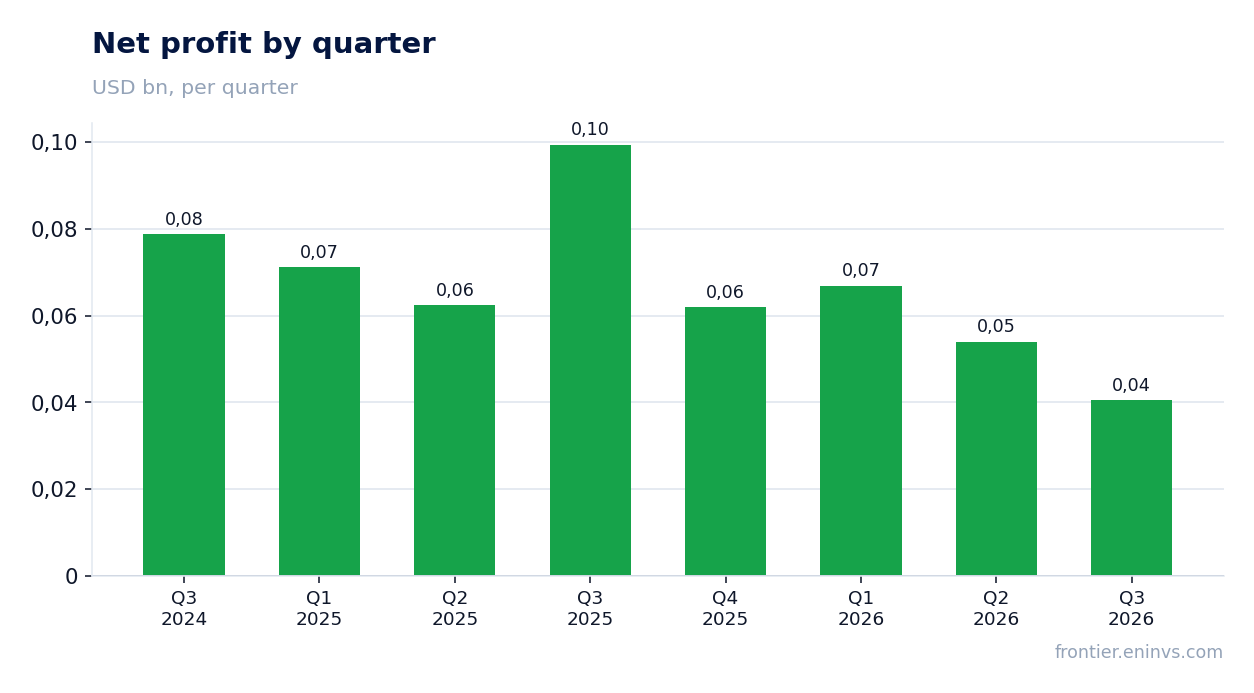
Net profit for the third quarter was $40.5m, down 59.3% year on year. The net margin fell from 17.7% to 7.9% – more than halved. The drop in net profit is deeper than the drop in operating profit, which means items below the operating line were added.
A year earlier net profit ran ahead of operating dynamics: $99.4m against operating profit of $77.6m. Items below the operating line helped then; now they do not. Today's $40.5m is a result without outside support, which is why it looks so weak.
Over the trailing twelve months net profit was $223.3m – the sum of four quarters, not a reported-period figure. It is still held up by a strong first quarter of 2026, but the current quarter already shows where the base is heading.
Leverage of 1.25x EBITDA LTM is moderate, but net debt rose from $0.5bn at end-2025 to $0.6bn on 30 September 2026
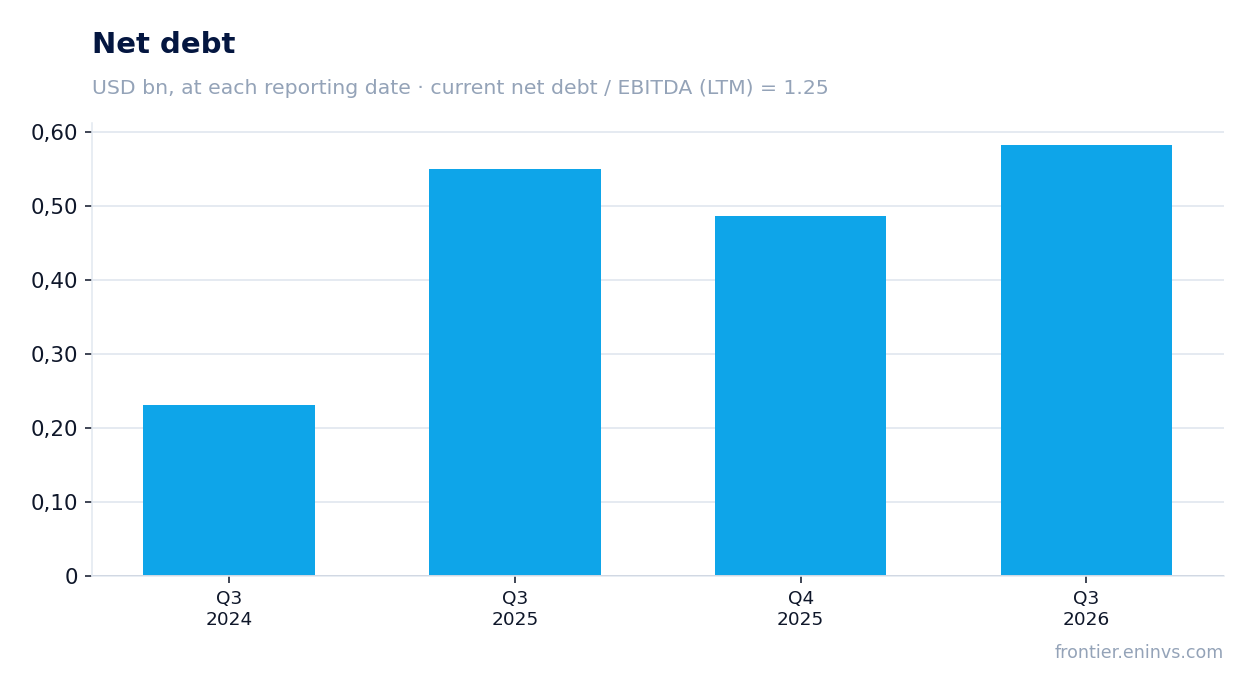
Net debt on 30 September 2026 was $582.2m, or $0.6bn. Since the end of 2025 it has risen from $0.5bn to $0.6bn, a change of $0.1bn. Over twelve months the change is nil: it was also $0.5bn on 30 September 2025 and is $0.6bn now.
The ratio of net debt to trailing-twelve-month EBITDA is 1.25. That is a moderate level and not a debt problem in itself. But EBITDA LTM of $465.2m is built on four quarters including a strong start to 2026; if profit stays at the third-quarter level, the denominator will start to shrink.
Interest expense is not disclosed separately in the report, so these data do not allow us to judge what the debt costs the company. We record only the level of leverage and the direction of change in net debt itself.
Free cash flow is shrinking with profit: operating cash flow for the quarter was only $37.0m against $76.3m a year earlier
Operating cash flow for the third quarter was $37.0m against $76.3m a year earlier – a decline of more than half. It came in even below net profit of $40.5m, meaning the company could not fully convert profit into cash. Over the trailing twelve months the flow was $326.7m, and this quarter is pulling that base down.
Capital expenditure is not disclosed in the report, so free cash flow in the strict sense cannot be calculated. But with operating cash flow of $37.0m and rising net debt, room for manoeuvre is narrowing: the company has already increased debt from $0.5bn to $0.6bn since the end of 2025.
The weakness in cash flow is not a one-off. In the second quarter it was $40.0m, in the first $115.3m. The trend within the year is downward, and it matches the profit dynamics.
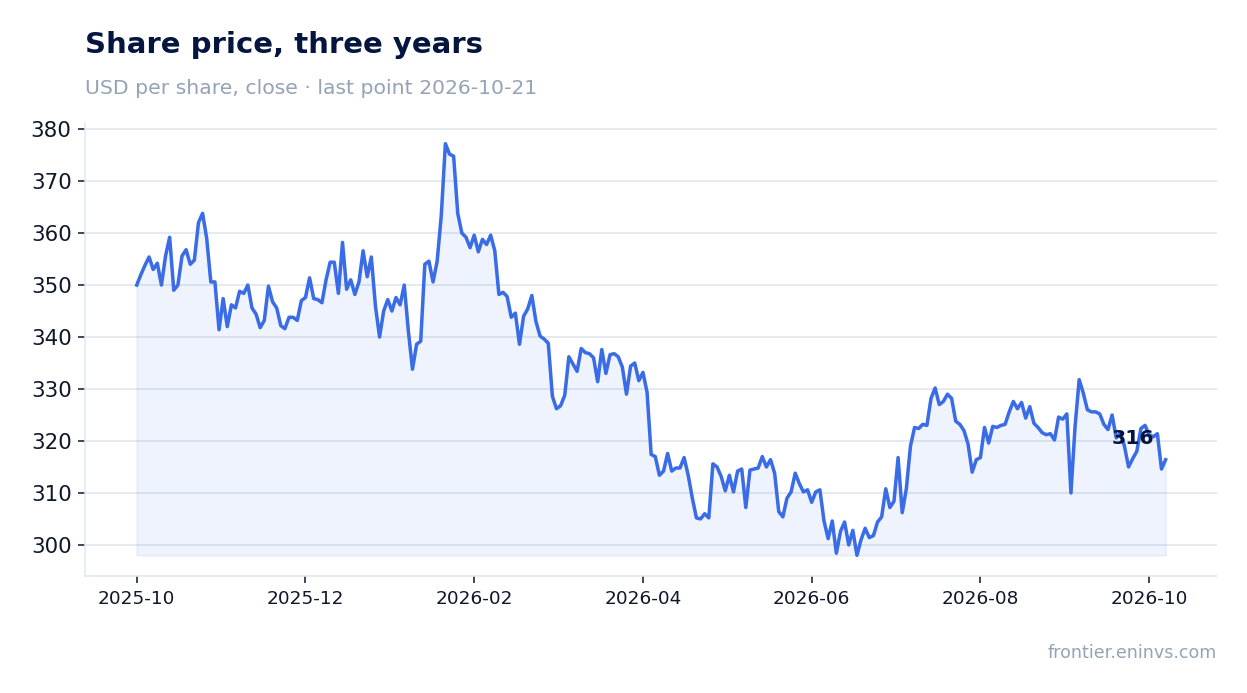
A trailing dividend yield of 3.1% is modest for this history, and with profit falling the payout is under pressure
The trailing twelve-month dividend yield is 3.1%. That is a level clearly below what would normally be considered attractive for a stock with falling profit. With LTM net profit of $223.3m and a market capitalisation of $4.6bn, the payout does not look burdensome, but its base is shrinking.
Our estimate for the current year's dividend is about 3% of the price, and it rests on two things: the payout ratio and full-year profit. If the third quarter sets the tone for the fourth, annual profit will come in below 2025 and the payout may be cut. What could reduce it is further profit decline and rising debt, which has already moved up from $0.5bn to $0.6bn since the end of 2025.
For an investor holding the stock for income, the risk-reward is worse than a year ago: a 3.1% yield does not compensate for a 59.3% fall in profit.
EV/EBITDA LTM of 11.0 is 11% below its own three-year average of 12.3, but the discount does not offset the profit collapse
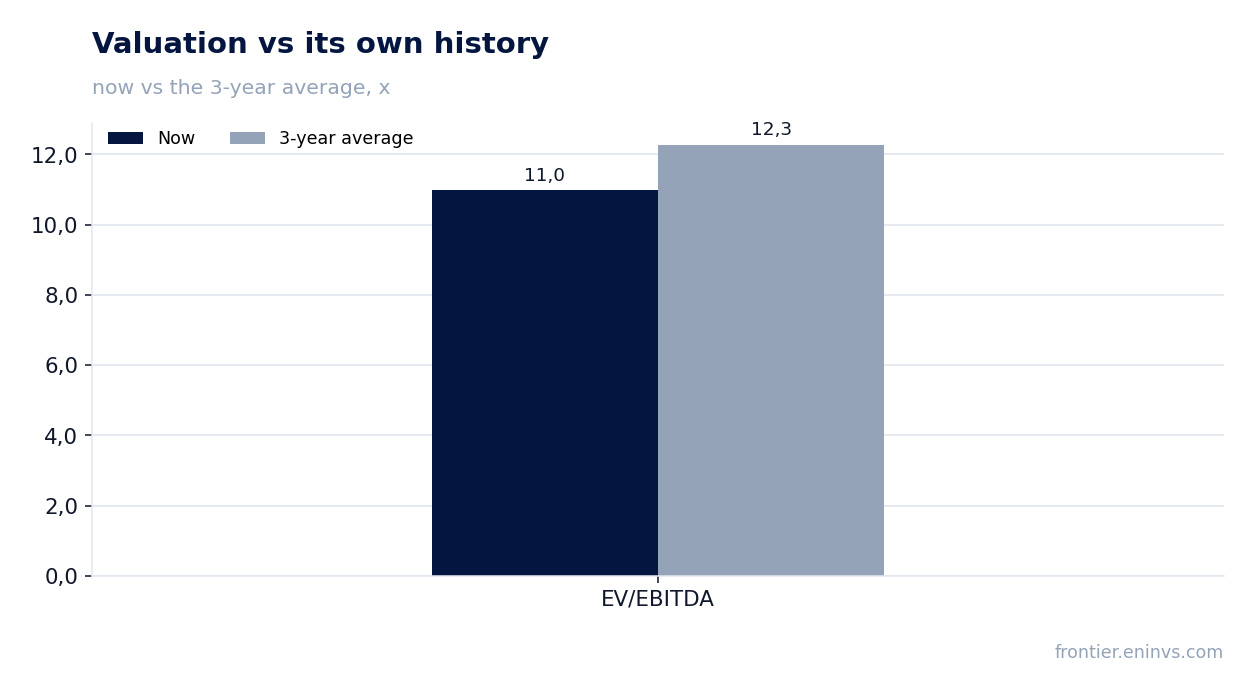
The trailing-twelve-month EV/EBITDA multiple is 11.0 against its own three-year average of 12.3. The stock trades 11% below its own history, i.e. cheaper than usual. P/E LTM is 20.7, which looks on the high side for a company with falling profit.
The discount to its own history is the only argument in favour of buying that these data contain. But it exists because the market has already priced in lower profit: EBITDA LTM of $465.2m still includes strong quarters, while current profit corresponds to a much lower level. On the portal's model the upside to fair value is +55%, but that estimate is built on re-pricing EBITDA at current commodity prices and may not materialise if conditions deteriorate further.
ROE of 3.8% is a low figure for a company trading above 20 times earnings. It is another sign that profit is at a trough rather than at a sustainable level.
Valuation on the latest reported figures
| Metric | Value |
|---|---|
| Market cap | 4.62 bn USD |
| P/E (LTM) | 20.7 |
| EV/EBITDA (LTM) | 11.0 |
| P/B | 0.77 |
| Net debt / EBITDA (LTM) | 1.25 |
| Operating cash flow (LTM) | 0.33 bn |
| ROE | 3.8% |
| Dividend yield (12m) | 3.1% |
| EV/EBITDA, 3-year average | 12.3 |
Bottom line
The strengths of the report remain moderate leverage of 1.25x EBITDA LTM and a discount to its own history on EV/EBITDA – 11.0 against 12.3. But everything else moves in one direction: revenue fell 8.7%, net profit 59.3%, the margin from 17.7% to 7.9%, and quarterly operating cash flow was only $37.0m. There are no one-off items dressing up profit, which makes the picture honest but bleak. The question for a holder now is where the profit decline stops and whether the 3.1% dividend holds. At the current price the share looks rather unattractive: the discount to history does not cover the weakness in the fundamentals.
Open the company's financial profile HOLM →
See also: market overview · valuation map · stock screeners