Royal Gold: revenue up 84.4% but profit lagged on thinner margin

On 20 October Royal Gold released preliminary figures for the third quarter of 2026. Revenue came in at $464.8 million, net profit at $227.4 million and operating cash flow at $344.4 million. Year on year revenue rose 84.4% and profit 79.3%, while the net margin slipped to 48.9% from 50.3%. The share looks attractive: EV/EBITDA of 16.9 sits below its own three-year average of 24.1, leverage is moderate, and the 0.77% dividend yield is small but steady.
Key takeaways
— Q3 revenue rose 84.4% year on year, but growth decelerated from 114.9% in Q2
— Net margin fell to 48.9% from 50.3%, and profit lagged revenue
— The stream segment delivered $318.3 million, or 74,700 gold-equivalent ounces
— The company repaid $250 million of debt and bought back $49 million of shares
— Leverage at 0.58x EBITDA LTM is a level with no sign of increase
— The 0.77% dividend yield is low against the key rate, but payouts are steady
— EV/EBITDA of 16.9 is below its own three-year average of 24.1, and the portal model puts the share 35% below fair value
Attractiveness
Key figures, USD bn
| Metric | Q3 2025 | Q3 2026 | Change |
|---|---|---|---|
| Revenue | 0.25 | 0.46 | +84.4% |
| EBITDA | 0.20 | — | — |
| Operating profit | 0.16 | — | — |
| Net profit | 0.13 | 0.23 | +79.3% |
| Operating cash flow | 0.17 | 0.34 | +98.0% |
| Capex | 0.99 | — | — |
| EBITDA margin | 77.5% | — | — |
| Net margin | 50.3% | 48.9% | -1.4 pp |
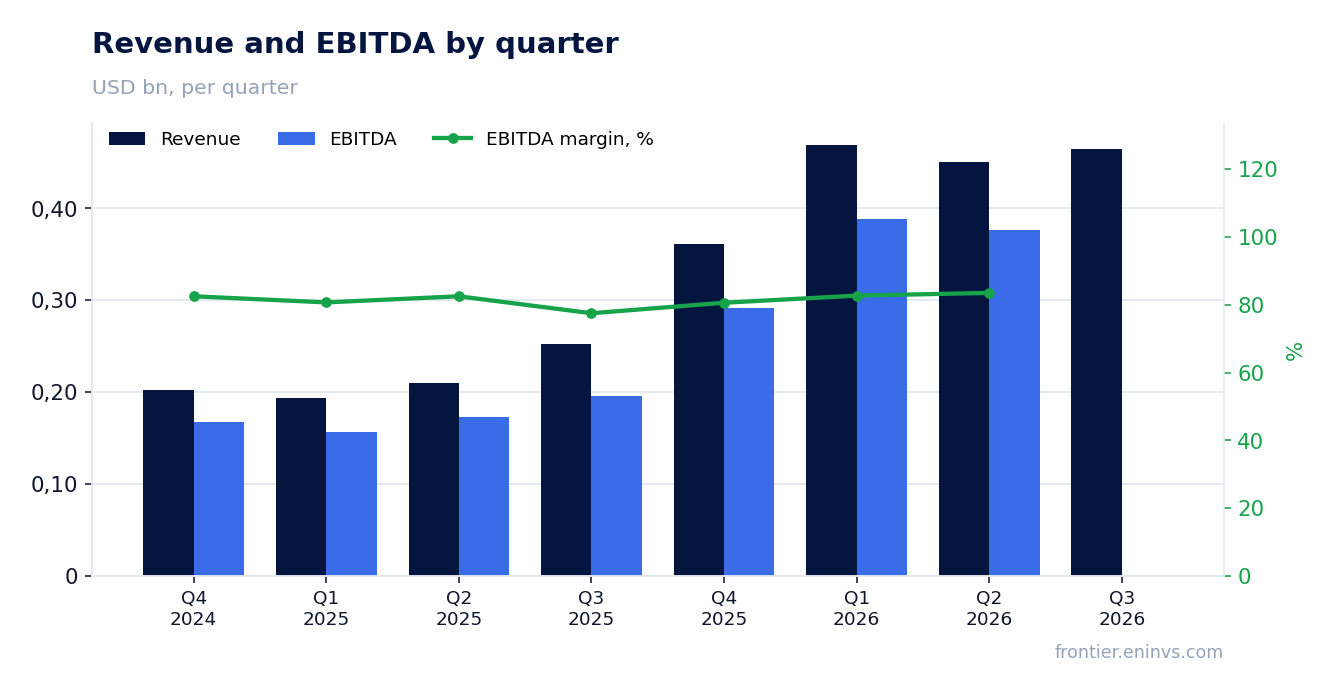
Q3 revenue rose 84.4% year on year, but growth decelerated from 114.9% in Q2
Q3 2026 revenue was $464.8 million against $252.1 million a year earlier. Growth of 84.4% looks strong, but in Q2 it was 114.9%, so the pace decelerated. The slowdown reflects a high base: a year ago revenue was already growing 30.0%.
The stream segment contributed the bulk – $318.3 million, or 74,700 gold-equivalent ounces. Royalties added another $143–149 million on a preliminary estimate. The average gold price in the quarter was $4,262 per ounce, and that is what supports revenue.
Over the trailing twelve months revenue reached $1,800.0 million. That is a level, not a growth rate: the year-on-year figure applies to the standalone quarter. For a holder the point is that the company keeps its scale, but quarterly momentum is no longer accelerating.
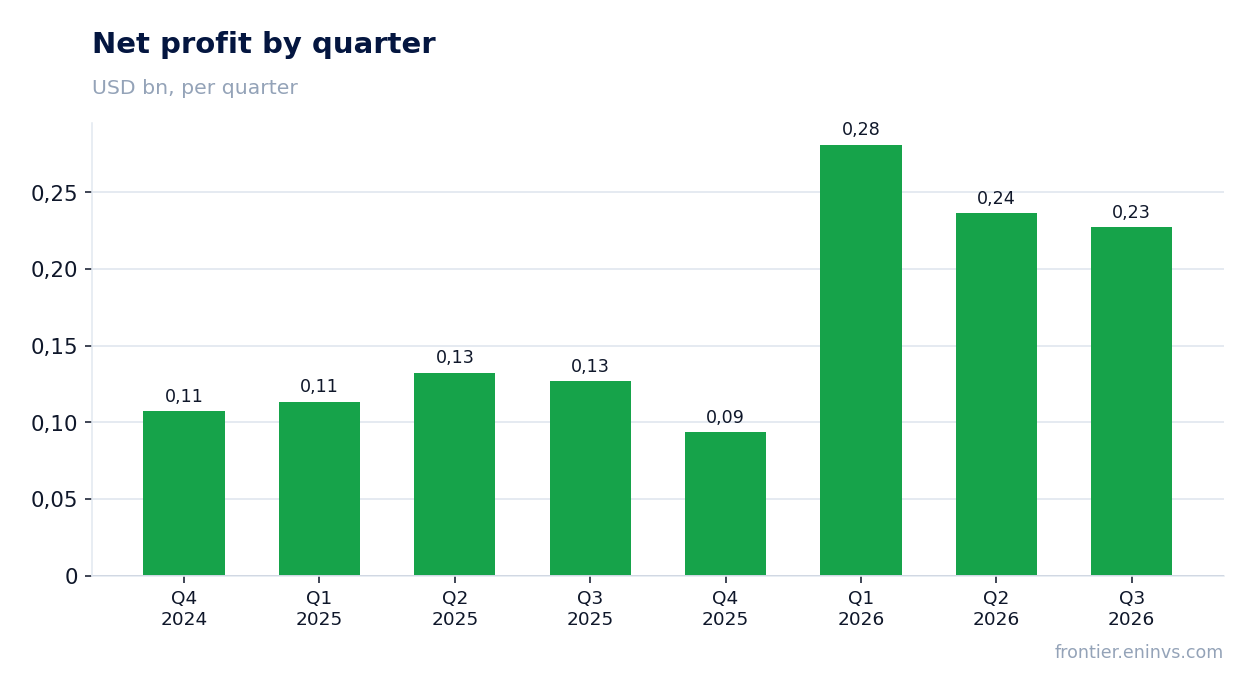
Net margin fell to 48.9% from 50.3%, and profit lagged revenue
Q3 net profit was $227.4 million, up 79.3% year on year. That is slower than revenue, which grew 84.4%. The net margin fell to 48.9% from 50.3% a year earlier.
The facts do not disclose the reason profit lagged revenue. What is known is that stream cost of sales was $834 per gold-equivalent ounce and royalty DD&A is estimated at $80–84 million. Those lines shape the gap between gross revenue and profit.
Over the trailing twelve months net profit was $838.5 million on revenue of $1,800.0 million. That is an LTM level, not a quarterly result. The LTM margin of about 46.6% remains high for the industry, but the quarterly margin is already below last year's.
The stream segment delivered $318.3 million, or 74,700 gold-equivalent ounces
Streaming remains the main revenue source: $318.3 million for the quarter. Sales in gold-equivalent ounces were 74,700. Ending inventory was 23,300 ounces of gold and 424,200 ounces of silver, which gives a cushion for future deliveries.
Metals sold at an average gold price of $4,262 per ounce. Silver and copper round out the portfolio, but their revenue contribution is smaller. Royalties brought in $143–149 million, and that estimate is preliminary: final receipts are not yet in.
Diversification across metals and assets reduces dependence on any single mine. For a holder that means revenue will not collapse if one project stumbles. But growth in streaming is capped by delivery volumes under existing contracts.
The company repaid $250 million of debt and bought back $49 million of shares
In Q3 Royal Gold repaid $250 million of debt. The revolving credit facility balance at 30 September 2026 was $150 million, with $1.25 billion undrawn and available. That leaves a liquidity cushion.
The company repurchased 190,045 shares at an average price of $259.83 for total consideration of $49 million. The shares were cancelled, which supports earnings per share. Quarterly operating cash flow of $344.4 million comfortably covered both the repayment and the buyback.
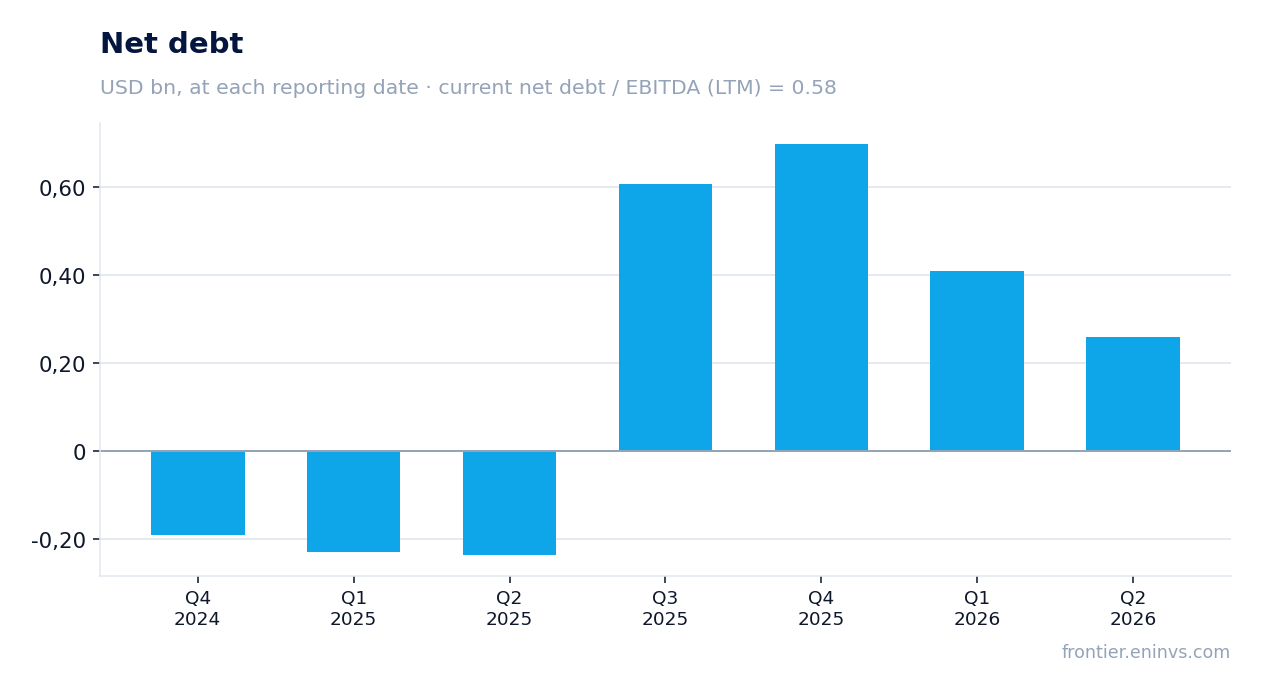
Net debt at the latest annual balance sheet date was $747.1 million. Net debt to EBITDA LTM is 0.58. That is a level, and the facts do not disclose its direction, so no claim of rising or falling leverage can be made.
Leverage at 0.58x EBITDA LTM is a level with no sign of increase
Net debt to EBITDA LTM is 0.58. That is a moderate level for a company with $1,800.0 million of trailing twelve-month revenue. EBITDA LTM is $1,279.1 million and covers debt many times over.
Repaying $250 million in the quarter cut the credit facility balance to $150 million. With operating cash flow of $344.4 million the company can service debt without strain. Interest expense is not disclosed in the facts, so its effect on profit is not assessed.
For a holder the point is that debt is not growing and does not require new borrowing. The $1.25 billion undrawn on the facility is capacity to fund new deals without diluting equity.
The 0.77% dividend yield is low against the key rate, but payouts are steady
The trailing twelve-month dividend yield is 0.77%. That is modest for an investor used to high rates. But Royal Gold pays dividends steadily and has not cut them even in weak quarters.
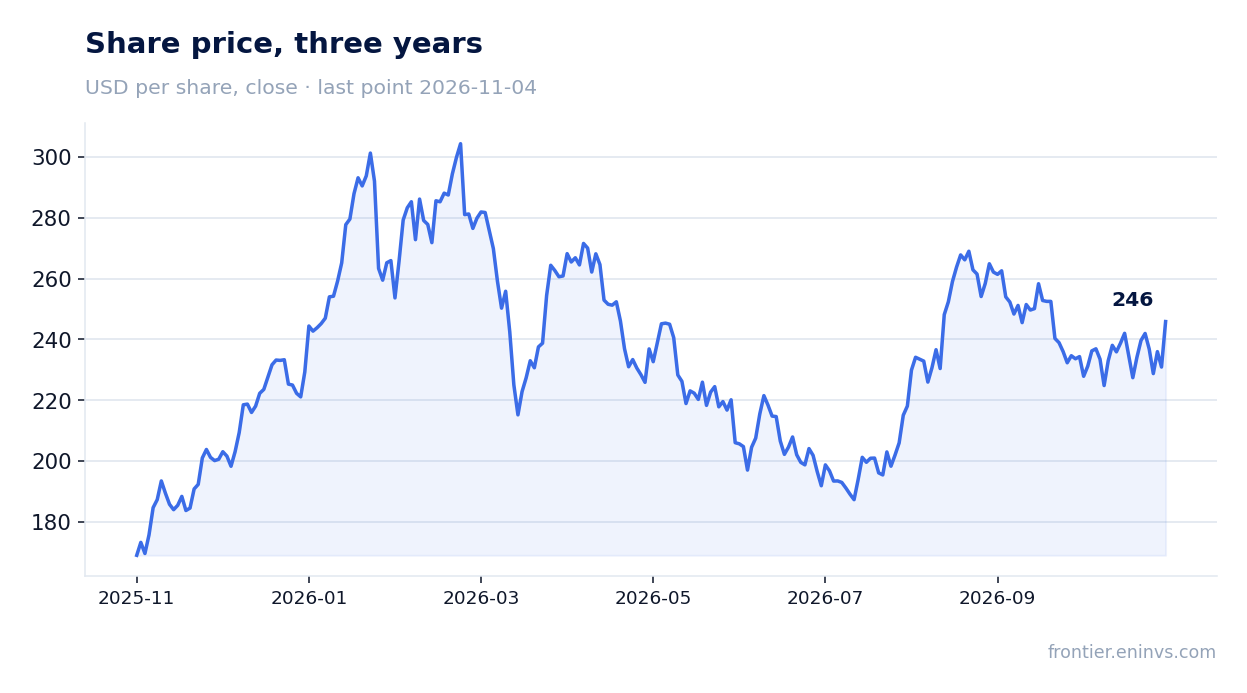
Our estimate for the current year's dividend starts from LTM profit of $838.5 million and the established payout practice. The exact payout depends on the payout ratio and one-off items not disclosed in the facts. The 0.77% yield on a $235.91 share price is what a holder gets now.
Against the key rate that yield looks low. But for this company the dividend is a supplement to capital growth rather than the main source of income. A profit decline or a large cash-consuming deal could reduce the payout.
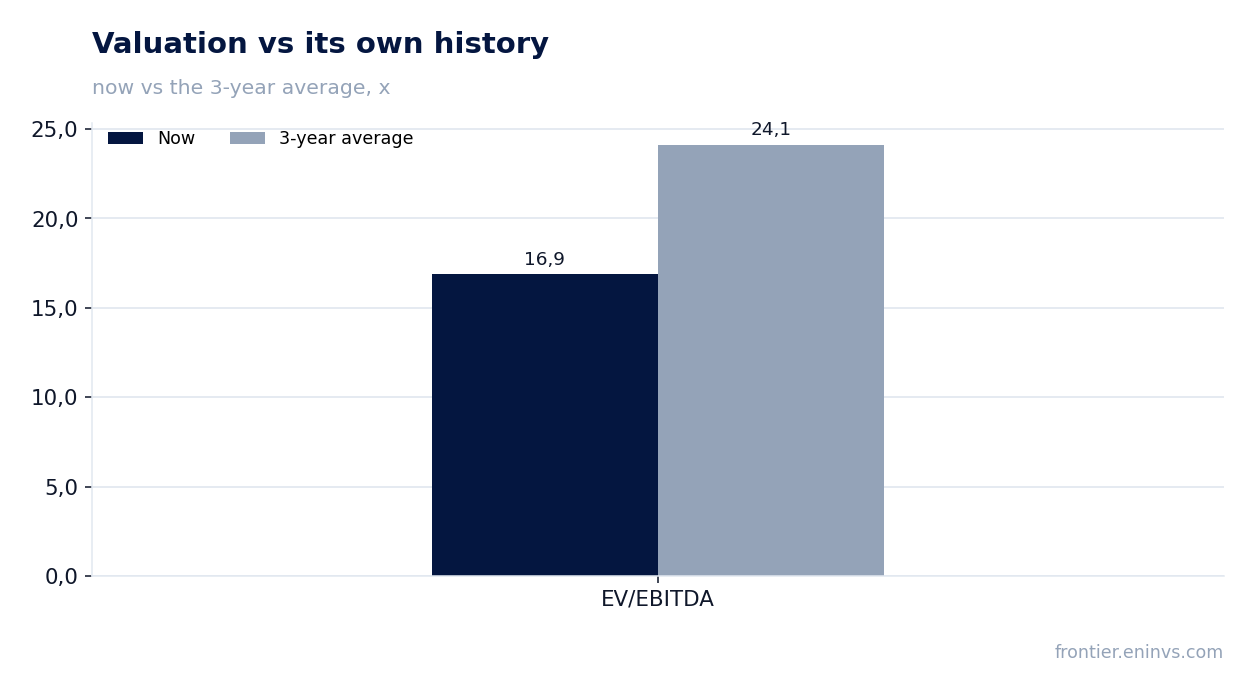
EV/EBITDA of 16.9 is below its own three-year average of 24.1, and the portal model puts the share 35% below fair value
The EV/EBITDA LTM multiple is 16.9. That is 30% below its own three-year average of 24.1. The share trades cheaper than usual on this multiple. P/E LTM is 24.8, which for a company with a margin near 46.6% does not look overheated.
On the portal model, which reprices EBITDA at current commodity prices against the target EV/EBITDA, the share is 35% below fair value. That is our own estimate, not a market consensus. It rests on current gold prices and the revenue mix.
The share price before the release was $235.91. On the release day it added 1.2%, and from the release to 4 November it gained 4.2%. The market took the results calmly, without a sharp re-rating.
Valuation on the latest reported figures
| Metric | Value |
|---|---|
| Market cap | 20.8 bn USD |
| P/E (LTM) | 24.8 |
| EV/EBITDA (LTM) | 16.9 |
| P/B | 2.89 |
| Net debt / EBITDA (LTM) | 0.58 |
| Operating cash flow (LTM) | 1.21 bn |
| ROE | 12.6% |
| Dividend yield (12m) | 0.8% |
| EV/EBITDA, 3-year average | 24.1 |
Bottom line
The quarter's strength is revenue of $464.8 million and operating cash flow of $344.4 million, which cover debt repayment and the buyback. The weak spot is the margin: it fell to 48.9% from 50.3%, and profit grew 79.3% against 84.4% for revenue. One-off effects are not disclosed in the facts, so margin durability is the main question for a holder. EV/EBITDA of 16.9 is below its own history, and the portal model puts the share 35% below fair value. The verdict is attractive: valuation and moderate debt outweigh the thinner margin and the small dividend.
Open the company's financial profile RGLD →
See also: market overview · valuation map · stock screeners