Southern Copper: record profit on peak copper prices, but the stock is above its own history
On October 21 Southern Copper reported third-quarter 2026 results. Revenue reached $4,696.6 million (+39.1% year on year), adjusted EBITDA – $3,040.2 million (+53.8%), net income – $1,801.8 million (+62.2%). The record was driven by metal prices, not volumes: copper output fell 1.1% quarter on quarter. With an EV/EBITDA of 15.4 against its own three-year average of 14.1 and the portal model implying –24% upside, the share looks rather unattractive at the current level.
Key takeaways
— Record revenue rose 39.1% on metal prices, not on volumes
— EBITDA margin climbed to 64.7% as cash cost per pound of copper net of by-products fell to near zero
— Net income rose 62.2%, but part of the gain came from higher interest income on accumulated cash
— Free cash flow after $515.8 million of capex remains solid, but project investment is rising too
— The $1.30 per share dividend and 1.97% yield do not offset the risk of a stretched valuation
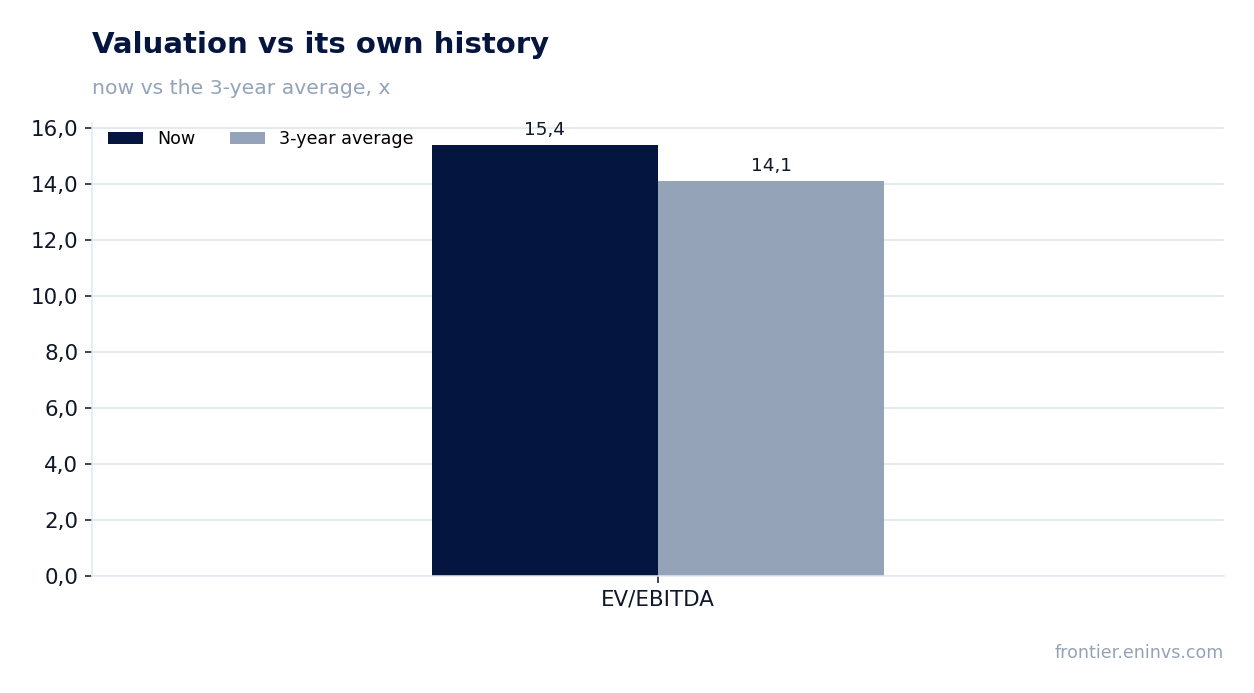
— EV/EBITDA of 15.4 is above its own three-year average of 14.1 – the stock is more expensive than its history
— The portal model implies –24% upside to fair value at current commodity prices
Attractiveness
Key figures, USD bn
| Metric | Q3 2025 | Q3 2026 | Change |
|---|---|---|---|
| Revenue | 3.38 | 4.70 | +39.1% |
| EBITDA | 1.98 | 3.04 | +53.8% |
| Operating profit | 1.77 | 2.82 | +59.2% |
| Net profit | 1.11 | 1.80 | +62.2% |
| Operating cash flow | 1.56 | 2.22 | +42.6% |
| Capex | 0.35 | — | — |
| EBITDA margin | 58.5% | 64.7% | +6.2 pp |
| Net margin | 32.9% | 38.4% | +5.5 pp |
Record revenue rose 39.1% on metal prices, not on volumes
Third-quarter 2026 revenue reached $4,696.6 million, 39.1% above the third quarter of 2025 and a quarterly record. The growth came from prices: the average LME copper price rose 44.4% year on year, molybdenum – 35.5%, zinc – 35.9%, silver – 58.7%. Sales volumes of copper fell 0.4%, molybdenum – 0.2%, silver – 12.2%; only zinc sales rose 0.8%.
Copper output in the third quarter was 232,396 tonnes, down 1.1% quarter on quarter. Mexican production rose 2.5% on higher ore grades at IMMSA and Buenavista, but Peruvian output fell 6.1% on lower grades. For the nine months, copper output declined 2.9% to 693,602 tonnes.
The deceleration in revenue growth from 40.6% in the second quarter to 39.1% mainly reflects the fading effect of a low base: prices a year ago were much lower. Further dynamics will depend on copper prices, which reached $6.41 per pound in the third quarter.
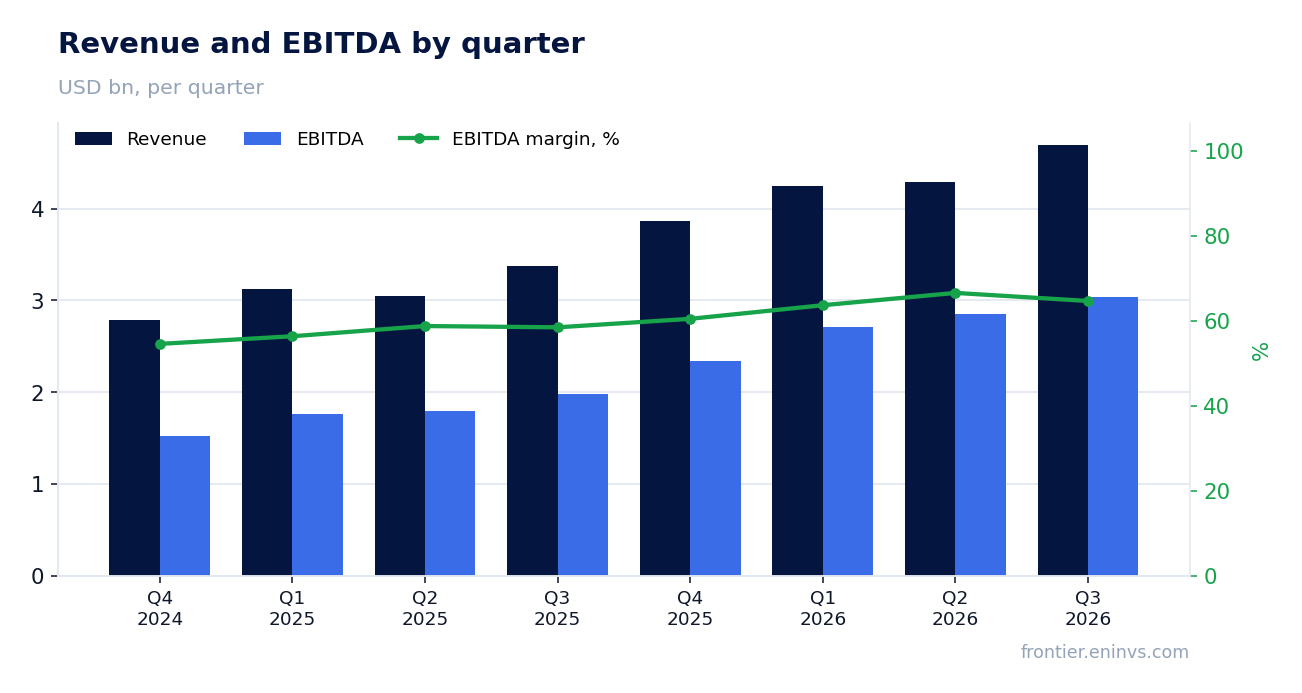
EBITDA margin climbed to 64.7% as cash cost per pound of copper net of by-products fell to near zero
Adjusted EBITDA for the third quarter was $3,040.2 million, up 53.8% year on year. The EBITDA margin reached 64.7% versus 58.5% a year earlier. The main lever was the fall in cash cost per pound of copper net of by-product credits to $0.09 from $0.42 a year earlier.
By-product revenue rose 30.6% on high molybdenum, zinc and silver prices, almost fully offsetting copper mining costs. For the nine months, cash cost was $0.01 per pound, 98.1% below the nine-month 2025 level.
Operating income rose 59.2% to $2,815.1 million. Cost of sales grew 17.9%, well below revenue growth, which drove the margin expansion. Sustaining the margin depends on high by-product metal prices.
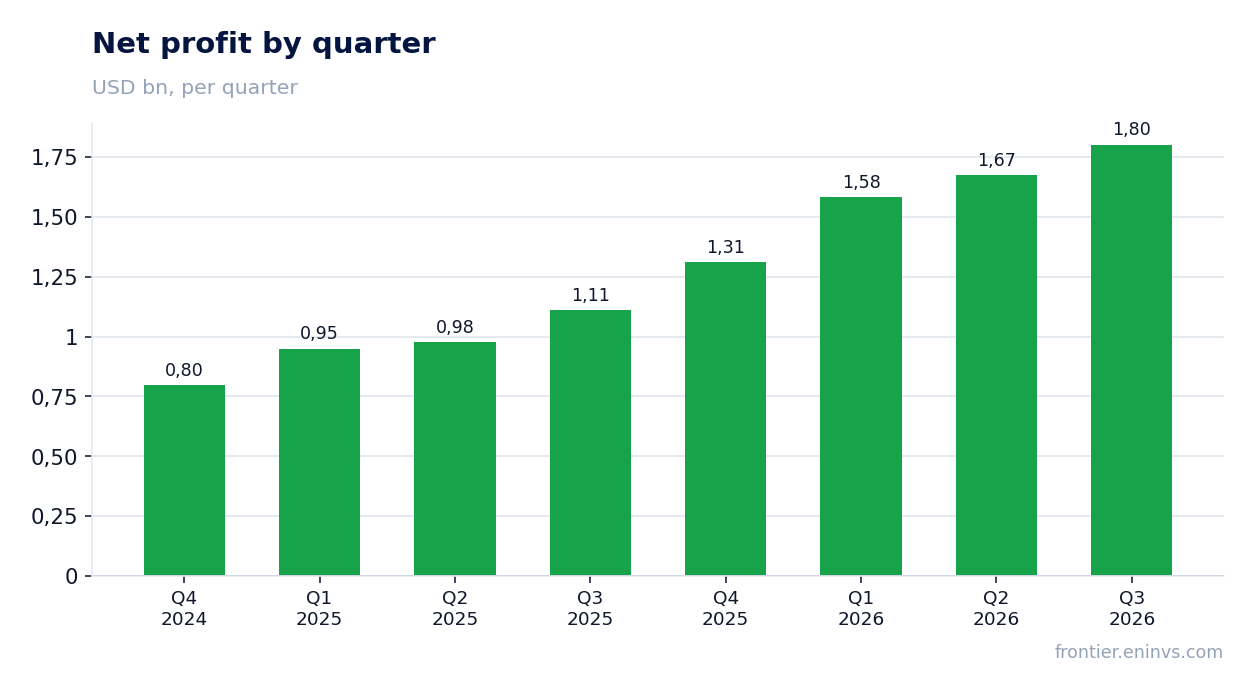
Net income rose 62.2%, but part of the gain came from higher interest income on accumulated cash
Net income attributable to Southern Copper shareholders in the third quarter was $1,801.8 million, up 62.2% year on year. The net margin rose to 38.4% from 32.9%. Earnings per share increased to $2.15 from $1.32.
Besides operating leverage, profit was supported by interest income, which rose 49.3% to $71.4 million as cash and short-term investments grew to $8,062.9 million. This is a one-off factor tied to liquidity accumulation rather than core operations.
The effective tax rate remained stable – income tax rose 59.9%, roughly in line with pre-tax profit growth. Minority interest is negligible. Earnings quality is high, but the sustainability of the record depends on metal prices.
Free cash flow after $515.8 million of capex remains solid, but project investment is rising too
Operating cash flow in the third quarter was $2,224.3 million, 42.6% above the year-earlier level, driven by high operating profit. Capital investment reached $515.8 million, up 47.7% year on year and equal to 28.6% of net income.
Free cash flow after capex remains positive and substantial, but the company is actively investing in projects. For the nine months, capex was $1,380.5 million, 52.9% more than a year earlier. The decade-long investment programme exceeds $15 billion, including the Tia Maria project in Peru (49.6% complete) and El Pilar in Mexico.
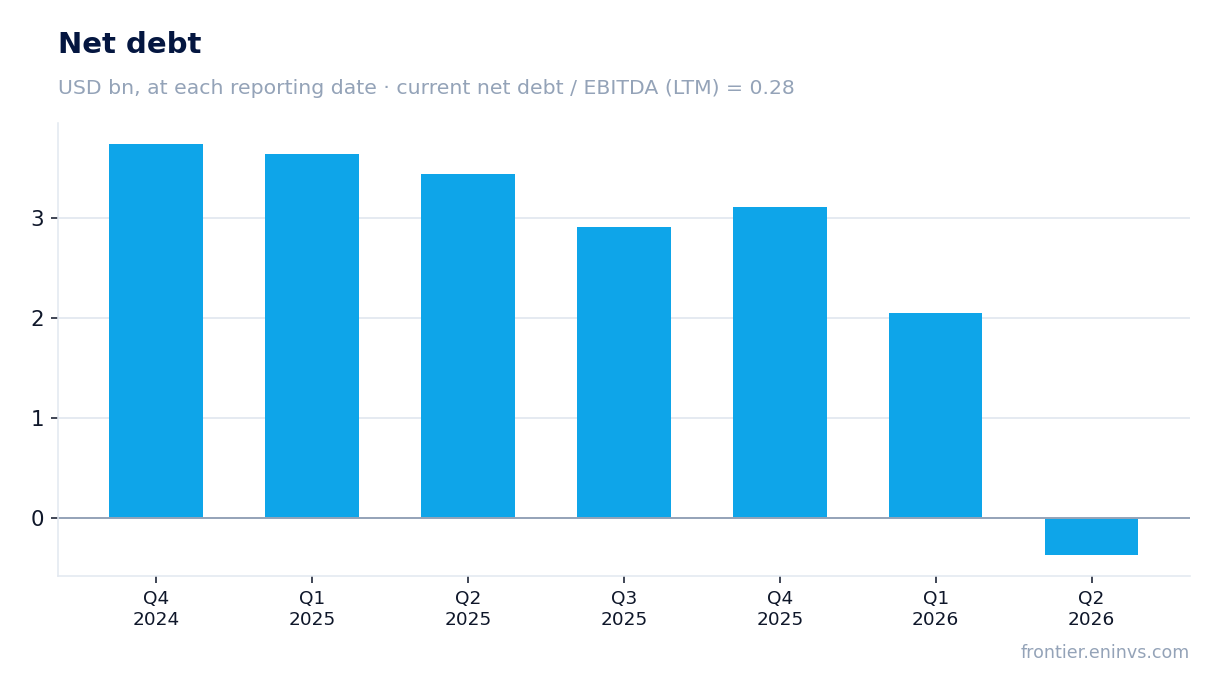
Leverage remains low: net debt at end-2025 was $3,108.9 million, and net debt to LTM EBITDA was 0.28. This is a comfortable level that poses no risk to dividends or investment.
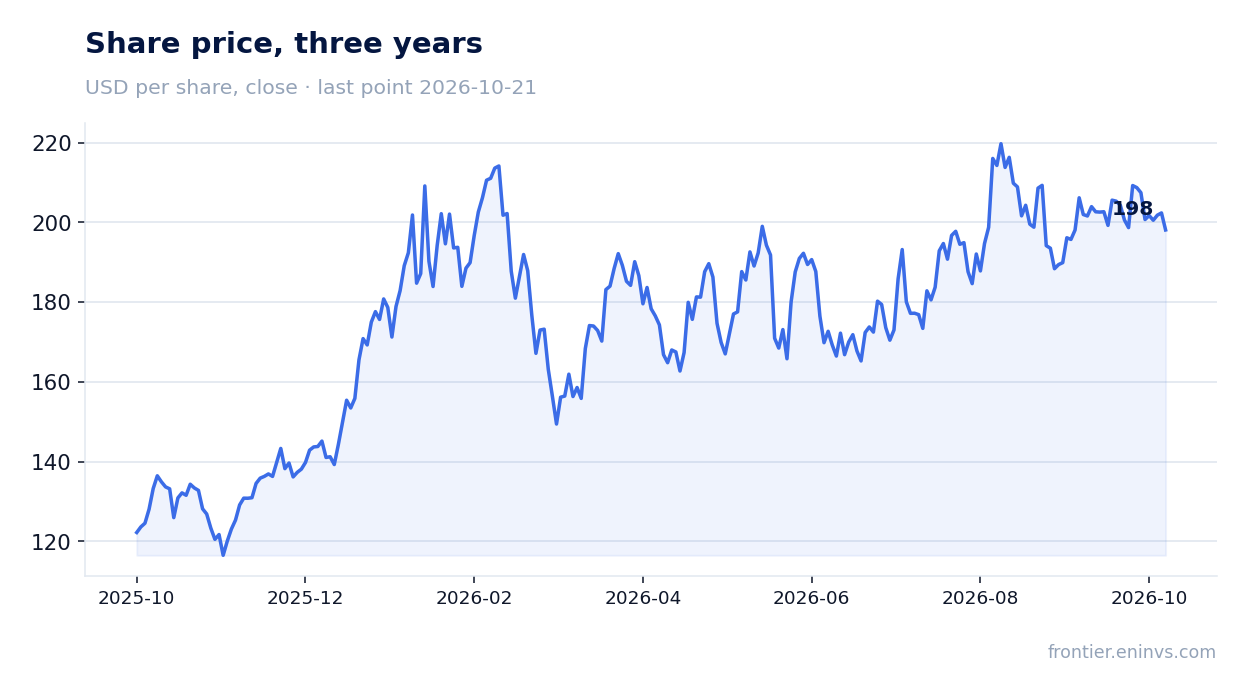
The $1.30 per share dividend and 1.97% yield do not offset the risk of a stretched valuation
On October 15, 2026, the board declared a quarterly cash dividend of $1.30 per share and a stock dividend of 0.0106 shares per share. Payment is due on November 19, 2026 to shareholders of record on November 3. In the third quarter the company paid $1.10 per share in cash dividends; for the nine months, $3.10.
The trailing 12-month dividend yield is 1.97%. This is a modest level that does not offset the risk tied to copper price cyclicality. The payout ratio remains high: dividends represent a significant share of net income, but the company also pays stock dividends, which helps preserve cash.
Our estimate for the 2026 dividend is about $5.2 per share based on current profit and a maintained payout ratio. However, this estimate depends on copper prices: lower prices would cut profit and the dividend. A 1.97% yield is below the key rate, making the stock less attractive for income investors.
EV/EBITDA of 15.4 is above its own three-year average of 14.1 – the stock is more expensive than its history
The trailing 12-month EV/EBITDA multiple is 15.4, 9% above its own three-year average of 14.1. This means the stock trades more expensively than usual relative to its history. The trailing P/E is 26.5, also implying a premium to historical levels.
The company's market capitalisation is $168.8 billion. Trailing 12-month net income was $6,369.8 million and EBITDA was $11,169.4 million. Profit growth was driven by high metal prices, which may correct.
The portal model, repricing EBITDA at current commodity prices and target multiples, implies –24% upside to fair value. This is the portal's own estimate, not a market consensus. It suggests the current share price embeds an optimistic copper price scenario.
The portal model implies –24% upside to fair value at current commodity prices
Our model values the share 24% below the current market price. This is a calculation based on current commodity prices and a target EV/EBITDA multiple. The model is not a recommendation but shows that the market is pricing in higher copper prices than current levels.
An upward revision would require sustained copper prices above $6.41 per pound and successful start-up of the Tia Maria and El Pilar projects, which would add about 156,000 tonnes of copper per year. A fall in copper prices below $6 per pound, by contrast, would cut profit and dividends.
In the next report, watch cash cost dynamics and production volumes. The 6.1% decline in Peruvian output may continue, limiting revenue growth even at high prices.
Valuation on the latest reported figures
| Metric | Value |
|---|---|
| Market cap | 169 bn USD |
| P/E (LTM) | 26.5 |
| EV/EBITDA (LTM) | 15.4 |
| P/B | 15.29 |
| Net debt / EBITDA (LTM) | 0.28 |
| Operating cash flow (LTM) | 7.40 bn |
| ROE | 18.4% |
| Dividend yield (12m) | 2.0% |
| EV/EBITDA, 3-year average | 14.1 |
Bottom line
The third-quarter 2026 report is exceptionally strong: record revenue, EBITDA and net income, a 64.7% EBITDA margin, and cash cost per pound of copper nearly zero. However, this result is primarily a consequence of high metal prices, not volume growth: copper output declined. The valuation is above its own history (EV/EBITDA 15.4 versus 14.1), and the portal model implies –24% upside. A 1.97% dividend yield does not compensate for the risk. Verdict – rather unattractive at the current level.
Open the company's financial profile SCCO →
See also: market overview · valuation map · stock screeners