Strathcona Resources: oil rose 31.7%, yet EBITDA came in 16.6% below what the price implied
Contents

On 11 November Strathcona Resources released its third-quarter 2026 results. Average WTI in the reported period was USD 85.4 per barrel against USD 64.9 a year earlier (+31.7%), and spot is now USD 86.2. Revenue reached USD 1,058.5m (+39.1% year on year), EBITDA USD 407.9m and net profit USD 212.1m. At the year-ago volumes and costs, with only prices moving, our calculation puts revenue at USD 977.9m and EBITDA at USD 488.9m; reported EBITDA came in USD 81.0m (16.6%) below that. Our conclusion: rather attractive – the portal's spot model puts the upside to fair value at +11%. Our view: the share is rather attractive at the current price; upside on the portal model +11%.
Our view: is there upside
Our view in numbers
| Metric | Our read |
|---|---|
| Verdict | Rather attractive |
| Upside on the portal model | +11% |
| How the model works | spot model: EBITDA re-priced to current commodity prices at the target EV/EBITDA, against market cap |
| EV/EBITDA now and 3-year average | 6.3 vs 4.4 – a 44% premium to its history |
| Dividend yield, 12m | 30.9% |
| Net debt / EBITDA | 1.24 – low leverage |
| Strongest case for | The portal's spot model puts the upside at +11%, and at current prices EV/EBITDA of 5.3 is below the three-year average of 4.4. |
| Strongest case against | With oil up 31.7%, EBITDA came in USD 81.0m (16.6%) below the price-implied figure, and net profit fell 49.0%. |
| What would change the view | If WTI falls below USD 70 a barrel, model EBITDA would drop by roughly a quarter and the verdict would move one step down. |
Key takeaways
— Oil rose 31.7% year on year but fell 7.9% quarter on quarter
— Our calculation says the price implied EBITDA of USD 488.9m; the company earned USD 407.9m – an USD 81.0m gap
— Revenue came in USD 80.6m above the price-implied figure, so volumes or the realised price offset weaker costs
— EBITDA margin rose to 38.5% from 35.7%, while net profit fell 49.0% on a high year-ago base
— Leverage of 1.24x LTM EBITDA is a moderate level, but the facts do not allow a direction for the ratio
— A 30.9% dividend yield is the main argument for the share, yet the payout rests on profit that halved this quarter
— EV/EBITDA LTM of 6.3 against its own three-year average of 4.4 is a 44% premium, and at current prices the multiple is already 5.3
Key figures, USD bn
| Metric | Q3 2025 | Q3 2026 | Change |
|---|---|---|---|
| Revenue | 0.76 | 1.06 | +39.1% |
| EBITDA | 0.27 | 0.41 | +49.9% |
| Operating profit | 0.19 | 0.29 | +53.7% |
| Net profit | 0.42 | 0.21 | -49.0% |
| Operating cash flow | 0.21 | 0.39 | +85.4% |
| EBITDA margin | 35.7% | 38.5% | +2.8 pp |
| Net margin | 54.6% | 20.0% | -34.6 pp |
Oil rose 31.7% year on year but fell 7.9% quarter on quarter
Average WTI in the third quarter of 2026 was USD 85.4 per barrel against USD 64.9 a year earlier – a rise of 31.7%. This is the main external driver of the report: the company sells oil, and its revenue and profit depend first of all on that price.
Against the previous quarter the barrel got cheaper: the second-quarter average was USD 92.8, 7.9% higher. Spot on 11 November is USD 86.2, 1.0% above the reported-period average. The price is holding near quarterly levels but no longer rising the way it did a year ago.
Commodity prices: period average and now
| Benchmark | Year ago | Q3 2026 | YoY | Spot 2026-11-11 |
|---|---|---|---|---|
| WTI, USD | 64,9 | 85,4 | +31,7% | 86,2 |
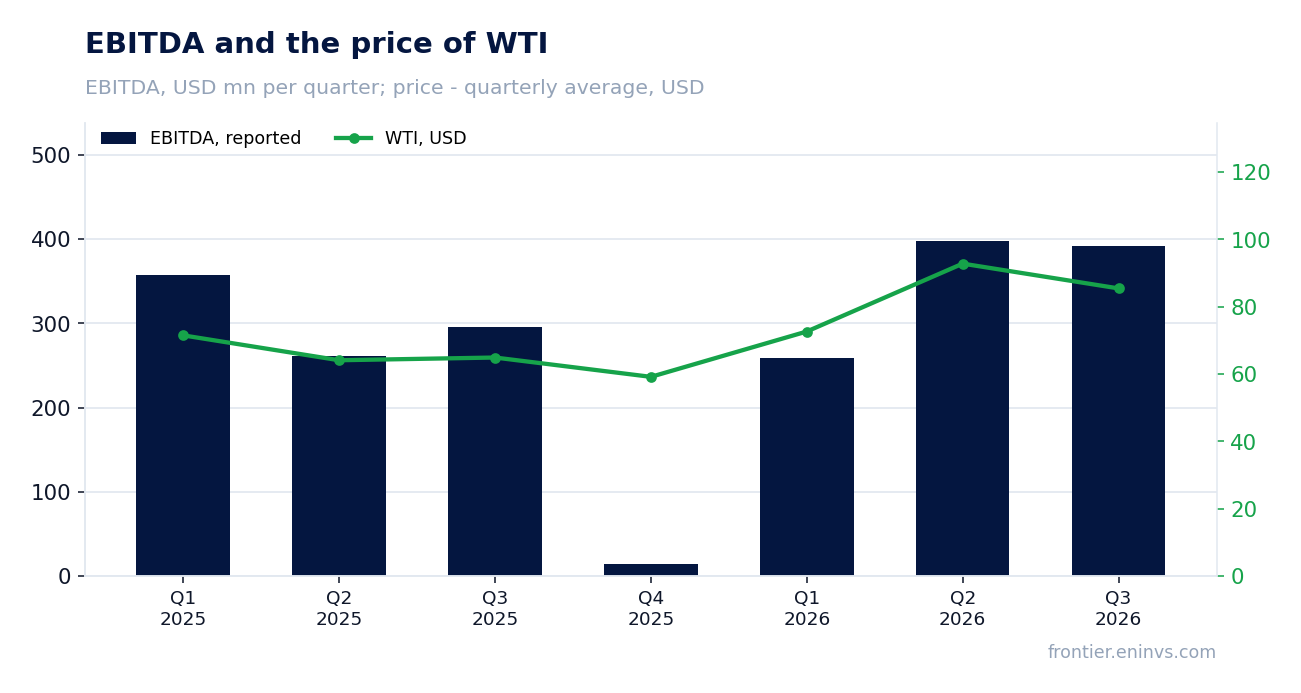
Our calculation says the price implied EBITDA of USD 488.9m; the company earned USD 407.9m – an USD 81.0m gap
Holding third-quarter 2025 volumes and non-commodity costs and moving only prices, revenue would have been USD 977.9m (a price effect of +USD 216.8m, +28.5%) and EBITDA USD 488.9m. Reported revenue was USD 1,058.5m, USD 80.6m (8.2%) above the price-implied figure, while EBITDA was USD 407.9m, USD 81.0m (16.6%) below.
The revenue and EBITDA gaps run in opposite directions: sales delivered more than the price implied, profit less. So volumes or the realised price were higher, but unit costs rose enough to eat both the price gain and the volume gain. The facts give no breakdown by production or unit cost, so the exact cause cannot be named – only that the cost side outweighed.
Against the previous quarter the picture is different: at second-quarter volumes and costs the price implied revenue of USD 1,053.2m and EBITDA of USD 317.4m. The reported USD 1,058.5m and USD 407.9m are USD 5.3m (0.5%) and USD 90.5m (28.5%) higher. Here the company beat the price-implied figure on both revenue and profit – quarter on quarter it did better than the price suggested.
What the prices implied and what the company earned
| Base (Q3 2025) | Implied at period prices | Reported | Reported vs implied | |
|---|---|---|---|---|
| Revenue, USD mn | 761,1 | 977,9 | 1 058 | +8,2% |
| EBITDA, USD mn | 272,1 | 488,9 | 407,9 | -16,6% |
Revenue and EBITDA by quarter
| Period | Measure | bn USD |
|---|---|---|
| Q1 2025 | Revenue | 0.822244 |
| Q2 2025 | Revenue | 0.719495 |
| Q3 2025 | Revenue | 0.761077 |
| Q4 2025 | Revenue | 0.688701 |
| Q1 2026 | Revenue | 0.824322 |
| Q2 2026 | Revenue | 1.134236 |
| Q3 2026 | Revenue | 1.058532 |
| Q1 2025 | EBITDA | 0.357951 |
| Q2 2025 | EBITDA | 0.261043 |
| Q3 2025 | EBITDA | 0.29528899999999997 |
| Q4 2025 | EBITDA | 0.013939000000000007 |
| Q1 2026 | EBITDA | 0.25878199999999996 |
| Q2 2026 | EBITDA | 0.398457 |
| Q3 2026 | EBITDA | 0.39223399999999997 |
EBITDA margin
| Period | Measure | % |
|---|---|---|
| Q1 2025 | EBITDA margin | 43.5 |
| Q2 2025 | EBITDA margin | 36.3 |
| Q3 2025 | EBITDA margin | 38.8 |
| Q4 2025 | EBITDA margin | 2.0 |
| Q1 2026 | EBITDA margin | 31.4 |
| Q2 2026 | EBITDA margin | 35.1 |
| Q3 2026 | EBITDA margin | 37.1 |
Revenue came in USD 80.6m above the price-implied figure, so volumes or the realised price offset weaker costs
Third-quarter revenue was USD 1,058.5m, 39.1% more than a year earlier. Growth slowed: it was 57.6% in the second quarter and 0.3% in the first. The deceleration is mainly a base effect: year-ago revenue was USD 761.1m, and the same price jump produces a smaller percentage from it than from the low first-quarter base.
The USD 80.6m excess over the price-implied figure means the company sold more or at a higher price than average WTI. The facts carry no production or realised-price data, so we state only this: the sales side did better than the oil market.
EBITDA margin rose to 38.5% from 35.7%, while net profit fell 49.0% on a high year-ago base
The EBITDA margin in the reported quarter was 38.5% against 35.7% a year earlier. Margin growth on a higher oil price is expected, but it lags the price: EBITDA rose 49.9% and revenue 39.1%, so costs grew slower than revenue but faster than price alone would allow.
Net profit was USD 212.1m against USD 415.7m a year earlier, a fall of 49.0%. The cause is the base: in the third quarter of 2025 profit was disproportionately high – USD 415.7m on EBITDA of USD 295.3m, meaning profit exceeded operating EBITDA, which happens with one-off gains below the operating line. This quarter has no such support, so profit is lower even though operations earned more.
The net margin fell to 20.0% from 54.6% – entirely a base effect, not an operating deterioration. Operating profit rose to USD 285.5m from USD 185.7m a year earlier, confirming that the weakness in the bottom line is accounting, not operational.
Leverage of 1.24x LTM EBITDA is a moderate level, but the facts do not allow a direction for the ratio
Net debt at 30 September 2026 was USD 1,247.3m, or 1.24x EBITDA for the last twelve months (USD 1,007.2m). The level is moderate: the company can service debt from current cash flow. We give no direction for the ratio – the facts carry no prior value.
Operating cash flow was USD 390.1m for the quarter and USD 1,225.9m for the last twelve months. Capital expenditure in the quarter was USD 171.6m, less than half of operating cash flow: after investment about USD 218.5m of free cash flow remains, out of which dividends and debt service are funded.
Valuation vs its own history
now vs the 3-year average
| Period | Measure | × |
|---|---|---|
| EV/EBITDA | Now | 6.34052211261543 |
| EV/EBITDA | 3-year average | 4.397116417986921 |
A 30.9% dividend yield is the main argument for the share, yet the payout rests on profit that halved this quarter
The trailing twelve-month dividend yield is 30.9% on the current market capitalisation of USD 5,495.3m. That is a very high level and by itself explains interest in the stock. Payouts over the past year rested on LTM profit of USD 409.3m and cash flow of USD 1,225.9m.
Our estimate for the current year: if LTM profit holds and the payout ratio embedded in the actual yield is maintained, the dividend stays near 30% of the price. The main risk to the payout is profit: it was USD 212.1m in the third quarter against USD 415.7m a year earlier, and if the high year-ago base is not repeated, LTM profit may fall and the dividend with it.
A 30.9% yield is well above the key rate, a strong argument in a market with such rates. But the durability of the payout depends on cash flow holding: free cash flow of about USD 218.5m in the quarter covers the dividend, yet a fall in oil prices would narrow the cushion.
Share price, three years
close, last point 2026-11-10
| Period | Measure | USD per share |
|---|---|---|
| 2025-11-10 | Closing price | 40.5 |
| 2025-11-11 | Closing price | 41.34000015258789 |
| 2025-11-12 | Closing price | 41.47999954223633 |
| 2025-11-13 | Closing price | 40.43000030517578 |
| 2025-11-14 | Closing price | 40.9900016784668 |
| 2025-11-17 | Closing price | 41.470001220703125 |
| 2025-11-18 | Closing price | 43.54999923706055 |
| 2025-11-19 | Closing price | 42.810001373291016 |
| 2025-11-20 | Closing price | 43.22999954223633 |
| 2025-11-21 | Closing price | 42.349998474121094 |
| 2025-11-24 | Closing price | 42.91999816894531 |
| 2025-11-25 | Closing price | 41.08000183105469 |
| 2025-11-26 | Closing price | 40.7599983215332 |
| 2025-11-27 | Closing price | 41.630001068115234 |
| 2025-11-28 | Closing price | 41.790000915527344 |
| 2025-12-01 | Closing price | 43.400001525878906 |
| 2025-12-02 | Closing price | 42.93000030517578 |
| 2025-12-03 | Closing price | 42.869998931884766 |
| 2025-12-04 | Closing price | 43.4900016784668 |
| 2025-12-05 | Closing price | 43.54999923706055 |
| 2025-12-08 | Closing price | 42.90999984741211 |
| 2025-12-09 | Closing price | 41.900001525878906 |
| 2025-12-10 | Closing price | 42.4900016784668 |
| 2025-12-11 | Closing price | 42.209999084472656 |
| 2025-12-12 | Closing price | 41.939998626708984 |
| 2025-12-15 | Closing price | 41.779998779296875 |
| 2025-12-16 | Closing price | 41.52000045776367 |
| 2025-12-17 | Closing price | 42.220001220703125 |
| 2025-12-18 | Closing price | 41.11000061035156 |
| 2025-12-19 | Closing price | 39.54999923706055 |
| 2025-12-22 | Closing price | 39.15999984741211 |
| 2025-12-23 | Closing price | 29.0 |
| 2025-12-24 | Closing price | 29.149999618530273 |
| 2025-12-29 | Closing price | 28.549999237060547 |
| 2025-12-30 | Closing price | 29.030000686645508 |
| 2025-12-31 | Closing price | 28.329999923706055 |
| 2026-01-02 | Closing price | 28.860000610351562 |
| 2026-01-05 | Closing price | 28.18000030517578 |
| 2026-01-06 | Closing price | 28.0 |
| 2026-01-07 | Closing price | 26.75 |
| 2026-01-08 | Closing price | 26.75 |
| 2026-01-09 | Closing price | 26.5 |
| 2026-01-12 | Closing price | 26.610000610351562 |
| 2026-01-13 | Closing price | 26.850000381469727 |
| 2026-01-14 | Closing price | 26.200000762939453 |
| 2026-01-15 | Closing price | 25.940000534057617 |
| 2026-01-16 | Closing price | 26.0 |
| 2026-01-19 | Closing price | 26.700000762939453 |
| 2026-01-20 | Closing price | 26.010000228881836 |
| 2026-01-21 | Closing price | 26.290000915527344 |
| 2026-01-22 | Closing price | 26.25 |
| 2026-01-23 | Closing price | 26.729999542236328 |
| 2026-01-26 | Closing price | 26.8799991607666 |
| 2026-01-27 | Closing price | 26.5 |
| 2026-01-28 | Closing price | 26.540000915527344 |
| 2026-01-29 | Closing price | 26.389999389648438 |
| 2026-01-30 | Closing price | 26.0 |
| 2026-02-02 | Closing price | 26.170000076293945 |
| 2026-02-03 | Closing price | 26.81999969482422 |
| 2026-02-04 | Closing price | 27.170000076293945 |
| 2026-02-05 | Closing price | 27.149999618530273 |
| 2026-02-06 | Closing price | 27.780000686645508 |
| 2026-02-09 | Closing price | 27.920000076293945 |
| 2026-02-10 | Closing price | 27.940000534057617 |
| 2026-02-11 | Closing price | 28.25 |
| 2026-02-12 | Closing price | 27.790000915527344 |
| 2026-02-13 | Closing price | 28.270000457763672 |
| 2026-02-17 | Closing price | 28.6200008392334 |
| 2026-02-18 | Closing price | 29.450000762939453 |
| 2026-02-19 | Closing price | 30.149999618530273 |
| 2026-02-20 | Closing price | 30.149999618530273 |
| 2026-02-23 | Closing price | 29.040000915527344 |
| 2026-02-24 | Closing price | 28.75 |
| 2026-02-25 | Closing price | 28.979999542236328 |
| 2026-02-26 | Closing price | 28.8700008392334 |
| 2026-02-27 | Closing price | 29.799999237060547 |
| 2026-03-02 | Closing price | 30.200000762939453 |
| 2026-03-03 | Closing price | 31.3700008392334 |
| 2026-03-04 | Closing price | 30.979999542236328 |
| 2026-03-05 | Closing price | 32.72999954223633 |
| 2026-03-06 | Closing price | 34.099998474121094 |
| 2026-03-09 | Closing price | 35.099998474121094 |
| 2026-03-10 | Closing price | 36.97999954223633 |
| 2026-03-11 | Closing price | 38.66999816894531 |
| 2026-03-12 | Closing price | 39.5099983215332 |
| 2026-03-13 | Closing price | 39.459999084472656 |
| 2026-03-16 | Closing price | 38.56999969482422 |
| 2026-03-17 | Closing price | 38.939998626708984 |
| 2026-03-18 | Closing price | 39.290000915527344 |
| 2026-03-19 | Closing price | 39.84000015258789 |
| 2026-03-20 | Closing price | 39.31999969482422 |
| 2026-03-23 | Closing price | 38.06999969482422 |
| 2026-03-24 | Closing price | 38.400001525878906 |
| 2026-03-25 | Closing price | 37.470001220703125 |
| 2026-03-26 | Closing price | 38.7400016784668 |
| 2026-03-27 | Closing price | 42.16999816894531 |
| 2026-03-30 | Closing price | 43.18000030517578 |
| 2026-03-31 | Closing price | 42.13999938964844 |
| 2026-04-01 | Closing price | 40.33000183105469 |
| 2026-04-02 | Closing price | 42.08000183105469 |
| 2026-04-06 | Closing price | 42.45000076293945 |
| 2026-04-07 | Closing price | 42.9900016784668 |
| 2026-04-08 | Closing price | 40.0099983215332 |
| 2026-04-09 | Closing price | 38.56999969482422 |
| 2026-04-10 | Closing price | 39.06999969482422 |
| 2026-04-13 | Closing price | 39.33000183105469 |
| 2026-04-14 | Closing price | 37.4900016784668 |
| 2026-04-15 | Closing price | 37.060001373291016 |
| 2026-04-16 | Closing price | 38.06999969482422 |
| 2026-04-17 | Closing price | 35.970001220703125 |
| 2026-04-20 | Closing price | 36.400001525878906 |
| 2026-04-21 | Closing price | 36.79999923706055 |
| 2026-04-22 | Closing price | 36.88999938964844 |
| 2026-04-23 | Closing price | 37.189998626708984 |
| 2026-04-24 | Closing price | 36.880001068115234 |
| 2026-04-27 | Closing price | 38.029998779296875 |
| 2026-04-28 | Closing price | 38.709999084472656 |
| 2026-04-29 | Closing price | 40.93000030517578 |
| 2026-04-30 | Closing price | 42.68000030517578 |
| 2026-05-01 | Closing price | 44.689998626708984 |
| 2026-05-04 | Closing price | 45.119998931884766 |
| 2026-05-05 | Closing price | 45.939998626708984 |
| 2026-05-06 | Closing price | 43.61000061035156 |
| 2026-05-07 | Closing price | 42.040000915527344 |
| 2026-05-08 | Closing price | 41.900001525878906 |
| 2026-05-11 | Closing price | 43.47999954223633 |
| 2026-05-12 | Closing price | 44.31999969482422 |
| 2026-05-13 | Closing price | 44.099998474121094 |
| 2026-05-14 | Closing price | 45.349998474121094 |
| 2026-05-15 | Closing price | 48.4900016784668 |
| 2026-05-19 | Closing price | 51.33000183105469 |
| 2026-05-20 | Closing price | 48.810001373291016 |
| 2026-05-21 | Closing price | 47.34000015258789 |
| 2026-05-22 | Closing price | 47.369998931884766 |
| 2026-05-25 | Closing price | 44.970001220703125 |
| 2026-05-26 | Closing price | 45.029998779296875 |
| 2026-05-27 | Closing price | 43.470001220703125 |
| 2026-05-28 | Closing price | 44.189998626708984 |
| 2026-05-29 | Closing price | 44.189998626708984 |
| 2026-06-01 | Closing price | 45.34000015258789 |
| 2026-06-02 | Closing price | 45.90999984741211 |
| 2026-06-03 | Closing price | 46.369998931884766 |
| 2026-06-04 | Closing price | 48.369998931884766 |
| 2026-06-05 | Closing price | 47.66999816894531 |
| 2026-06-08 | Closing price | 47.189998626708984 |
| 2026-06-09 | Closing price | 44.790000915527344 |
| 2026-06-10 | Closing price | 47.0 |
| 2026-06-11 | Closing price | 46.439998626708984 |
| 2026-06-12 | Closing price | 44.52000045776367 |
| 2026-06-15 | Closing price | 42.880001068115234 |
| 2026-06-16 | Closing price | 42.06999969482422 |
| 2026-06-17 | Closing price | 41.41999816894531 |
| 2026-06-18 | Closing price | 40.06999969482422 |
| 2026-06-19 | Closing price | 41.0099983215332 |
| 2026-06-22 | Closing price | 41.209999084472656 |
| 2026-06-23 | Closing price | 41.540000915527344 |
| 2026-06-24 | Closing price | 38.529998779296875 |
| 2026-06-25 | Closing price | 38.709999084472656 |
| 2026-06-26 | Closing price | 38.470001220703125 |
| 2026-06-29 | Closing price | 38.2599983215332 |
| 2026-06-30 | Closing price | 37.66999816894531 |
| 2026-07-02 | Closing price | 37.40999984741211 |
| 2026-07-03 | Closing price | 37.33000183105469 |
| 2026-07-06 | Closing price | 36.400001525878906 |
| 2026-07-07 | Closing price | 37.63999938964844 |
| 2026-07-08 | Closing price | 39.0 |
| 2026-07-09 | Closing price | 38.54999923706055 |
| 2026-07-10 | Closing price | 38.709999084472656 |
| 2026-07-13 | Closing price | 40.4900016784668 |
| 2026-07-14 | Closing price | 40.15999984741211 |
| 2026-07-15 | Closing price | 39.290000915527344 |
| 2026-07-16 | Closing price | 39.220001220703125 |
| 2026-07-17 | Closing price | 39.5 |
| 2026-07-20 | Closing price | 39.630001068115234 |
| 2026-07-21 | Closing price | 40.72999954223633 |
| 2026-07-22 | Closing price | 41.75 |
| 2026-07-23 | Closing price | 42.310001373291016 |
| 2026-07-24 | Closing price | 41.959999084472656 |
| 2026-07-27 | Closing price | 40.619998931884766 |
| 2026-07-28 | Closing price | 39.83000183105469 |
| 2026-07-29 | Closing price | 41.970001220703125 |
| 2026-07-30 | Closing price | 41.75 |
| 2026-07-31 | Closing price | 42.52000045776367 |
| 2026-08-04 | Closing price | 41.08000183105469 |
| 2026-08-05 | Closing price | 38.75 |
| 2026-08-06 | Closing price | 39.83000183105469 |
| 2026-08-07 | Closing price | 38.65999984741211 |
| 2026-08-10 | Closing price | 42.040000915527344 |
| 2026-08-11 | Closing price | 42.790000915527344 |
| 2026-08-12 | Closing price | 42.75 |
| 2026-08-13 | Closing price | 42.380001068115234 |
| 2026-08-14 | Closing price | 43.25 |
| 2026-08-17 | Closing price | 43.97999954223633 |
| 2026-08-18 | Closing price | 44.560001373291016 |
| 2026-08-19 | Closing price | 44.279998779296875 |
| 2026-08-20 | Closing price | 44.65999984741211 |
| 2026-08-21 | Closing price | 44.20000076293945 |
| 2026-08-24 | Closing price | 43.439998626708984 |
| 2026-08-25 | Closing price | 41.97999954223633 |
| 2026-08-26 | Closing price | 42.15999984741211 |
| 2026-08-27 | Closing price | 43.130001068115234 |
| 2026-08-28 | Closing price | 42.189998626708984 |
| 2026-08-31 | Closing price | 42.77000045776367 |
| 2026-09-01 | Closing price | 44.130001068115234 |
| 2026-09-02 | Closing price | 43.61000061035156 |
| 2026-09-03 | Closing price | 42.97999954223633 |
| 2026-09-04 | Closing price | 43.11000061035156 |
| 2026-09-08 | Closing price | 44.310001373291016 |
| 2026-09-09 | Closing price | 45.349998474121094 |
| 2026-09-10 | Closing price | 44.65999984741211 |
| 2026-09-11 | Closing price | 44.220001220703125 |
| 2026-09-14 | Closing price | 44.560001373291016 |
| 2026-09-15 | Closing price | 45.93000030517578 |
| 2026-09-16 | Closing price | 42.849998474121094 |
| 2026-09-17 | Closing price | 42.90999984741211 |
| 2026-09-18 | Closing price | 42.31999969482422 |
| 2026-09-21 | Closing price | 40.70000076293945 |
| 2026-09-22 | Closing price | 39.5 |
| 2026-09-23 | Closing price | 39.41999816894531 |
| 2026-09-24 | Closing price | 39.56999969482422 |
| 2026-09-25 | Closing price | 38.810001373291016 |
| 2026-09-28 | Closing price | 39.09000015258789 |
| 2026-09-29 | Closing price | 38.56999969482422 |
| 2026-09-30 | Closing price | 38.779998779296875 |
| 2026-10-01 | Closing price | 38.959999084472656 |
| 2026-10-02 | Closing price | 39.380001068115234 |
| 2026-10-05 | Closing price | 40.20000076293945 |
| 2026-10-06 | Closing price | 40.20000076293945 |
| 2026-10-07 | Closing price | 39.900001525878906 |
| 2026-10-08 | Closing price | 40.22999954223633 |
| 2026-10-09 | Closing price | 40.029998779296875 |
| 2026-10-13 | Closing price | 41.349998474121094 |
| 2026-10-14 | Closing price | 41.36000061035156 |
| 2026-10-15 | Closing price | 41.72999954223633 |
| 2026-10-16 | Closing price | 43.95000076293945 |
| 2026-10-19 | Closing price | 44.790000915527344 |
| 2026-10-20 | Closing price | 44.310001373291016 |
| 2026-10-21 | Closing price | 43.599998474121094 |
| 2026-10-22 | Closing price | 42.84000015258789 |
| 2026-10-23 | Closing price | 44.11000061035156 |
| 2026-10-26 | Closing price | 44.20000076293945 |
| 2026-10-27 | Closing price | 42.880001068115234 |
| 2026-10-28 | Closing price | 42.90999984741211 |
| 2026-10-29 | Closing price | 42.380001068115234 |
| 2026-10-30 | Closing price | 42.869998931884766 |
| 2026-11-02 | Closing price | 38.439998626708984 |
| 2026-11-03 | Closing price | 38.36000061035156 |
| 2026-11-04 | Closing price | 35.630001068115234 |
| 2026-11-05 | Closing price | 35.29999923706055 |
| 2026-11-06 | Closing price | 36.34000015258789 |
| 2026-11-09 | Closing price | 36.0 |
| 2026-11-10 | Closing price | 36.31999969482422 |
EV/EBITDA LTM of 6.3 against its own three-year average of 4.4 is a 44% premium, and at current prices the multiple is already 5.3
On EV/EBITDA LTM of 6.3 the share trades 44% above its own three-year average of 4.4. That is a premium to its own history and means the market has already priced in part of future growth. P/E LTM is 13.4 and ROE 25.6%.
But LTM reflects past oil prices. On the portal's spot model, at today's prices annual EBITDA would be USD 1,277.4m against USD 991.1m in the LTM model (+28.9%), and EV/EBITDA at current prices is 5.3 with net debt/EBITDA at 0.98. On that basis the multiple is already below the three-year average and the valuation looks different.
On the portal's model, fair value is 11% above the current price. That upside outweighs the LTM-multiple premium: the market is paying for future earnings that, at current prices, are higher than past ones.
Valuation on the latest reported figures
| Metric | Value |
|---|---|
| Market cap | 5.50 bn USD |
| P/E (LTM) | 13.4 |
| EV/EBITDA (LTM) | 6.3 |
| P/B | 1.73 |
| Net debt / EBITDA (LTM) | 1.24 |
| Operating cash flow (LTM) | 1.23 bn |
| ROE | 25.6% |
| Dividend yield (12m) | 30.9% |
| EV/EBITDA, 3-year average | 4.4 |
Net profit by quarter
| Period | Measure | bn USD |
|---|---|---|
| Q1 2025 | Net profit | 0.14318 |
| Q2 2025 | Net profit | 0.16703800000000002 |
| Q3 2025 | Net profit | 0.41572699999999996 |
| Q4 2025 | Net profit | −0.070702 |
| Q1 2026 | Net profit | 0.02835 |
| Q2 2026 | Net profit | 0.239506 |
| Q3 2026 | Net profit | 0.21213300000000002 |
Bottom line
The strong side of the report is operational: EBITDA rose 49.9%, the margin climbed to 38.5%, and free cash flow of USD 218.5m covers the dividend. The weakness is in the price: with oil up 31.7%, the company earned USD 81.0m less than the price implied, and that is the main question for the report. Net profit fell 49.0% on a high year-ago base, not on operations. The portal's spot model puts the upside at +11%, which outweighs the LTM multiple's 44% premium to its own history. Our conclusion: rather attractive – an upside of +11% on the portal's model. Our view: the share is rather attractive at the current price; upside on the portal model +11%.