Silvercorp Metals: silver up 57.6% but revenue down 12.5% – the company sold less metal
Contents
On 11 November Silvercorp Metals released results for the second quarter of fiscal 2027 (July-September 2026). The average silver price in the period was USD 62.8 versus USD 39.9 a year earlier (+57.6%), and gold rose 23.4% to USD 4,268. At those prices with year-ago volumes and costs, revenue should have been USD 121.4m and EBITDA USD 83.7m on our calculation; actual revenue was USD 72.1m and EBITDA USD 34.4m, USD 49.3m below the price-implied figure. Our conclusion: rather unattractive – on the portal's model the share trades 37% above fair value. Our view: the share is rather unattractive at the current price; upside on the portal model -37%.
Our view: is there upside
Our view in numbers
| Metric | Our read |
|---|---|
| Verdict | Rather unattractive |
| Upside on the portal model | -37% |
| How the model works | spot model: EBITDA re-priced to current commodity prices at the target EV/EBITDA, against market cap |
| EV/EBITDA now and 3-year average | 6.0 vs 6.9 – a 13% discount to its history |
| Dividend yield, 12m | 0.1% |
| Net debt / EBITDA | -0.88 – net cash |
| Strongest case for | Net cash of USD 262.4m and operating cash flow of USD 62.7m against capex of USD 11.1m give the company a margin of safety most silver producers lack. |
| Strongest case against | With silver 57.6% more expensive year on year, EBITDA was USD 34.4m against a price-implied USD 83.7m – the company sold less metal and lost 58.9% of the potential profit. |
| What would change the view | Silver rising above USD 62.8, the reported-period average, or sales volumes recovering to year-ago levels would move the verdict one step up, to neutral. |
Key takeaways
— Silver rose 57.6% year on year but revenue fell 12.5% – the company sold less metal
— At the period's prices and year-ago volumes, EBITDA should have been USD 83.7m on our calculation versus the reported USD 34.4m
— The EBITDA margin fell to 47.8% from 54.3% – higher prices did not reach profit
— Net profit of USD 5.3m at a 7.4% margin is a swing from a USD 11.4m loss a year earlier
— Net cash of USD 262.4m and strong operating cash flow of USD 62.7m against capex of USD 11.1m
— Trailing dividend yield is just 0.14% – the dividend is not an argument for the share
— EV/EBITDA of 6.0 is 13% below its own three-year average of 6.9, but on the portal's spot model the share is 37% above fair value
Key figures, USD bn
| Metric | Q3 2025 | Q3 2026 | Change |
|---|---|---|---|
| Revenue | 0.08 | 0.07 | -12.5% |
| EBITDA | 0.04 | 0.03 | -23.1% |
| Operating profit | 0.04 | 0.03 | -25.6% |
| Net profit | -0.01 | 0.01 | to profit |
| Operating cash flow | 0.04 | 0.06 | +61.8% |
| Capex | 0.03 | 0.01 | -59.8% |
| EBITDA margin | 54.3% | 47.8% | -6.5 pp |
| Net margin | -13.8% | 7.4% | +21.2 pp |
Silver rose 57.6% year on year but revenue fell 12.5% – the company sold less metal
The average silver price in the reported period was USD 62.8 versus USD 39.9 a year earlier, up 57.6%. Gold rose 23.4% to USD 4,268. Against that backdrop revenue should have grown, but it fell 12.5% year on year to USD 72.1m from USD 82.4m a year earlier.
The gap is explained by volumes: at the period's prices and year-ago volumes revenue would have been USD 121.4m on our calculation, USD 49.3m above the actual figure. The company sold less metal than a year earlier, and that outweighed the price rise.
Against the previous quarter the picture is the same: at the previous quarter's volumes and costs and the period's prices revenue would have been USD 122.7m, USD 50.6m above the actual figure. Silver fell 14.1% quarter on quarter to USD 62.8 and gold 5.5% to USD 4,268.
Silver now trades at USD 52.3 on 11 November, 16.8% below the reported-period average, and gold at USD 4,045, 5.2% below. The price backdrop in the next quarter will be weaker than in the reported one.
Commodity prices: period average and now
| Benchmark | Year ago | Q2 2026 | YoY | Spot 2026-11-11 |
|---|---|---|---|---|
| Silver, USD | 39,9 | 62,8 | +57,6% | 52,3 |
| Gold, USD | 3 459 | 4 268 | +23,4% | 4 045 |
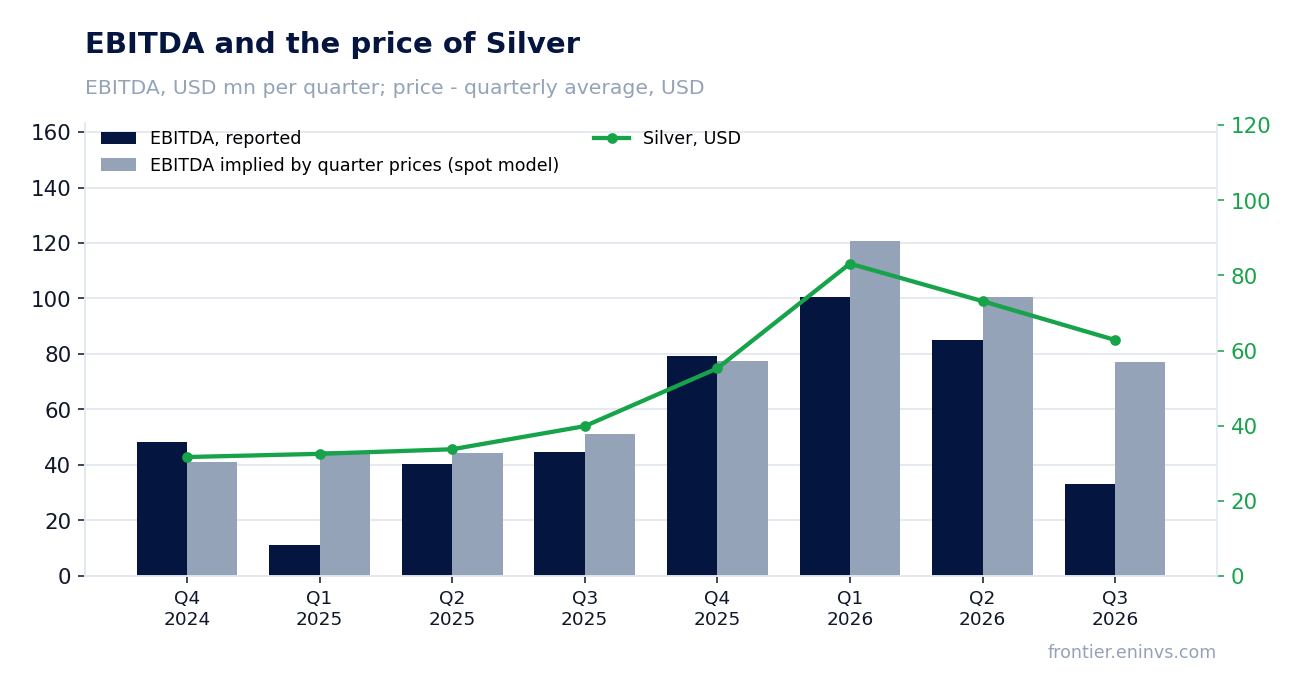
At the period's prices and year-ago volumes, EBITDA should have been USD 83.7m on our calculation versus the reported USD 34.4m
At the period's prices with year-ago volumes and non-commodity costs, EBITDA would have been USD 83.7m on our calculation. Reported EBITDA was USD 34.4m, USD 49.3m and 58.9% lower. The price effect alone would have added USD 39.0m, or 47.3%, to revenue.
The portal's spot model, re-priced to the period's prices from the average of the previous four quarters, expected EBITDA of USD 77.2m and revenue of USD 124.6m. Actual figures were 55.4% and 42.1% below. In the four prior periods the EBITDA deviation from the model ranged from -17.0% to +2.4%, so the current gap is several times larger than usual.
The gap is explained by sales volumes and, given its scale, by the realised price against the benchmark. No other causes – hedges, one-offs, non-producing revenue – appear in the disclosure. EBITDA is positive, there is no loss, but the company earned a fraction of what prices allowed.
What the prices implied and what the company earned
| Base (Q2 2025) | Implied at period prices | Reported | Reported vs implied | |
|---|---|---|---|---|
| Revenue, USD mn | 82,4 | 121,4 | 72,1 | -40,6% |
| EBITDA, USD mn | 44,8 | 83,7 | 34,4 | -58,9% |
| EBITDA, portal spot model, USD mn | — | 77,2 | 34,4 | -55,4% |
Revenue and EBITDA by quarter
| Period | Measure | bn USD |
|---|---|---|
| Q4 2024 | Revenue | 0.08361400000000001 |
| Q1 2025 | Revenue | 0.075113 |
| Q2 2025 | Revenue | 0.081334 |
| Q3 2025 | Revenue | 0.08240600000000001 |
| Q4 2025 | Revenue | 0.126112 |
| Q1 2026 | Revenue | 0.14735900000000002 |
| Q2 2026 | Revenue | 0.13866499999999998 |
| Q3 2026 | Revenue | 0.072097 |
| Q4 2024 | EBITDA | 0.048386 |
| Q1 2025 | EBITDA | 0.011054999999999999 |
| Q2 2025 | EBITDA | 0.04025 |
| Q3 2025 | EBITDA | 0.04475 |
| Q4 2025 | EBITDA | 0.079276 |
| Q1 2026 | EBITDA | 0.10039800000000002 |
| Q2 2026 | EBITDA | 0.085054 |
| Q3 2026 | EBITDA | 0.032982 |
EBITDA margin
| Period | Measure | % |
|---|---|---|
| Q4 2024 | EBITDA margin | 57.9 |
| Q1 2025 | EBITDA margin | 14.7 |
| Q2 2025 | EBITDA margin | 49.5 |
| Q3 2025 | EBITDA margin | 54.3 |
| Q4 2025 | EBITDA margin | 62.9 |
| Q1 2026 | EBITDA margin | 68.1 |
| Q2 2026 | EBITDA margin | 61.3 |
| Q3 2026 | EBITDA margin | 45.7 |
The EBITDA margin fell to 47.8% from 54.3% – higher prices did not reach profit
The EBITDA margin in the reported period was 47.8% versus 54.3% a year earlier. With silver up 57.6% and gold up 23.4%, the margin should have widened, but it narrowed by 6.5 percentage points.
The cause is volumes: fixed and semi-fixed costs were spread over lower revenue. EBITDA fell 23.1% year on year to USD 34.4m while revenue fell 12.5%. Operating profit was USD 26.8m.
For a mining company this means the price rise did not offset the fall in sales. Until volumes recover, the margin will lag the price backdrop.
Net profit of USD 5.3m at a 7.4% margin is a swing from a USD 11.4m loss a year earlier
Net profit in the reported period was USD 5.3m at a 7.4% margin. A year earlier there was a USD 11.4m loss at a -13.8% margin. The swing came with EBITDA down 23.1%, so something below operating profit improved.
Profit is small relative to EBITDA of USD 34.4m and operating profit of USD 26.8m: about USD 21.5m of costs and taxes sit between them and the bottom line. No one-off items are named in the disclosure, so the swing can only be explained by the combination of those lines.
Over the last 12 months net profit was USD 48.1m on revenue of USD 484.2m and EBITDA of USD 299.2m. The quarterly profit fits poorly into that series – it is several times below the average.
Net cash of USD 262.4m and strong operating cash flow of USD 62.7m against capex of USD 11.1m
As of 30 September 2026 the company had net cash of USD 262.4m – debt is lower than cash. Net debt to EBITDA over the last 12 months is -0.88, meaning the company runs a liquidity surplus.
Operating cash flow in the reported period was USD 62.7m against capex of USD 11.1m. Free cash flow after investment is about USD 51.6m, almost twice EBITDA of USD 34.4m thanks to working-capital movements.
Capex of USD 11.1m is well below the previous quarter's USD 93.1m and the year-ago USD 27.5m. That may mean the investment phase is over or a seasonal lull in spending; it has not yet helped volumes.
Over the last 12 months operating cash flow was USD 347.5m. With that liquidity the company can fund development without debt, and that is the main argument for resilience.
Valuation vs its own history
now vs the 3-year average
| Period | Measure | × |
|---|---|---|
| EV/EBITDA | Now | 6.034350955975077 |
| EV/EBITDA | 3-year average | 6.899656861909816 |
Trailing dividend yield is just 0.14% – the dividend is not an argument for the share
The trailing 12-month dividend yield is 0.14% on a market capitalisation of USD 2,058.9m. It is a token payment that does not affect the share's return.
With net profit of USD 48.1m over 12 months and net cash of USD 262.4m the company could pay more, but policy favours reinvestment. Our estimate: the dividend will stay negligible this year unless profit rises several-fold.
Against the key rate, a 0.14% yield is uncompetitive. The dividend is not a reason to hold the share and can be ignored in the attractiveness assessment.
Share price, three years
close, last point 2026-11-10
| Period | Measure | USD per share |
|---|---|---|
| 2025-11-10 | Closing price | 6.800000190734863 |
| 2025-11-11 | Closing price | 6.730000019073486 |
| 2025-11-12 | Closing price | 7.059999942779541 |
| 2025-11-13 | Closing price | 6.869999885559082 |
| 2025-11-14 | Closing price | 6.769999980926514 |
| 2025-11-17 | Closing price | 6.599999904632568 |
| 2025-11-18 | Closing price | 6.53000020980835 |
| 2025-11-19 | Closing price | 6.579999923706055 |
| 2025-11-20 | Closing price | 6.239999771118164 |
| 2025-11-21 | Closing price | 6.28000020980835 |
| 2025-11-24 | Closing price | 6.690000057220459 |
| 2025-11-25 | Closing price | 6.809999942779541 |
| 2025-11-26 | Closing price | 7.199999809265137 |
| 2025-11-28 | Closing price | 7.820000171661377 |
| 2025-12-01 | Closing price | 7.96999979019165 |
| 2025-12-02 | Closing price | 7.940000057220459 |
| 2025-12-03 | Closing price | 7.940000057220459 |
| 2025-12-04 | Closing price | 7.829999923706055 |
| 2025-12-05 | Closing price | 7.909999847412109 |
| 2025-12-08 | Closing price | 7.820000171661377 |
| 2025-12-09 | Closing price | 8.1899995803833 |
| 2025-12-10 | Closing price | 8.260000228881836 |
| 2025-12-11 | Closing price | 8.539999961853027 |
| 2025-12-12 | Closing price | 8.130000114440918 |
| 2025-12-15 | Closing price | 8.5600004196167 |
| 2025-12-16 | Closing price | 8.59000015258789 |
| 2025-12-17 | Closing price | 8.6899995803833 |
| 2025-12-18 | Closing price | 8.460000038146973 |
| 2025-12-19 | Closing price | 8.649999618530273 |
| 2025-12-22 | Closing price | 8.920000076293945 |
| 2025-12-23 | Closing price | 8.640000343322754 |
| 2025-12-24 | Closing price | 8.59000015258789 |
| 2025-12-26 | Closing price | 8.899999618530273 |
| 2025-12-29 | Closing price | 8.279999732971191 |
| 2025-12-30 | Closing price | 8.579999923706055 |
| 2025-12-31 | Closing price | 8.34000015258789 |
| 2026-01-02 | Closing price | 8.34000015258789 |
| 2026-01-05 | Closing price | 8.760000228881836 |
| 2026-01-06 | Closing price | 9.25 |
| 2026-01-07 | Closing price | 8.989999771118164 |
| 2026-01-08 | Closing price | 8.960000038146973 |
| 2026-01-09 | Closing price | 9.199999809265137 |
| 2026-01-12 | Closing price | 9.6899995803833 |
| 2026-01-13 | Closing price | 9.850000381469727 |
| 2026-01-14 | Closing price | 10.069999694824219 |
| 2026-01-15 | Closing price | 10.199999809265137 |
| 2026-01-16 | Closing price | 11.3100004196167 |
| 2026-01-20 | Closing price | 12.239999771118164 |
| 2026-01-21 | Closing price | 11.920000076293945 |
| 2026-01-22 | Closing price | 12.279999732971191 |
| 2026-01-23 | Closing price | 12.9399995803833 |
| 2026-01-26 | Closing price | 12.770000457763672 |
| 2026-01-27 | Closing price | 12.680000305175781 |
| 2026-01-28 | Closing price | 12.760000228881836 |
| 2026-01-29 | Closing price | 12.100000381469727 |
| 2026-01-30 | Closing price | 10.069999694824219 |
| 2026-02-02 | Closing price | 10.010000228881836 |
| 2026-02-03 | Closing price | 10.739999771118164 |
| 2026-02-04 | Closing price | 10.619999885559082 |
| 2026-02-05 | Closing price | 9.579999923706055 |
| 2026-02-06 | Closing price | 10.40999984741211 |
| 2026-02-09 | Closing price | 10.779999732971191 |
| 2026-02-10 | Closing price | 10.880000114440918 |
| 2026-02-11 | Closing price | 11.470000267028809 |
| 2026-02-12 | Closing price | 10.180000305175781 |
| 2026-02-13 | Closing price | 10.979999542236328 |
| 2026-02-17 | Closing price | 10.399999618530273 |
| 2026-02-18 | Closing price | 10.859999656677246 |
| 2026-02-19 | Closing price | 11.09000015258789 |
| 2026-02-20 | Closing price | 11.680000305175781 |
| 2026-02-23 | Closing price | 12.390000343322754 |
| 2026-02-24 | Closing price | 13.149999618530273 |
| 2026-02-25 | Closing price | 13.130000114440918 |
| 2026-02-26 | Closing price | 13.770000457763672 |
| 2026-02-27 | Closing price | 13.930000305175781 |
| 2026-03-02 | Closing price | 13.5600004196167 |
| 2026-03-03 | Closing price | 12.329999923706055 |
| 2026-03-04 | Closing price | 12.6899995803833 |
| 2026-03-05 | Closing price | 11.84000015258789 |
| 2026-03-06 | Closing price | 11.829999923706055 |
| 2026-03-09 | Closing price | 11.569999694824219 |
| 2026-03-10 | Closing price | 12.3100004196167 |
| 2026-03-11 | Closing price | 11.850000381469727 |
| 2026-03-12 | Closing price | 11.539999961853027 |
| 2026-03-13 | Closing price | 10.800000190734863 |
| 2026-03-16 | Closing price | 11.100000381469727 |
| 2026-03-17 | Closing price | 10.84000015258789 |
| 2026-03-18 | Closing price | 10.0600004196167 |
| 2026-03-19 | Closing price | 9.479999542236328 |
| 2026-03-20 | Closing price | 9.130000114440918 |
| 2026-03-23 | Closing price | 9.359999656677246 |
| 2026-03-24 | Closing price | 9.789999961853027 |
| 2026-03-25 | Closing price | 10.369999885559082 |
| 2026-03-26 | Closing price | 9.6899995803833 |
| 2026-03-27 | Closing price | 10.229999542236328 |
| 2026-03-30 | Closing price | 10.029999732971191 |
| 2026-03-31 | Closing price | 10.739999771118164 |
| 2026-04-01 | Closing price | 11.100000381469727 |
| 2026-04-02 | Closing price | 10.989999771118164 |
| 2026-04-06 | Closing price | 11.100000381469727 |
| 2026-04-07 | Closing price | 11.180000305175781 |
| 2026-04-08 | Closing price | 11.229999542236328 |
| 2026-04-09 | Closing price | 11.1899995803833 |
| 2026-04-10 | Closing price | 11.5 |
| 2026-04-13 | Closing price | 11.789999961853027 |
| 2026-04-14 | Closing price | 12.399999618530273 |
| 2026-04-15 | Closing price | 12.350000381469727 |
| 2026-04-16 | Closing price | 12.649999618530273 |
| 2026-04-17 | Closing price | 12.84000015258789 |
| 2026-04-20 | Closing price | 12.4399995803833 |
| 2026-04-21 | Closing price | 11.920000076293945 |
| 2026-04-22 | Closing price | 12.520000457763672 |
| 2026-04-23 | Closing price | 12.140000343322754 |
| 2026-04-24 | Closing price | 12.510000228881836 |
| 2026-04-27 | Closing price | 12.5 |
| 2026-04-28 | Closing price | 11.789999961853027 |
| 2026-04-29 | Closing price | 11.479999542236328 |
| 2026-04-30 | Closing price | 11.989999771118164 |
| 2026-05-01 | Closing price | 12.260000228881836 |
| 2026-05-04 | Closing price | 12.170000076293945 |
| 2026-05-05 | Closing price | 12.039999961853027 |
| 2026-05-06 | Closing price | 13.010000228881836 |
| 2026-05-07 | Closing price | 13.449999809265137 |
| 2026-05-08 | Closing price | 13.5 |
| 2026-05-11 | Closing price | 14.75 |
| 2026-05-12 | Closing price | 15.1899995803833 |
| 2026-05-13 | Closing price | 15.710000038146973 |
| 2026-05-14 | Closing price | 14.949999809265137 |
| 2026-05-15 | Closing price | 13.569999694824219 |
| 2026-05-18 | Closing price | 13.15999984741211 |
| 2026-05-19 | Closing price | 12.319999694824219 |
| 2026-05-20 | Closing price | 12.5600004196167 |
| 2026-05-21 | Closing price | 12.229999542236328 |
| 2026-05-22 | Closing price | 11.829999923706055 |
| 2026-05-26 | Closing price | 12.489999771118164 |
| 2026-05-27 | Closing price | 11.949999809265137 |
| 2026-05-28 | Closing price | 12.420000076293945 |
| 2026-05-29 | Closing price | 12.670000076293945 |
| 2026-06-01 | Closing price | 12.869999885559082 |
| 2026-06-02 | Closing price | 13.210000038146973 |
| 2026-06-03 | Closing price | 12.260000228881836 |
| 2026-06-04 | Closing price | 12.350000381469727 |
| 2026-06-05 | Closing price | 10.640000343322754 |
| 2026-06-08 | Closing price | 10.65999984741211 |
| 2026-06-09 | Closing price | 10.069999694824219 |
| 2026-06-10 | Closing price | 9.569999694824219 |
| 2026-06-11 | Closing price | 10.510000228881836 |
| 2026-06-12 | Closing price | 11.300000190734863 |
| 2026-06-15 | Closing price | 12.180000305175781 |
| 2026-06-16 | Closing price | 12.640000343322754 |
| 2026-06-17 | Closing price | 11.880000114440918 |
| 2026-06-18 | Closing price | 11.319999694824219 |
| 2026-06-22 | Closing price | 11.170000076293945 |
| 2026-06-23 | Closing price | 10.579999923706055 |
| 2026-06-24 | Closing price | 10.399999618530273 |
| 2026-06-25 | Closing price | 10.609999656677246 |
| 2026-06-26 | Closing price | 10.869999885559082 |
| 2026-06-29 | Closing price | 10.920000076293945 |
| 2026-06-30 | Closing price | 10.100000381469727 |
| 2026-07-01 | Closing price | 10.0600004196167 |
| 2026-07-02 | Closing price | 10.270000457763672 |
| 2026-07-06 | Closing price | 9.960000038146973 |
| 2026-07-07 | Closing price | 9.369999885559082 |
| 2026-07-08 | Closing price | 9.109999656677246 |
| 2026-07-09 | Closing price | 9.59000015258789 |
| 2026-07-10 | Closing price | 9.520000457763672 |
| 2026-07-13 | Closing price | 9.220000267028809 |
| 2026-07-14 | Closing price | 9.380000114440918 |
| 2026-07-15 | Closing price | 9.329999923706055 |
| 2026-07-16 | Closing price | 8.819999694824219 |
| 2026-07-17 | Closing price | 8.920000076293945 |
| 2026-07-20 | Closing price | 8.90999984741211 |
| 2026-07-21 | Closing price | 9.529999732971191 |
| 2026-07-22 | Closing price | 9.9399995803833 |
| 2026-07-23 | Closing price | 9.619999885559082 |
| 2026-07-24 | Closing price | 9.640000343322754 |
| 2026-07-27 | Closing price | 9.760000228881836 |
| 2026-07-28 | Closing price | 9.390000343322754 |
| 2026-07-29 | Closing price | 9.130000114440918 |
| 2026-07-30 | Closing price | 9.640000343322754 |
| 2026-07-31 | Closing price | 9.359999656677246 |
| 2026-08-03 | Closing price | 9.5600004196167 |
| 2026-08-04 | Closing price | 10.210000038146973 |
| 2026-08-05 | Closing price | 10.819999694824219 |
| 2026-08-06 | Closing price | 10.789999961853027 |
| 2026-08-07 | Closing price | 11.449999809265137 |
| 2026-08-10 | Closing price | 12.210000038146973 |
| 2026-08-11 | Closing price | 12.609999656677246 |
| 2026-08-12 | Closing price | 12.100000381469727 |
| 2026-08-13 | Closing price | 11.779999732971191 |
| 2026-08-14 | Closing price | 12.020000457763672 |
| 2026-08-17 | Closing price | 11.920000076293945 |
| 2026-08-18 | Closing price | 11.539999961853027 |
| 2026-08-19 | Closing price | 12.609999656677246 |
| 2026-08-20 | Closing price | 12.640000343322754 |
| 2026-08-21 | Closing price | 12.529999732971191 |
| 2026-08-24 | Closing price | 12.649999618530273 |
| 2026-08-25 | Closing price | 12.829999923706055 |
| 2026-08-26 | Closing price | 13.069999694824219 |
| 2026-08-27 | Closing price | 13.460000038146973 |
| 2026-08-28 | Closing price | 12.770000457763672 |
| 2026-08-31 | Closing price | 12.4399995803833 |
| 2026-09-01 | Closing price | 11.899999618530273 |
| 2026-09-02 | Closing price | 12.779999732971191 |
| 2026-09-03 | Closing price | 13.109999656677246 |
| 2026-09-04 | Closing price | 12.479999542236328 |
| 2026-09-08 | Closing price | 12.430000305175781 |
| 2026-09-09 | Closing price | 12.550000190734863 |
| 2026-09-10 | Closing price | 12.119999885559082 |
| 2026-09-11 | Closing price | 11.90999984741211 |
| 2026-09-14 | Closing price | 11.4399995803833 |
| 2026-09-15 | Closing price | 11.399999618530273 |
| 2026-09-16 | Closing price | 11.180000305175781 |
| 2026-09-17 | Closing price | 12.149999618530273 |
| 2026-09-18 | Closing price | 11.9399995803833 |
| 2026-09-21 | Closing price | 11.829999923706055 |
| 2026-09-22 | Closing price | 12.34000015258789 |
| 2026-09-23 | Closing price | 11.510000228881836 |
| 2026-09-24 | Closing price | 11.34000015258789 |
| 2026-09-25 | Closing price | 11.34000015258789 |
| 2026-09-28 | Closing price | 10.760000228881836 |
| 2026-09-29 | Closing price | 10.829999923706055 |
| 2026-09-30 | Closing price | 10.670000076293945 |
| 2026-10-01 | Closing price | 10.630000114440918 |
| 2026-10-02 | Closing price | 10.579999923706055 |
| 2026-10-05 | Closing price | 10.550000190734863 |
| 2026-10-06 | Closing price | 10.510000228881836 |
| 2026-10-07 | Closing price | 10.039999961853027 |
| 2026-10-08 | Closing price | 10.3100004196167 |
| 2026-10-09 | Closing price | 10.489999771118164 |
| 2026-10-12 | Closing price | 10.300000190734863 |
| 2026-10-13 | Closing price | 10.039999961853027 |
| 2026-10-14 | Closing price | 9.430000305175781 |
| 2026-10-15 | Closing price | 9.760000228881836 |
| 2026-10-16 | Closing price | 9.779999732971191 |
| 2026-10-19 | Closing price | 9.770000457763672 |
| 2026-10-20 | Closing price | 9.260000228881836 |
| 2026-10-21 | Closing price | 9.359999656677246 |
| 2026-10-22 | Closing price | 8.619999885559082 |
| 2026-10-23 | Closing price | 8.4399995803833 |
| 2026-10-26 | Closing price | 8.220000267028809 |
| 2026-10-27 | Closing price | 8.619999885559082 |
| 2026-10-28 | Closing price | 8.609999656677246 |
| 2026-10-29 | Closing price | 8.300000190734863 |
| 2026-10-30 | Closing price | 7.960000038146973 |
| 2026-11-02 | Closing price | 8.15999984741211 |
| 2026-11-03 | Closing price | 7.949999809265137 |
| 2026-11-04 | Closing price | 8.640000343322754 |
| 2026-11-05 | Closing price | 8.34000015258789 |
| 2026-11-06 | Closing price | 8.899999618530273 |
| 2026-11-09 | Closing price | 9.729999542236328 |
| 2026-11-10 | Closing price | 9.319999694824219 |
EV/EBITDA of 6.0 is 13% below its own three-year average of 6.9, but on the portal's spot model the share is 37% above fair value
EV/EBITDA over the last 12 months is 6.0 against its own three-year average of 6.9. The 13% discount means the share is cheaper than its history on this multiple, but the cushion is small.
However, LTM EBITDA of USD 299.2m was earned at past prices. At current prices annual EBITDA is estimated at USD 195.4m on the portal's spot model, 34.7% below LTM. EV/EBITDA at current prices is 9.2, not 6.0.
The portal's spot model, re-pricing EBITDA to current prices at the target multiple, puts fair value 37% below the market. This is our own calculation, not a consensus. P/E over the last 12 months is 42.8, reflecting the low profit of the reported period.
The two yardsticks disagree: the historical multiple points to a small discount, the spot model to a substantial premium of price over value. For a commodity producer the second decides: LTM earnings were earned at prices that no longer exist.
Valuation on the latest reported figures
| Metric | Value |
|---|---|
| Market cap | 2.06 bn USD |
| P/E (LTM) | 42.8 |
| EV/EBITDA (LTM) | 6.0 |
| P/B | 2.93 |
| Net debt / EBITDA (LTM) | -0.88 |
| Operating cash flow (LTM) | 0.35 bn |
| ROE | 2.1% |
| Dividend yield (12m) | 0.1% |
| EV/EBITDA, 3-year average | 6.9 |
Net profit by quarter
| Period | Measure | bn USD |
|---|---|---|
| Q4 2024 | Net profit | 0.02613 |
| Q1 2025 | Net profit | −0.007585 |
| Q2 2025 | Net profit | 0.018126 |
| Q3 2025 | Net profit | −0.011388 |
| Q4 2025 | Net profit | −0.015832000000000002 |
| Q1 2026 | Net profit | −0.000722 |
| Q2 2026 | Net profit | 0.059375 |
| Q3 2026 | Net profit | 0.005315 |
Bottom line
The strong side of the report is the balance sheet: net cash of USD 262.4m and operating cash flow of USD 62.7m against capex of USD 11.1m. The weak side is operational: with silver 57.6% more expensive the company sold less metal, and EBITDA came in 58.9% below the price-implied figure. The swing from loss to USD 5.3m profit looks positive, but profit is small relative to EBITDA and does not change the picture. On the portal's spot model the share trades 37% above fair value, which outweighs the 13% discount to its own history on EV/EBITDA. Our conclusion: rather unattractive. Our view: the share is rather unattractive at the current price; upside on the portal model -37%.